Application Performance Monitoring Open Source: 10 Tools to Know
What is Application Performance Monitoring?
Application Performance Monitoring (APM) involves tracking software application performance and availability. Using APM tools, organizations can detect and diagnose complex application issues, ensuring systems run smoothly. These tools collect multiple data points, such as response times, error rates, and system resource usage, providing insights into performance bottlenecks and anomalies.
APM tools help maintain high service quality, retrieve actionable metrics, and integrate with existing IT workflows. Understanding the underlying mechanics of applications improves operational efficiency, reduces downtime, and contributes to a better user experience.
Benefits of open-source APM tools
There are several open-source tools available that can be used to monitor applications performance. Using these tools offers the following benefits.
Customization
Since the source code is available, organizations can tailor the tool to fit their needs, adding features or modifying existing ones as required. This flexibility allows teams to align the tool’s functionality closely with their operational goals and performance metrics.
Customization is particularly useful for addressing unique industry requirements or integrating with bespoke systems. Unlike closed-source solutions, where feature requests might take months to be considered (if at all), open-source tools allow immediate implementation of necessary changes.
Self-Hosting
Self-hosting allows organizations to run the software on their own infrastructure, giving them complete control over performance monitoring. This option ensures that companies are not reliant on third-party services, which can introduce latency or downtime issues.
By self-hosting, organizations can also optimize the system configuration to better suit their environment and scale resources according to demand. This setup can often result in better performance and more reliable data collection. Self-hosting can also be more cost-effective in the long term.
Data Privacy and Control
By self-hosting these tools, organizations retain full control over their data. This control extends from collection and storage to analysis and disposal, ensuring that sensitive information is handled according to internal policies and regulatory requirements.
In addition to mitigating privacy concerns, maintaining data sovereignty allows organizations to implement stringent security measures tailored to their needs. Open-source APM tools enable this by providing transparency into data handling processes, reducing the risk of unwanted data breaches.
Community Support
An open-source community can offer extensive shared knowledge, ranging from deep technical insights to practical implementation advice. This collaborative environment accelerates problem-solving and innovation, driving the improvement of the tool to better meet user needs.
Being part of an open-source community also means access to resources such as forums, documentation, and regular updates. These resources can significantly reduce the time and effort required to troubleshoot issues, keep the tool up-to-date, and implement new features.
Related content: Read our guide to application performance monitoring tools
Notable open-source APM solutions
1. Prometheus

License: Apache 2.0 license
GitHub Stars: +50k
Repo: https://github.com/prometheus/prometheus
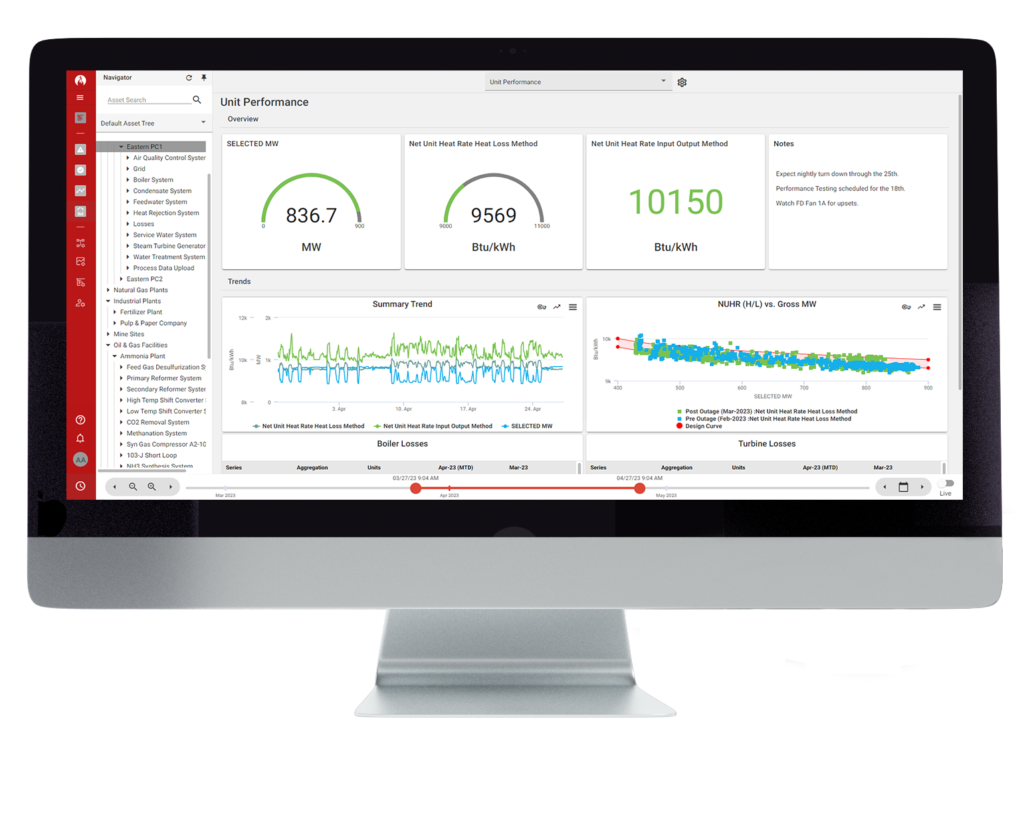
Prometheus is an open-source systems monitoring and alerting toolkit, originally developed at SoundCloud in 2012. It has a large user and developer community and is now a standalone open-source project under the Cloud Native Computing Foundation. Prometheus is widely used for collecting, storing, and querying time series data.
Features:
- Multidimensional data model: Prometheus uses a flexible data model where time series data is identified by a metric name and key/value pairs. This allows for detailed and organized metric collection.
- PromQL (Prometheus Query Language): A versatile query language for leveraging the multi-dimensional nature of the data collected. It supports complex queries and aggregation functions to extract meaningful insights from raw data.
- Autonomous single-server nodes: Each Prometheus server operates independently without relying on distributed storage or additional infrastructure. This ensures reliability and ease of deployment, as each server can function fully on its own.
- Service discovery and static configuration: Prometheus can automatically discover targets through service discovery mechanisms or use static configuration files, offering flexibility in various deployment scenarios.
- Graphing and dashboarding: Prometheus supports multiple modes of graphing and dashboarding, often integrated with tools like Grafana for enhanced visualization and monitoring capabilities.
Source: Prometheus Group
2. Graphite

License: Apache 2.0 license
GitHub Stars: +7k
Repo: https://github.com/GraphiteEditor/Graphite
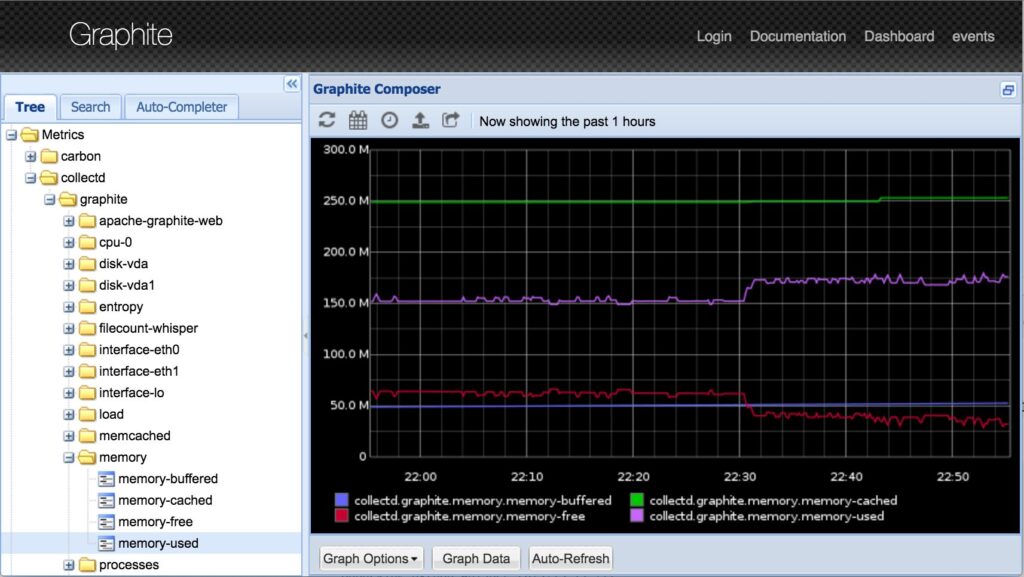
Graphite is an enterprise-ready monitoring tool used to track the performance of websites, applications, business services, and networked servers. It functions equally well on cheap hardware and cloud infrastructure. Developed initially as a side project by Chris Davis at Orbitz in 2006, Graphite has since become a foundational monitoring tool for many large companies. In 2008, Orbitz released Graphite under the open-source Apache 2.0 license.
Features:
- Time-series data storage: The tool stores numeric time-series data, providing a database for performance metrics.
- On-demand graph rendering: Graphite can render detailed graphs of stored data on demand, offering visual insights into performance metrics.
- Simple data ingestion: It simplifies the process of feeding metrics into the time-series database. A single command line can send data to Graphite.
- Extensive ecosystem: Graphite has a large ecosystem of data integrations and third-party tools, ensuring compatibility with numerous data collection agents and language bindings.
- Long-term storage: Graphite ensures long-term data retention through its storage mechanisms, enabling historical analysis of performance metrics.
Source: Graphite
3. SigNoz

License: SigNoz license
GitHub Stars: +17k
Repo: https://github.com/SigNoz/signoz
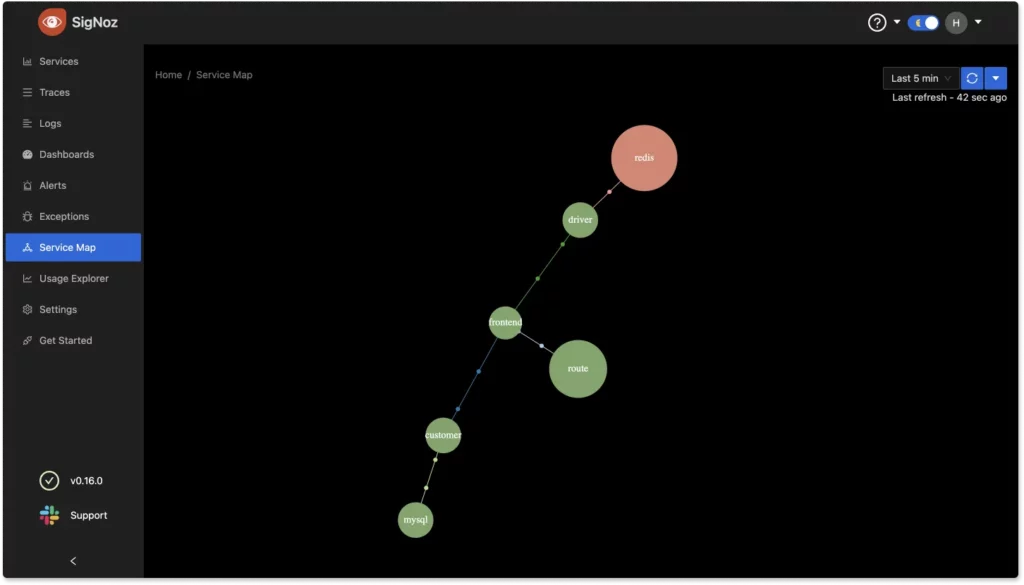
SigNoz is an observability tool that combines APM, logs, metrics, exceptions monitoring, alerts, and dashboards into a single platform. It offers charts and a query builder, enabling teams to gain insights into their data without needing to manage multiple tools. It is used by companies like NetApp, Samsung, and Comcast.
Features:
- Application performance monitoring: SigNoz provides charts for application metrics, including p90 and p99 latency, error rates, and request rates. It allows monitoring of RED (Rate, Errors, Duration) metrics for key operations and provides visibility into database and external service calls.
- Distributed tracing: With SigNoz, users can run aggregates on trace data (sum, avg, p99 latency, etc.) and group trace data by attributes like HTTP URL or service names to identify granular issues. Visualization tools such as flamegraphs and Gantt charts help in understanding the flow of requests across services.
- Metrics & dashboards: SigNoz supports OpenTelemetry metrics SDK and can receive metrics from Prometheus instances. Users can create dashboards for various use cases, including monitoring external calls, API endpoints, and JVM metrics.
- Logs management: SigNoz can ingest, process, and analyze logs at any scale. It supports OpenTelemetry logs and integrates with existing logging pipelines. Features like live tail, easy search, and a logs query builder provide control over log data.
- Exceptions monitoring: The tool records exceptions automatically in languages like Python, Java, Ruby, and JavaScript, providing contextual data, including stack traces and linked span data. It supports exceptions grouping and custom exceptions, and allows navigation from exceptions to related traces to visualize errors in trace graphs.
Source: SigNoz
4. Jaeger

License: Apache 2.0 license
GitHub Stars: ~20k
Repo: https://github.com/jaegertracing/jaeger
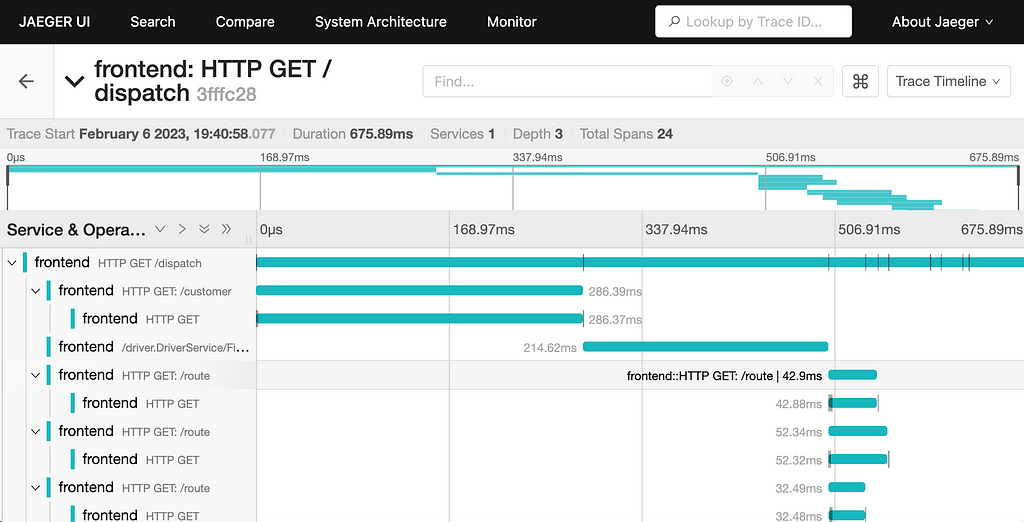
Jaeger is an open-source distributed tracing platform developed by Uber Technologies. It can monitor and troubleshoot distributed workflows, identify performance bottlenecks, track down root causes of issues, and analyze service dependencies. Jaeger supports the OpenTracing and OpenTelemetry standards, providing observability in microservices architectures.
Features:
- Distributed tracing: Jaeger can trace requests across distributed systems, providing insights into the interactions between services. Traces are represented as directed acyclic graphs, allowing for a view of request flows.
- OpenTracing and OpenTelemetry support: Jaeger’s backend, web UI, and instrumentation libraries are built to support the OpenTracing standard and can receive trace data from OpenTelemetry SDKs via the OpenTelemetry Protocol (OTLP).
- Cloud native deployment: Distributed as Docker images, Jaeger supports various configuration methods (command line options, environment variables, configuration files) and can be deployed to Kubernetes clusters using a Kubernetes operator and Helm chart.
- Multiple storage backends: Jaeger natively supports storage backends such as Cassandra, Elasticsearch, and OpenSearch. It also integrates with ClickHouse via a gRPC API and offers embedded database support using Badger and in-memory storage for testing.
- Web UI: The Jaeger Web UI, implemented in JavaScript using frameworks like React, handles large volumes of data. It can display traces with tens of thousands of spans, ensuring scalability for complex systems.
Source: Jaeger
5. Elastic APM

License: Apache 2.0 license
GitHub Stars: ~1.2k
Repo: https://github.com/elastic/apm-server
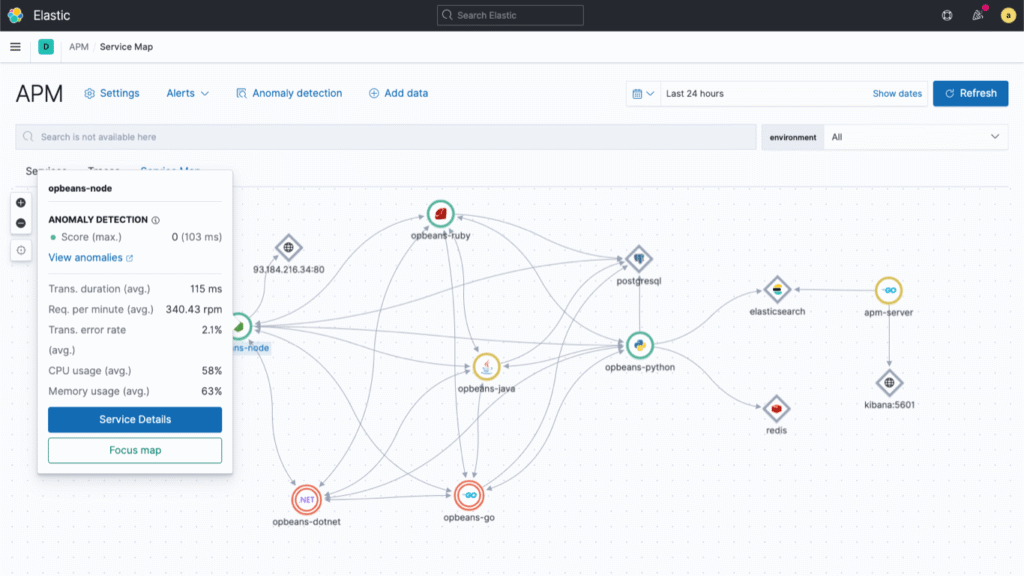
Elastic APM is an open-source application performance monitoring solution integrated within the Elastic Stack. It captures and analyzes distributed transactions across various architectures, including microservices and monolithic systems. Elastic APM supports multiple languages and frameworks, offering transaction metadata and tagging to support analysis.
Features:
- End-to-end distributed tracing: Captures and analyzes transactions across different architectures, including AWS Lambda and other serverless platforms. It supports auto-instrumentation for popular languages such as Java, .NET, PHP, Python, and Go.
- Sampling: Elastic APM’s architecture supports full fidelity, 100% transaction sampling. Tail-based sampling offers control over sampling conditions, ensuring optimal visibility and performance data collection.
- Dependency mapping: Automatically generates curated visual representations of dependencies, including cloud services, messaging systems, data stores, and third-party services.
- Machine learning and AIOps: Uses machine learning for automatic anomaly detection, correlating latency, errors, and failures to accelerate root cause analysis. This makes it easier to identify intermittent and hard-to-pin-down issues.
- CI/CD pipeline visibility: Continuous visibility into application performance changes during deployments helps in identifying and quantifying performance impacts. Integrates with CI/CD tools like Jenkins, Maven, and Ansible using OpenTelemetry plugins to monitor error-prone jobs, slow builds, and flaky tests.
Source: Elastic
6. Apache SkyWalking

License: Apache 2.0 license
GitHub Stars: +23k
Repo: https://github.com/apache/skywalking
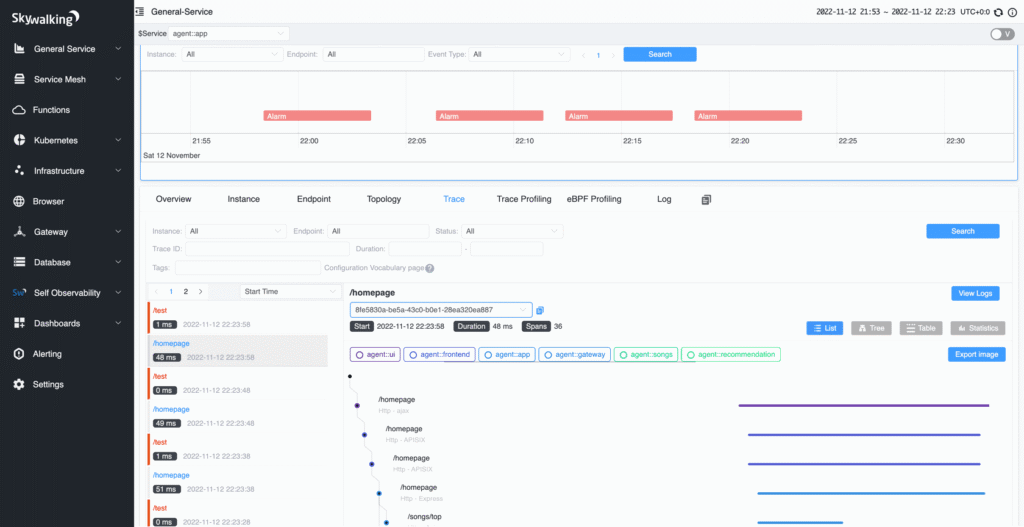
Apache SkyWalking is an APM tool for distributed systems, particularly microservices, cloud-native, and container-based architectures such as Kubernetes. It provides features for monitoring, tracing, and analyzing the performance of services and applications in complex environments.
Features:
- End-to-end distributed tracing: SkyWalking offers distributed tracing capabilities, enabling visibility across microservices. It includes service topology analysis, service-centric observability, and API dashboards to help identify performance bottlenecks and dependencies.
- Agent support: It supports agents for various programming languages and platforms, including Java, .NET Core, PHP, Node.js, Golang, LUA, Rust, C++, client-side JavaScript, and Python.
- eBPF profiling: SkyWalking incorporates eBPF (Extended Berkeley Packet Filter) for monitoring and profiling Kubernetes deployments. The Rover agent uses eBPF to diagnose CPU and network performance issues, providing insights into system behavior.
- Scalability: It can handle the collection and analysis of over 100 billion telemetry data points from a single cluster, making it suitable for large-scale deployments.
- Native APM database: BanyanDB, a native observability database created by the SkyWalking team, is designed to ingest, analyze, and store telemetry data efficiently. This ensures high performance and scalability in data processing.
Source: Apache
7. Pinpoint

License: Apache 2.0 license
GitHub Stars: +13k
Repo: https://github.com/pinpoint-apm/pinpoint
Pinpoint is an APM tool for large-scale distributed systems written in Java and PHP. Based on Google’s Dapper, Pinpoint provides solutions for analyzing the overall structure and interconnections within systems by tracing transactions across distributed applications. It is suitable for understanding application topology and gaining code-level visibility into every transaction.
Features:
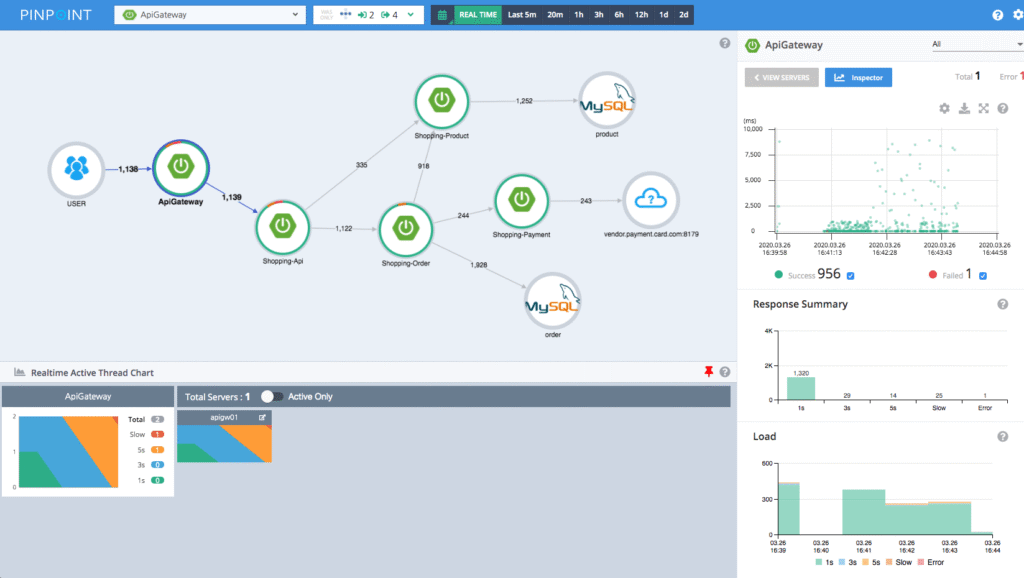
- Application topology visualization: Pinpoint’s ServerMap feature allows users to understand the topology of distributed systems at a glance. It visualizes how components are interconnected, and clicking on a node provides information about the component’s status and transaction count.
- Real-time monitoring: The Realtime Active Thread Chart monitors active threads inside applications in real time, enabling identification of performance issues as they happen.
- Request/response scatter chart: This chart visualizes request counts and response patterns over time, helping identify potential problems. Users can select transactions for analysis by interacting with the chart.
- Code-level transaction visibility: Pinpoint’s CallStack feature provides code-level visibility into every transaction in a distributed environment, allowing users to identify bottlenecks and points of failure.
- Application metrics: The Inspector tool offers details on application performance, including CPU usage, memory/garbage collection metrics, transactions per second (TPS), and JVM arguments. This data helps in diagnosing and optimizing application performance.
Source: Pinpoint
8. Stagemonitor

License: Apache 2.0 license
GitHub Stars: +1.5k
Repo: https://github.com/stagemonitor/stagemonitor
Stagemonitor is an open-source application performance monitoring tool for Java server applications. It provides real-time insights into application performance, helping developers and operations teams collaborate more effectively. Stagemonitor can be deployed in your own data center, ensuring that no data is sent to external services, enhancing data privacy and security.
Features:
- Distributed tracing: Using the OpenTracing API, Stagemonitor enables tracing of requests across distributed systems, providing a view of transaction flows and inter-component interactions.
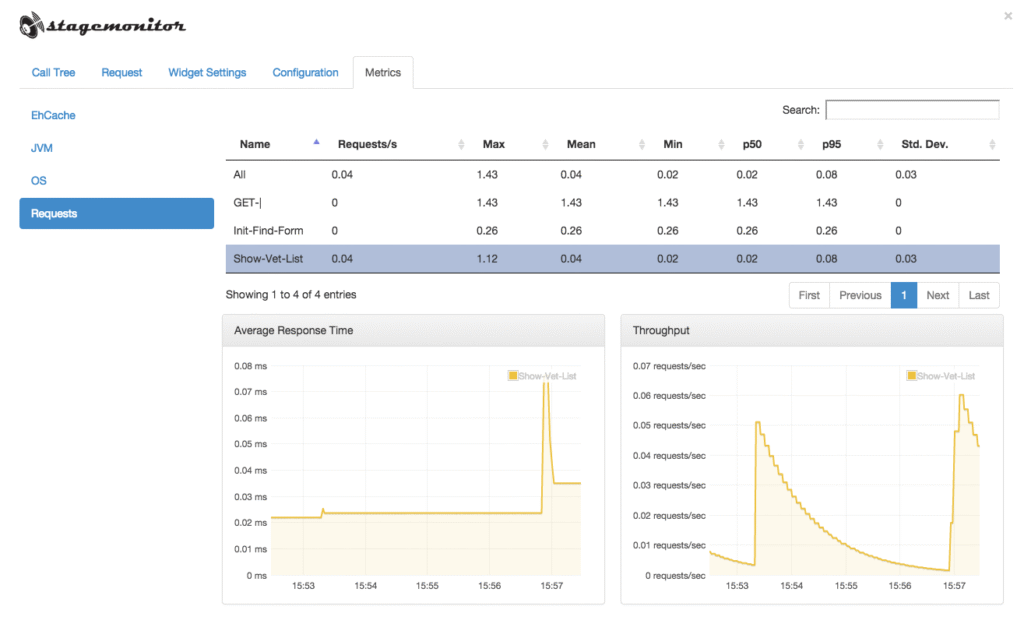
- Real-time metrics: Stagemonitor collects and displays metrics through its Metrics tab, offering immediate feedback without the need for additional databases or visualization tools.
- In-browser widget: The Stagemonitor widget is injected into monitored web pages, providing feedback on method invocations and performance thresholds. It is useful for development, requiring no backend setup.
- Call tree view: This feature displays the method call tree of the current request, including SQL statements, helping identify bottlenecks and performance issues.
- Request trace: Offers a breakdown of request components, including network time, server processing time, DOM processing time, and page rendering time. It includes execution times and counts of database interactions.
Source: Stagemonitor
9. JavaMelody

License: Apache 2.0 license
GitHub Stars: ~3k
Repo: https://github.com/javamelody/javamelody
JavaMelody is an open-source monitoring tool for Java and Java EE applications. It can measure and calculate statistics based on the real operation of applications in QA and production environments. Unlike tools that simulate user requests, JavaMelody focuses on actual usage to provide performance insights. It is lightweight and does not require profiling or a database.
Features:
- Real-time monitoring: JavaMelody measures and calculates statistics on the operation of Java applications, providing insights into average response times and execution counts.
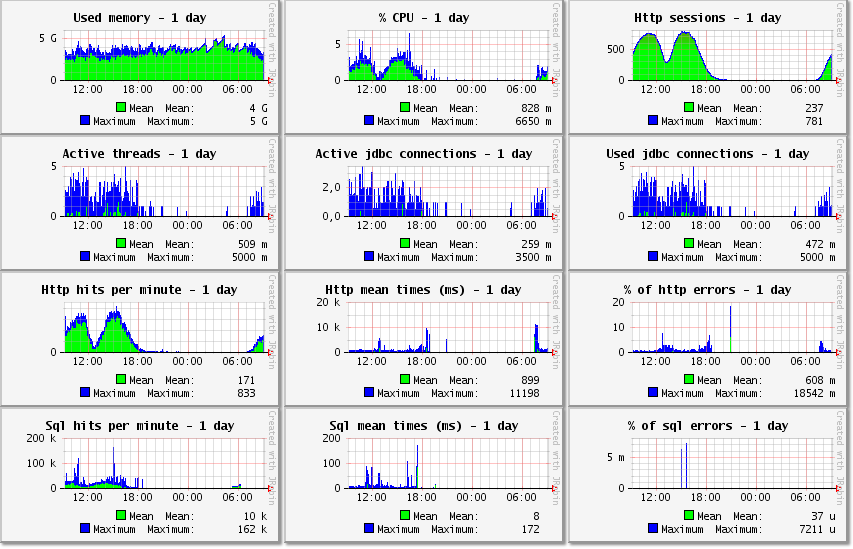
- Evolution charts: The tool includes summary charts showing the evolution over time for performance indicators, such as HTTP requests, SQL queries, JSF actions, Struts actions, JSP pages, and business methods.
- Detailed statistics: It provides statistics for predefined counters, including the number of executions, average execution time, CPU time, and error rates. It also aggregates requests and provides lists with execution metrics.
- Java resource monitoring: The tool monitors Java memory usage, CPU usation, user sessions, and JDBC connections, helping to identify resource bottlenecks and optimize application performance.
- HTTP request analysis: Each HTTP request is analyzed to show the size of the response, the number of SQL executions, and the average SQL time, helping to pinpoint performance issues related to database interactions.
Source: GitHub
10. Scouter

License: Apache 2.0 license
GitHub Stars: +2k
Repo: https://github.com/scouter-project/scouter
Scouter is an open-source APM tool intended for a variety of software environments. Comparable to tools like New Relic and AppDynamics, Scouter provides monitoring capabilities for Java applications, system hosts, and other services through its integration with Telegraf and Zipkin. It helps manage system performance by providing metrics on users, services, and resources.
Features:
- Java monitoring: Scouter’s Java agent monitors web applications on servers like Tomcat, JBoss, and Resin, as well as standalone Java applications. It captures application profiles, including method profiles, SQL profiles, and external call profiles.
- Host monitoring: The host agent supports monitoring for Linux, Windows, and Unix systems. It provides metrics such as CPU usage, memory utilization, network activity, and heap usage, offering a view of system performance.
- Telegraf integration: Scouter extends its monitoring capabilities to services through Telegraf support, covering Redis, NGINX, Apache HTTPD, HAProxy, Kafka, MySQL, MongoDB, RabbitMQ, Elasticsearch, Kubernetes, and Mesos.
- Zipkin integration: From version 2.5.0 onwards, Scouter supports Zipkin instrumentation, enabling it to display tracing information from languages such as C#, Go, Python, JavaScript, and PHP in XLog (Scatter) charts.
- Real-time and historical data: Scouter provides real-time monitoring and historical data analysis, enabling performance tracking and retrospective analysis to identify trends and issues.
Conclusion
In conclusion, open-source Application Performance Monitoring (APM) tools offer powerful capabilities for organizations looking to optimize application performance, ensure system reliability, and enhance user experience. With their flexibility, self-hosting options, and strong community support, these tools provide comprehensive monitoring and troubleshooting solutions that can be customized to meet specific business needs.
However, for organizations seeking even more advanced capabilities, Coralogix stands out as a strong alternative. By offering not only performance monitoring but also a seamless integration of observability features, Coralogix empowers teams to maintain operational efficiency and improve system visibility. Whether opting for an open-source APM solution or a more robust platform like Coralogix, investing in the right monitoring tools is crucial for driving better application performance and delivering exceptional user experiences.
Learn about Coralogix for Application Performance Monitoring


