Integrating Coralogix Real User Monitoring with the OpenTelemetry Demo Code base

Before You Begin
Prerequisites
- Docker: Latest stable version for building the OTel Demo application.
- Coralogix Account: You’ll need this for testing and visualization, along with a valid API key for the backend telemetry data. And a valid RUM Data API key for the frontend telemetry data. Visit www.coralogix.com and create a free account.
- Basic Knowledge: Familiarity with Docker, YAML, and monitoring concepts
- the OpenTelemetry Demo code-base from GitHub to your local machine. Make sure that you switch branches to the latest version, not main. As of time of writing this I am using version 2.0.0.
- Environment: MacBook Air M3, Visual Studio Code
Estimated Time to complete the integration: 10-15 minutes
Configure Coralogix as a backend
OpenTelemetry acts as a universal translator for your observability data by standardizing logs, metrics, and traces across different sources, simplifying the configuration of the OpenTelemetry Collector to export data to various backends. Instead of requiring custom instrumentation for each backend (e.g. Coralogix, Prometheus, Jaeger), OpenTelemetry decouples data collection from vendor-specific implementations, allowing seamless backend switching without modifying application code. The Collector serves as a middleware that ingests, processes, and exports data in a unified format, with configuration defining pipelines for receivers, processors, and exporters. This enables effortless backend migration—switching from Jaeger to Coralogix or adding multiple exporters requires only minor config updates. By normalizing data, OpenTelemetry eliminates vendor lock-in, simplifies multi-backend support, and significantly reduces instrumentation complexity, making it the ideal observability solution.
In the OpenTelemetry Demo code-base navigate to, ./src/otel-colletor/otelcol-config.yml, here you will see the configuration for the OpenTelemetry Collector. To gain a better understanding of how this works, let’s break down the key components that make this possible.
OpenTelemetry Collector Core Components
Receiver: The front door for your telemetry data. It collects information from your applications or external sources like OTLP.
Processor: Your data’s quality control department, handling tasks like batching and metadata enrichment.
Exporter: The delivery service, responsible for sending your processed data to a backend.
Service Pipeline: This orchestrates the data flow, defining processing steps and proper routing.
In the OpenTelemetry Demo code-base navigate to ./src/otel-colletor/otelcol-config-extras.yml, here you add the additional configuration for the OpenTelemetry Collector to export telemetry data to Coralogix. Below is an example of the code you will need to add to ./src/otel-colletor/otelcol-config-extras.yml. You will need a valid API Key from your Coralogix account and your Coralogix Region, which can be found here.
Code Snippet for Exporting to Coralogix
exporters:
  coralogix:
    domain: "<YOUR_CORALOGIX_REGION>"
    private_key: "<YOUR_CORALOGIX_API_KEY>"
    application_name: "<YOUR_APPLICATION_NAME>"
    subsystem_name: "<YOUR_SUBSYSTEM_NAME>"
    timeout: 30s

service:
  pipelines:
    traces:
      exporters: [spanmetrics, coralogix]
    logs:
      exporters: [coralogix]
    metrics:
      exporters: [coralogix]
Once this configuration is added, you can now start the OpenTelemetry Demo application executing the Docker command below. I am using Visual Code for this and ran the code below from the integrated terminal at the root directory.
docker compose up --build --force-recreate --remove-orphans --detachThis may take some time to build and start up if you are running it for the first time. Once all the containers are started, you should see the status of each container in Docker Desktop.
The OpenTelemetry Demo Web Store is accessible at: http://localhost:8080/
For full details about the OpenTelemetry Demo Web Store visit here.
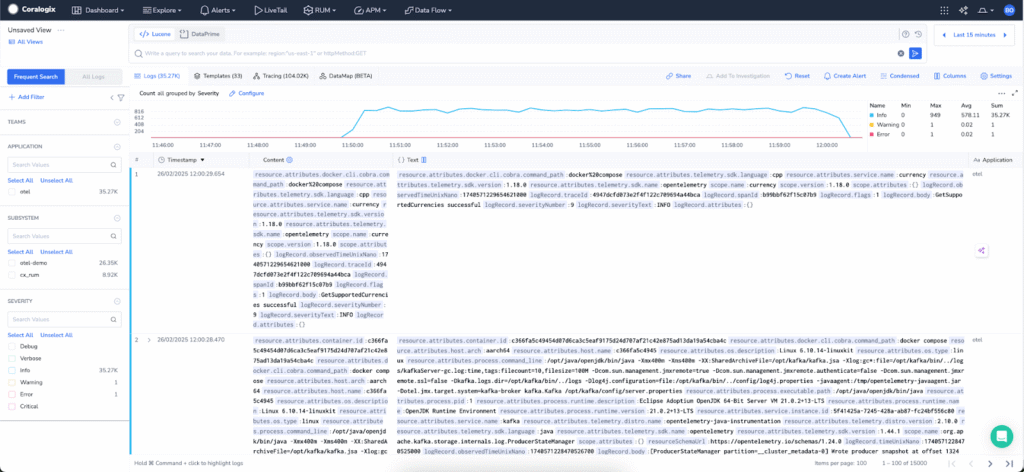
When you navigate to your Coralogix account you will see telemetry data from the OpenTelemetry Demo Web Store applications
Integrating Coralogix Real User Monitoring
While OpenTelemetry provides robust backend tracing, frontend visibility forms a crucial part of Root Cause Analysis – because you need to know where to start – and that is with what the user was doing, just as your application went bang. Coralogix provides a JavaScript SDK designed to capture frontend performance metrics, errors, interactions, and session recordings for Real User Monitoring.
The benefits you get with Coralogix’s Real User Monitoring are; automatic instrumentation for network requests, errors, and interactions. Session recording, capturing real-time user sessions. Web vitals tracking, improving Core Web Vitals like Largest Contentful Paint (LCP), First Input Delay (FID), and Cumulative Layout Shift (CLS). And all of this means a deep integration with OpenTelemetry for a unified observability pipeline, giving you full-stack observability.
Adding the Coralogix RUM SDK
Now for some code, let’s then dive into how to instrument this into OpenTelemetry Demo’s Next.js frontend. This was my first experience with Next.js and I was very nervous about how I was going to edit a code-base written by really great engineers without turning it into mush. But as you will see, this integration is really straightforward and will have you observing your user’s actions in no time. In this guide, I will walk you through how I integrated Coralogix’s Real User Monitoring into the OpenTelemetry Demo Application, enabling seamless instrumentation for the frontend. I didn’t manage all of this by myself, I had great help from my colleague, David Bott, who gave great mentorship and guidance with its integration (and most of the configuration settings).
1 – Install the Coralogix RUM Browser SDK
Install the Coralogix RUM Browser SDK to the frontend code at ./src/otel-colletor/frontend. This will ensure when you write the integration code you won’t get errors and the package.json file will have the Coralogix RUM dependency.
npm install @coralogix/browser2 – Add Coralogix RUM key values
Open the file ./env and add the following code with your values,
# Coralogix

CORALOGIX_RUM_ENV=<YOUR_SUBSYSTEM_NAME>

CORALOGIX_RUM_APP=<YOUR_APPLICATION_NAME>

CORALOGIX_RUM_KEY=<YOUR_CORALOGIX_RUM_API_KEY>

CORALOGIX_RUM_ENABLE=true

CORALOGIX_RUM_DOMAIN=<YOUR_CORALOGIX_REGION>

CORALOGIX_RUM_VERSION=1.0.0

CORALOGIX_RUM_SDK_URL=https://cdn.rum-ingress-coralogix.com/coralogix/browser/latest/coralogix-browser-sdk.js

CORALOGIX_RUM_USER_EMAIL=<YOUR_USER_EMAIL>

CORALOGIX_RUM_USER_NAME=<YOUR_USER_NAME>

CORALOGIX_RUM_USER_ID=<YOUR_USER_ID>
The user settings I have added just for the demo and could be configured differently in a real system.
3 – Map the Environment Variables to the Frontend Service
Open the file ./docker-compose.yml and go to the frontend service and the environment variable configuration, here add the additional environment variables.
 environment:
      ...
      - CORALOGIX_RUM_ENABLE
      - CORALOGIX_RUM_ENV
      - CORALOGIX_RUM_APP
      - CORALOGIX_RUM_KEY
      - CORALOGIX_RUM_DOMAIN
      - CORALOGIX_RUM_VERSION
      - CORALOGIX_RUM_SDK_URL
      - CORALOGIX_RUM_USER_EMAIL
      - CORALOGIX_RUM_USER_NAME
      - CORALOGIX_RUM_USER_ID
4 – Add strongly-typed access environment variables
Open the file ./src/frontend/pages/_app.tsx and add the NEXT_PUBLIC_CORALOGIX_RUM variables to the code,
declare global {
  interface Window {
    ENV: {
      NEXT_PUBLIC_PLATFORM?: string;
      NEXT_PUBLIC_OTEL_SERVICE_NAME?: string;
      NEXT_PUBLIC_OTEL_EXPORTER_OTLP_TRACES_ENDPOINT?: string;
      IS_SYNTHETIC_REQUEST?: string;
      NEXT_PUBLIC_CORALOGIX_RUM_ENV?: string;
      NEXT_PUBLIC_CORALOGIX_RUM_APP?: string;
      NEXT_PUBLIC_CORALOGIX_RUM_KEY?: string;
      NEXT_PUBLIC_CORALOGIX_RUM_ENABLE?: string;
      NEXT_PUBLIC_CORALOGIX_RUM_DOMAIN?: string;
      NEXT_PUBLIC_CORALOGIX_RUM_VERSION?: string;
      NEXT_PUBLIC_CORALOGIX_RUM_SDK_URL?: string;
      NEXT_PUBLIC_CORALOGIX_RUM_USER_EMAIL?: string;
      NEXT_PUBLIC_CORALOGIX_RUM_USER_NAME?: string;
      NEXT_PUBLIC_CORALOGIX_RUM_USER_ID?: string;
    };
  }
}
5 – Add new React component is responsible for loading and initializing Coralogix RUM
To load the Coralogix RUM SDK dynamically to ensure it doesn’t block page rendering. Navigate to, ./src/otel-colletor/frontend/pages, and create a new file, ./src/otel-colletor/frontend/pages/_coralogix.tsx, and add the code below,
'use client';
import { useEffect } from 'react';

interface CoralogixRumSDK {
    init: (config: Record<string, unknown>) => void;
    screenshot?: (message: string) => string;
}

export default function CoralogixRumInit() {
    useEffect(() => {
        const loadScript = async () => {
            const env = (window as unknown as {
                ENV?: {
                    NEXT_PUBLIC_CORALOGIX_RUM_SDK_URL?: string;
                    NEXT_PUBLIC_CORALOGIX_RUM_ENV?: string;
                    NEXT_PUBLIC_CORALOGIX_RUM_APP?: string;
                    NEXT_PUBLIC_CORALOGIX_RUM_VERSION?: string;
                    NEXT_PUBLIC_CORALOGIX_RUM_KEY?: string;
                    NEXT_PUBLIC_CORALOGIX_RUM_DOMAIN?: string;
                    NEXT_PUBLIC_CORALOGIX_RUM_USER_EMAIL?: string;
                    NEXT_PUBLIC_CORALOGIX_RUM_USER_NAME?: string;
                    NEXT_PUBLIC_CORALOGIX_RUM_USER_ID?: string;
                }
            }).ENV || {};

            const scriptSrc: string = env.NEXT_PUBLIC_CORALOGIX_RUM_SDK_URL || "";

            if (document.querySelector(`script[src="${scriptSrc}"]`)) {
                console.log("Coralogix RUM script already loaded.");
                return;
            }

            const script = document.createElement('script');
            script.src = scriptSrc;
            script.async = true;
            script.onload = () => {
                console.log('Coralogix RUM script loaded successfully!');

                const coralogixRum = (window as unknown as { CoralogixRum?: CoralogixRumSDK }).CoralogixRum;

                if (coralogixRum) {
                    console.log('Initializing Coralogix RUM...');
                    coralogixRum.init({
                        environment: env.NEXT_PUBLIC_CORALOGIX_RUM_ENV || "",
                        application: env.NEXT_PUBLIC_CORALOGIX_RUM_APP || "",
                        debug: true,
                        version: env.NEXT_PUBLIC_CORALOGIX_RUM_VERSION || "",
                        public_key: env.NEXT_PUBLIC_CORALOGIX_RUM_KEY || "",
                        coralogixDomain: env.NEXT_PUBLIC_CORALOGIX_RUM_DOMAIN || "",
                        user_context: {
                            user_email: env.NEXT_PUBLIC_CORALOGIX_RUM_USER_EMAIL || "",
                            user_name: env.NEXT_PUBLIC_CORALOGIX_RUM_USER_NAME || "",
                            user_id: env.NEXT_PUBLIC_CORALOGIX_RUM_USER_ID || "",
                        },
                        sessionConfig: {
                            sessionSampleRate: 100,
                            alwaysTrackSessionsWithErrors: true,
                        },
                        instrumentations: {
                            errors: true,
                            fetch: true,
                            xhr: true,
                            custom: true,
                            long_tasks: true,
                            resources: true,
                            interactions: true,
                            web_vitals: true,
                        },
                        sessionRecordingConfig: {
                            enable: true,
                            autoStartSessionRecording: true,
                            maskInputOptions: { password: true },
                            recordConsoleEvents: true,
                            recordCanvas: true,
                        },
                        traceParentInHeader: {
                            enabled: true,
                            options: {
                                propagateTraceHeaderCorsUrls: [
                                    new RegExp('http://*'),
                                    new RegExp('https://*')
                                ],
                                propagateB3TraceHeader: {
                                    singleHeader: true,
                                    multiHeader: true,
                                },
                                propagateAwsXrayTraceHeader: true,
                            },
                        },
                        beforeSend: (event: Record<string, unknown>) => {
                            if ((event.event_context as { type?: string })?.type === 'error') {
                                const screenshotId = coralogixRum.screenshot?.('Creating a screenshot due to an error!');
                                (event as { screenshotId?: string }).screenshotId = screenshotId;
                            }
                            return event;
                        },
                        labels: {
                            runningFrom: 'MacHost',
                        },
                    });
                } else {
                    console.error('Coralogix RUM failed to initialize.');
                }
            };

            document.body.appendChild(script);
        };

        loadScript();
    }, []);

    return null;
}
6 – Inject environment variables for the frontend.
Open the file ./src/frontend/pages/_document.tsx and add the following code to extract the server-side environment variables from process.env
const {
  ENV_PLATFORM,
  WEB_OTEL_SERVICE_NAME,
  PUBLIC_OTEL_EXPORTER_OTLP_TRACES_ENDPOINT,
  OTEL_COLLECTOR_HOST,
  CORALOGIX_RUM_ENV,
  CORALOGIX_RUM_APP,
  CORALOGIX_RUM_KEY,
  CORALOGIX_RUM_ENABLE,
  CORALOGIX_RUM_DOMAIN,
  CORALOGIX_RUM_VERSION,
  CORALOGIX_RUM_SDK_URL,
  CORALOGIX_RUM_USER_EMAIL,
  CORALOGIX_RUM_USER_NAME,
  CORALOGIX_RUM_USER_ID,
} = process.env;
Next, inject the environment variables into window.ENV
const envString = `
  window.ENV = {
    NEXT_PUBLIC_PLATFORM: '${ENV_PLATFORM}',
    NEXT_PUBLIC_OTEL_SERVICE_NAME: '${WEB_OTEL_SERVICE_NAME}',
    NEXT_PUBLIC_OTEL_EXPORTER_OTLP_TRACES_ENDPOINT: '${otlpTracesEndpoint}',
    IS_SYNTHETIC_REQUEST: '${isSyntheticRequest}',
    NEXT_PUBLIC_CORALOGIX_RUM_ENV: '${CORALOGIX_RUM_ENV}',
    NEXT_PUBLIC_CORALOGIX_RUM_APP: '${CORALOGIX_RUM_APP}',
    NEXT_PUBLIC_CORALOGIX_RUM_KEY: '${CORALOGIX_RUM_KEY}',
    NEXT_PUBLIC_CORALOGIX_RUM_ENABLE: '${CORALOGIX_RUM_ENABLE}',
    NEXT_PUBLIC_CORALOGIX_RUM_DOMAIN: '${CORALOGIX_RUM_DOMAIN}',
    NEXT_PUBLIC_CORALOGIX_RUM_VERSION: '${CORALOGIX_RUM_VERSION}',
    NEXT_PUBLIC_CORALOGIX_RUM_SDK_URL: '${CORALOGIX_RUM_SDK_URL}',
    NEXT_PUBLIC_CORALOGIX_RUM_USER_EMAIL: '${CORALOGIX_RUM_USER_EMAIL}',
    NEXT_PUBLIC_CORALOGIX_RUM_USER_NAME: '${CORALOGIX_RUM_USER_NAME}',
    NEXT_PUBLIC_CORALOGIX_RUM_USER_ID: '${CORALOGIX_RUM_USER_ID}',
  };`;
This makes sure frontend components can access these variables without exposing them in the build.
7 – Ensure that CoralogixRumInit only runs in the browser.
Open the file ./src/frontend/pages/_app.tsx and ensure that CoralogixRumInit only runs in the browser. Why? Next.js can render on the server, but window is only available in the browser.
First, add the import statement to bring in the CoralogixRumInit component from the ./src/frontend/pages/_coralogix.tsx file.
import CoralogixRumInit from './_coralogix';Next, ensure that Coralogix RUM is only initialized on the client (since the window is not available on the server). This means that every page in the app automatically initializes Coralogix RUM without needing to manually add it.
function MyApp({ Component, pageProps }: AppProps) {
  return (
    <ThemeProvider theme={Theme}>
      <OpenFeatureProvider>
        <QueryClientProvider client={queryClient}>
          <CurrencyProvider>
            <CartProvider>
               {typeof window !== 'undefined' && <CoralogixRumInit />}
              <Component {...pageProps} />
            </CartProvider>
          </CurrencyProvider>
        </QueryClientProvider>
      </OpenFeatureProvider>
    </ThemeProvider>
  );
}
And that is all you need to integrate Coralogix’s Real User Monitoring into the OpenTelemetry Demo application.
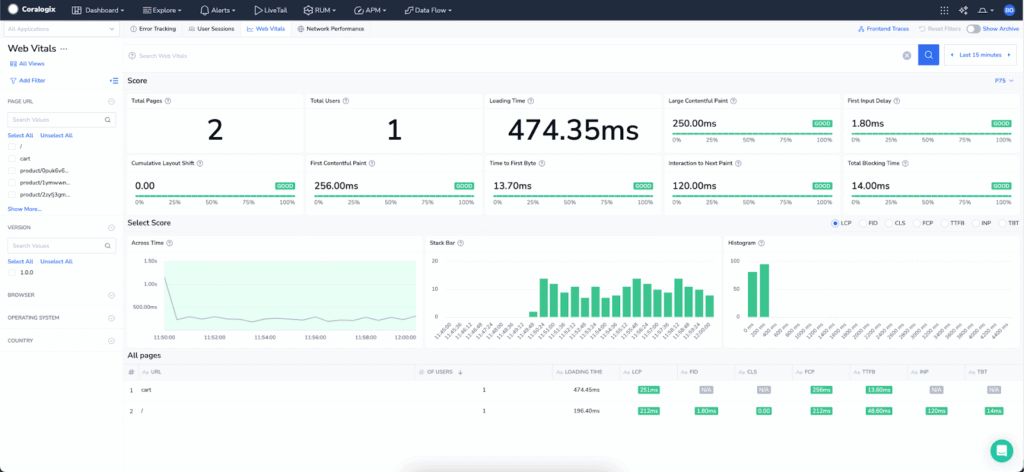
When you navigate to “RUM > Web Vitals” in your Coralogix account you will see the telemetry data from the OpenTelemetry Demo Web Store.