Sending Datadog Agent Core Metrics and Application Performance Monitoring (APM) Traces to Coralogix Using OTel’s Datadog Receiver

Before You Begin
Prerequisites
- Kubernetes Cluster: This guide uses Kind for local development, Kind runs Kubernetes inside a Docker container. The Kubernetes team uses Kind to test Kubernetes itself.
- Tilt: Tilt is a tool designed to simplify and accelerate the development of applications in a Kubernetes environment.
- Docker: Latest stable version for building the Datadog Agent and OTel Collector images.
- Coralogix Account: You’ll need this for testing and visualization, along with a valid API key.
- Basic Knowledge: Familiarity with Kubernetes, YAML, and monitoring concepts
- Environment: MacBook Air M3
Estimated Time: 30-45 minutes
⚠️ Important Note: Before beginning this migration:
- Back up your existing configurations
- Test in a non-production environment first
Understanding the Architecture
OpenTelemetry has revolutionized observability by providing a vendor-neutral, open-source standard for collecting and transferring telemetry data. Think of it as a universal translator for your observability data – it’s free to use and platform-agnostic, putting control back in your hands.
Let’s break down the key components that make this possible.
Core Components
Receiver The front door for your telemetry data. It collects information from your applications or external sources like OTLP and in our case, a DataDog Agent. The Port Number, “8226”, has been chosen to ensure there are no Port clashes.
receivers:
  datadog:
    endpoint: 0.0.0.0:8226
...
Processor Your data’s quality control department, handling tasks like batching and metadata enrichment
processors:
  batch/traces:
    timeout: 5s
  batch/metrics:
    timeout: 10s
Exporter The delivery service, responsible for sending your processed data to Coralogix.
Coralogix domains can be viewed here.
exporters:
  coralogix:
    domain: "<YOUR_CORALOGIX_REGION>"
    private_key: "<YOUR_API_KEY>"
    application_name: "<YOUR_APPLICATION_NAME>"
    subsystem_name: "<YOUR_SUBSYSTEM_NAME>"
...
Service Pipeline This orchestrates the data flow defining processing steps and proper routing.
In this case, we take the spans and metrics from the datadog receiver, and sending them to the Coralogix receiver we defined in the previous section
service:
  pipelines:
    traces:
      receivers: [datadog]
      processors: [batch/traces]
      exporters: [coralogix]
    metrics:
      receivers: [datadog]
      processors: [batch/metrics]
      exporters: [coralogix]
...
How It Works
Lastly, before we begin it’s important to understand our goals and the flow.
- Data Collection
- You still use your DD Trace library and Dogstatsd/ infra exporters
- You still send data and collect data to/with your Datadog Agent
- No changes to your application code and containers – Transparent
- Maintains existing Datadog functionality
- Data Processing
- OpenTelemetry Collector receives data from your Datadog agent via the datadog receiver
- Handles batching and optimization
- Ensures data quality
- Data Delivery
- Forwards to Coralogix platform
- Maintains data fidelity
- Enables cost optimization
Implementation guide
1: Environment setup
Let’s start by preparing our environment. We’ll use a local Kubernetes cluster with Kind for this demonstration, this is based on using a MacBook Air M3 and Homebrew.
Install Homebrew:
$ /bin/bash -c "$(curl -fsSL https://raw.githubusercontent.com/Homebrew/install/HEAD/install.sh)"
Install dependencies:
$ brew install kubectl
$ brew install kind
$ brew install tilt-dev/tap/tilt
2: Configure the Datadog Agent
First, we’ll configure the Datadog Agent to forward telemetry to our OpenTelemetry Collector. The key DataDog Agent environment variables that we require to forward, Datadog Agent Core Metrics, which are forwarded automatically to the OTel Collector, and Application Performance Monitoring Traces to Coralogix are:
Required Environment Variables:
- name: DD_APM_ENABLED
  value: "true"
- name: DD_APM_RECEIVER_PORT
  value: "8126"
- name: DD_APM_NON_LOCAL_TRAFFIC
  value: 'true'
- name: DD_APM_ADDITIONAL_ENDPOINTS
  value: "{"http://otel-collector:8226": ["abc12345efgh6789ijklmnopqrstuvwx"]}"
- name: DD_ADDITIONAL_ENDPOINTS
  value: "{"http://otel-collector:8226": ["abc12345efgh6789ijklmnopqrstuvwx"]}"
Datadog Agent Deployment Configuration:
---
apiVersion: apps/v1
kind: Deployment
metadata:
  name: datadog-agent
  namespace: dd-to-otel-to-coralogix
spec:
  replicas: 1
  selector:
    matchLabels:
      app: datadog-agent
  template:
    metadata:
      labels:
        app: datadog-agent
    spec:
      containers:
      - name: datadog-agent
        image: datadog/agent:latest
        imagePullPolicy: IfNotPresent
        ports:
          - name: http
            containerPort: 8126
            protocol: TCP
        resources:
          limits:
            cpu: "600m"
            memory: "512Mi"
          requests:
            cpu: "300m"
            memory: "256Mi"
        env:
        - name: DD_SITE
          value: "datadoghq.eu"
        - name: DD_API_KEY
          value: "abc12345efgh6789ijklmnopqrstuvwx"
        - name: DD_HOSTNAME
          value: "k8s-local-datadog-agent"
        - name: DD_APM_ENABLED
          value: "true"
        - name: DD_APM_RECEIVER_PORT
          value: "8126"
        - name: DD_APM_NON_LOCAL_TRAFFIC
          value: 'true'
        - name: DD_APM_ADDITIONAL_ENDPOINTS
          value: "{"http://otel-collector:8226": ["abc12345efgh6789ijklmnopqrstuvwx"]}"
        - name: DD_ADDITIONAL_ENDPOINTS
          value: "{"http://otel-collector:8226": ["abc12345efgh6789ijklmnopqrstuvwx"]}"
---
3. Configure OpenTelemetry Collector
The OpenTelemetry Collector is our bridge to Coralogix. Here’s the configuration that makes it all work, it consists of a Deployment, ConfigMap and Service manifests:
OpenTelemetry Collector Deployment Configuration
---
apiVersion: apps/v1
kind: Deployment
metadata:
  name: otel-collector
  namespace: dd-to-otel-to-coralogix
  labels:
    app: otel-collector
spec:
  replicas: 1
  selector:
    matchLabels:
      app: otel-collector
  template:
    metadata:
      labels:
        app: otel-collector
    spec:
      containers:
      - name: otel-collector
        image: otel/opentelemetry-collector-contrib:latest
        imagePullPolicy: IfNotPresent
        args: ["--config", "/otel-config.yaml"]
        env:
        - name: CORALOGIX_DOMAIN
          value: "<YOUR_CORALOGIX_DOMAIN>"
        - name: CORALOGIX_APP_NAME
          value: "<YOUR_CORALOGIX_APP_NAME>"
        - name: CORALOGIX_SUBSYS_NAME
          value: "<YOUR_CORALOGIX_SUBSYS_NAME>"
        - name: CORALOGIX_PRIVATE_KEY
          value: "<YOUR_CORALOGIX_PRIVATE_KEY>"
        volumeMounts:
        - name: otel-config
          mountPath: /otel-config.yaml
          subPath: otel-config.yaml
        ports:
        - containerPort: 8226
          protocol: TCP
      volumes:
      - name: otel-config
        configMap:
          name: otel-config
---
apiVersion: v1
kind: ConfigMap
metadata:
  name: otel-config
  namespace: dd-to-otel-to-coralogix
data:
  otel-config.yaml: |
    receivers:
      datadog:
        endpoint: 0.0.0.0:8226

    exporters:
      debug:
        verbosity: detailed
      coralogix:
        domain: "<YOUR_CORALOGIX_DOMAIN>"
        private_key: "<YOUR_CORALOGIX_PRIVATE_KEY>"
        application_name: "<YOUR_CORALOGIX_APP_NAME>"
        subsystem_name: "<YOUR_CORALOGIX_SUBSYS_NAME>"
        timeout: 60s

    service:
      pipelines:
        traces:
          receivers: [datadog]
          exporters: [debug, coralogix]
        metrics:
          receivers: [datadog]
          exporters: [debug, coralogix]
---
apiVersion: v1
kind: Service
metadata:
  name: otel-collector
  namespace: dd-to-otel-to-coralogix
spec:
  selector:
    app: otel-collector
  ports:
    - name: datadog
      port: 8226
      protocol: TCP
      targetPort: 8226
type: ClusterIP
---
Apply the Manifests via Tilt using the Titlfile configuration:
load('ext://namespace', 'namespace_create')
namespace_create('dd-to-otel-to-coralogix')

def datadog_service():
    k8s_yaml('./datadog-agent-manifest.yaml')
    k8s_resource('datadog-agent',
                 port_forwards=['8126:8126'],
                 labels="datadog-agent")

def opentelemetry_service():
    k8s_yaml('./otel-collector-manifest.yaml')
    k8s_resource('otel-collector',
                 port_forwards=['8226:8226'],
                 labels="otel-collector")

datadog_service()
opentelemetry_service()
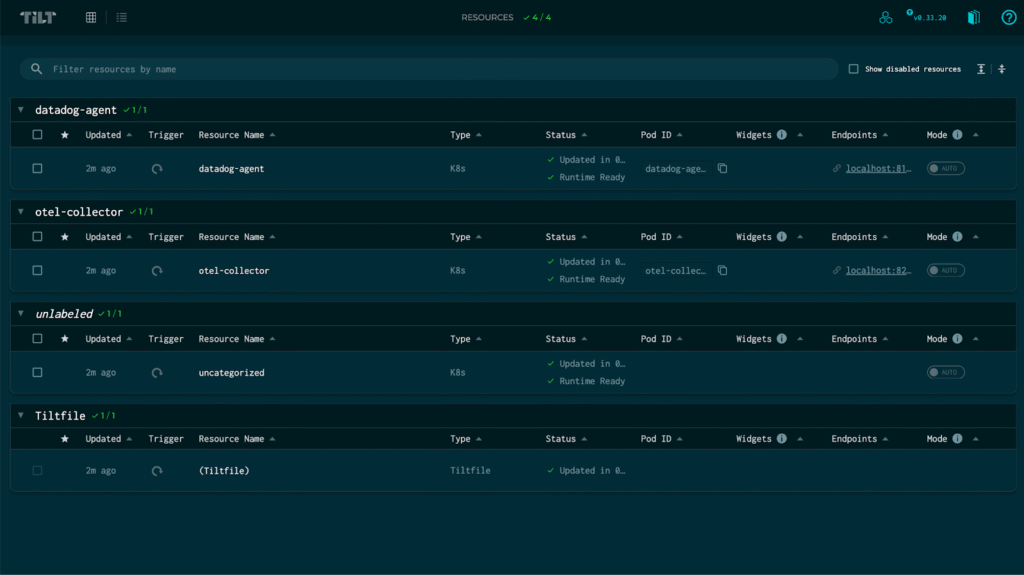
Deploy and Validate
Deploy Steps
First, create a Kind Cluster to host the DataDog Agent and the OTel Collector:
$ kind create cluster --name dd-to-otel-to-coralogix-cluster
When the cluster has started, execute the Starlark code in the Tiltfile:
$ cd ./path/to/the/folder/of/the/tiltfile
$ tilt up
Navigate to the URL – http://localhost:10350/overview
Once both deployments have completed successfully you will see the following:
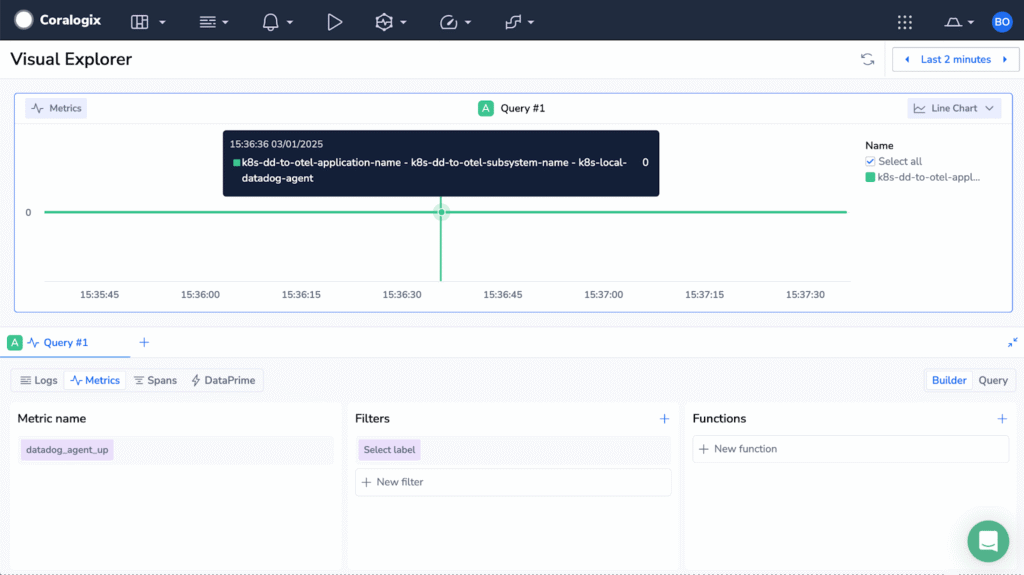
Datadog Agent Core Metrics in Coralogix
The DataDog Agent Core Metrics are now available to view in the Coralogix Platform:
Sending Application Performance Monitoring Traces to Coralogix Using OTel’s DataDog Receiver
As this is a Proof of Concept I have written a simple Python application to mock traces being sent to the DataDog agent at http://localhost:8126/v0.4/traces
from ddtrace import tracer, patch_all
import random
import requests
import time
patch_all()

@tracer.wrap(name="http.request", service="<YOUR_CORALOGIX_APP_NAME>")
def make_request():
    url = "http://localhost:8126/v0.4/traces"
    headers = {"Content-Type": "application/json"}

    trace_id = random.randint(1, 2**63 - 1)
    span_id = random.randint(1, 2**63 - 1)
    parent_id = random.randint(1, 2**63 - 1)

    print(f"Trace ID: {trace_id}, Span ID: {span_id}, Parent ID: {parent_id}")

    duration = random.randint(100, 2000) * 1_000_000
    payload = [
        [
            {
               "trace_id": trace_id,
                "span_id": span_id,
                "parent_id": parent_id,
                "name": "<YOUR_CORALOGIX_SUBSYS_NAME>",
                "resource": "/",
                "service": "datadog-agent-mock-service",
                "type": "web",
                "start": int(time.time() * 1_000_000_000),
                "duration": duration
            }
        ]
    ]

    with tracer.trace("client.http") as span:
        span.set_tag("http.method", "POST")
        span.set_tag("http.url", url)

        try:
            response = requests.post(url, json=payload, timeout=5)
            span.set_tag("http.status_code", response.status_code)
            span.set_tag("http.response_headers", str(response.headers))
            print(f"Request sent. Status Code: {response.status_code}")
        except requests.exceptions.RequestException as e:
            span.set_tag("error", True)
            span.set_tag("error.message", str(e))
            print(f"Failed to send request: {e}")

if __name__ == "__main__":
    while True:
        print("Sending telemetry data...")
        make_request()
        time.sleep(5)
In the code snippet above, the “service” Decorator corresponds to the application name in Coralogix and the “name” Decorator corresponds to the subsystem name in Coralogix.
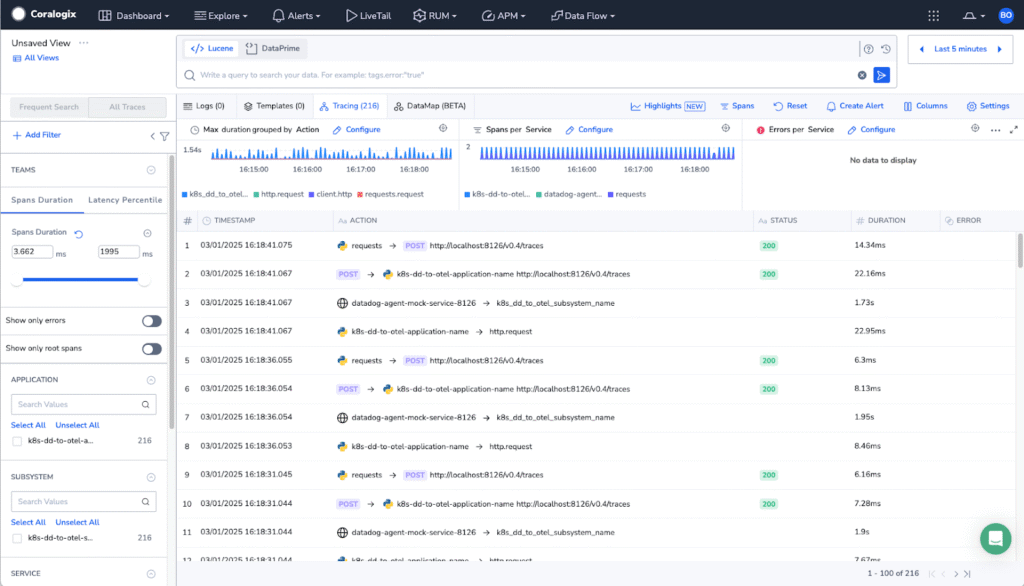
Testing Traces Flow
Testing the end-to-end setup ensures your configuration is correctly collecting, processing, and exporting telemetry data. In this section, you will:
- Execute the Python application above.
- Verify that the trace is being processed by the OTel Collector, the Python application will write to the console, Trace ID, Span ID and Parent ID. These values can be found in the log of the Tilt UI.
Troubleshooting Guide
Here are some common issues you might encounter and how to resolve them, run these within your terminal:
No Data in Coralogix
The below commands will help you locate potential errors at each stage of the data pipeline.
# Check OpenTelemetry Collector logs
kubectl logs -n dd-to-otel-to-coralogix -l app=otel-collector
# Check Datadog Agent logs
kubectl logs -n dd-to-otel-to-coralogix -l app=datadog-agent | grep error
# Verify OpenTelemetry Collector configuration
kubectl describe configmap -n dd-to-otel-to-coralogix otel-config
Connection Issues
The following commands will check the network connectivity, remotely, from the Datadog Agent pod, to the OTel collector service. The second command will ensure the OTel Collector service endpoint is in good shape.
# Test connectivity between Datadog Agent and OpenTelemetry Collector
kubectl exec -it -n dd-to-otel-to-coralogix <datadog-pod-name> -- /bin/sh
# At the prompt
$ curl http://otel-collector:8226
# This will return blank if it is working correctly

# Verify service endpoints
kubectl get endpoints -n dd-to-otel-to-coralogix
Recovery Procedures
Sometimes config caching or a typo in the config can cause our pods to fail. The below commands will help with forcing your agent to reconfigure and apply a new config.
# Restart Deployments
kubectl rollout restart deployment -n dd-to-otel-to-coralogix otel-collector
kubectl rollout restart deployment -n dd-to-otel-to-coralogix datadog-agent
Congratulations! you’ve successfully configured a Datadog Agent and OpenTelemetry Collector to send DataDog Agent Core metrics and APM traces to Coralogix. This setup provides a cost-efficient, future-proof observability pipeline while retaining flexibility for scaling and further customization.