
OpenTelemetry Collector: The Basics and a Quick Tutorial

Why Use the OpenTelemetry Collector?
Provides a Vendor-Agnostic Way to Collect Telemetry Data
Different vendors have unique data formats and APIs, making it challenging to switch between them. However, OpenTelemetry Collector provides a vendor-agnostic way to collect telemetry data, allowing you to avoid vendor lock-in and maintain flexibility.
The Collector supports a wide range of receiver interfaces, enabling it to collect data from various sources—for example, tracing data from Jaeger or Prometheus metrics. And since it’s vendor-agnostic, you can easily switch between different telemetry data providers without changing your instrumentation code.
Offloads Responsibility for Telemetry from the Application
One of the great benefits of using OpenTelemetry Collector is that it offloads the responsibility of managing telemetry data from the application. Instead of the application handling the collection, processing, and exporting of telemetry data, these tasks are delegated to the Collector.
This offloading reduces the resource usage of the application, as the telemetry data management tasks are handled by the Collector. It also simplifies the application code, as you no longer need to include code for telemetry data handling in your application.
Exports Telemetry Data in Multiple Formats
Another advantage of OpenTelemetry Collector is its ability to export telemetry data in multiple formats. This feature is particularly useful when using multiple observability backends requiring different data formats.
With the Collector, you can export the same telemetry data in different formats to various destinations. For instance, you can export tracing data in Jaeger format to a Jaeger backend, and, at the same time, export the same data in Zipkin format to a Zipkin backend.
Collects Host Metrics
OpenTelemetry Collector can help collect host metrics, which provide vital information about the state of the host where your application is running. These include data like CPU usage, memory usage, disk usage, and network statistics.
By collecting these host metrics, OpenTelemetry Collector provides a more comprehensive view of your system and its performance. This holistic view is crucial for diagnosing issues and optimizing system performance.
OpenTelemetry Collector Architecture
The Collector’s architecture can be broken down into several components.
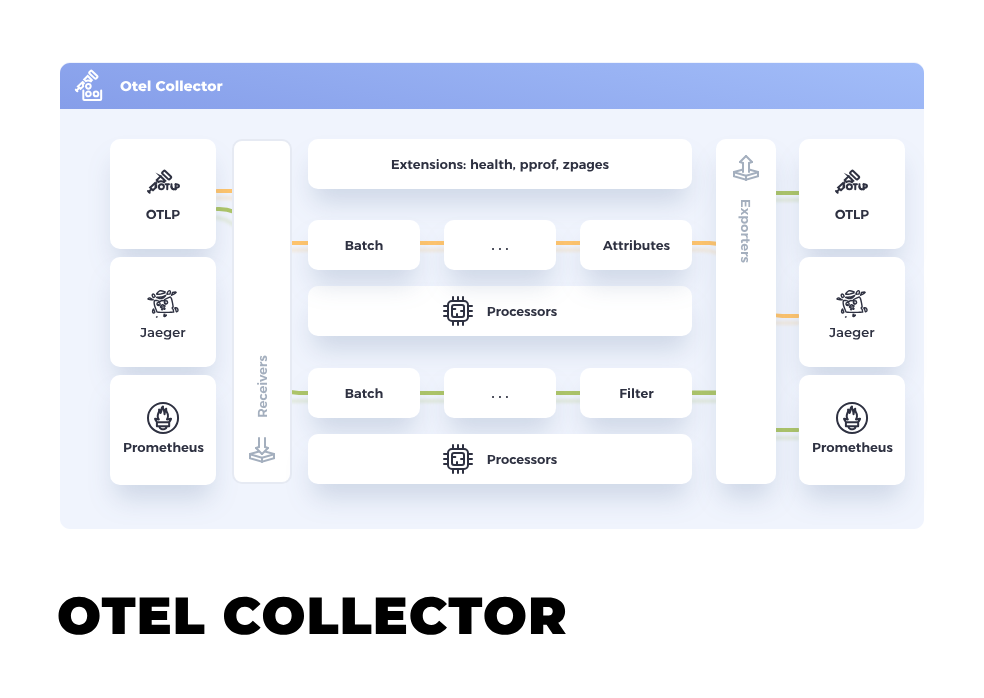
Source: OpenTelemetry
Receivers
Receivers are the entry point for telemetry data into the OpenTelemetry Collector. They are responsible for receiving and decoding incoming data from various sources and converting it into a format that the Collector can process. Receivers are typically protocol-specific, with separate receivers for different telemetry data formats such as Jaeger, Zipkin, Prometheus, and OpenCensus.
Each receiver is configured with its own set of parameters, including the endpoint to receive data, the protocol to use, and any necessary credentials. This flexibility allows the Collector to receive data from a wide range of sources and in various formats. Receivers can also be configured to only accept certain types of data, such as metrics, traces, or logs, making it possible to fine-tune the data ingestion process.
Processors
Once telemetry data has been received by the Collector, it is passed to processors for further handling. Processors act as a middleware in the telemetry data pipeline, transforming and enriching the data before it is exported. They can modify the data in various ways, such as adding or removing attributes, filtering out certain data, or aggregating metrics.
Processors are also configurable, allowing you to specify which transformations to apply to the data. The OpenTelemetry Collector provides several built-in processors, including a batch processor for aggregating data, an attribute processor for modifying attributes, and a memory limiter processor for controlling the Collector’s memory usage. Custom processors can also be developed and added to the Collector, providing even greater flexibility in processing telemetry data.
Exporters
Exporters are the final stage in the telemetry data pipeline. They are responsible for taking the processed data and sending it to a destination for storage or analysis. Like receivers, exporters are typically protocol-specific, with separate exporters for different telemetry data storage systems such as Jaeger, Zipkin, Prometheus, and OpenCensus.
Each exporter is configured with its own set of parameters, including the endpoint to send data to, the protocol to use, and any necessary credentials. This flexibility allows the Collector to send data to a wide range of destinations and in various formats. Exporters can also be configured to send only certain types of data, such as metrics, traces, or logs, making it possible to fine-tune the data export process.
Extensions
Extensions are optional components that provide additional functionality to the OpenTelemetry Collector. They can be used to expose metrics about the Collector’s operation, perform health checks, and manage the lifecycle of the Collector. Extensions are not part of the telemetry data pipeline, but they can interact with other components of the Collector.
Like receivers, processors, and exporters, extensions are configurable, allowing you to enable or disable specific functionality as needed. Extensions can be developed and added to the Collector, providing even more flexibility in managing and monitoring the Collector’s operation.
Service
The service is the core component of the OpenTelemetry Collector that ties everything together. It is responsible for starting and stopping the Collector, managing its configuration, and coordinating the operation of receivers, processors, exporters, and extensions.
The service is designed to be robust and scalable, able to handle large volumes of telemetry data and recover from failures. It also provides a unified configuration interface for the entire Collector, making it easy to customize and extend the Collector’s functionality.
Quick Tutorial: Installing OpenTelemetry Collector and Collecting Telemetry from a Sample Client
This guide takes you through the process of setting up and running the OpenTelemetry Collector, as well as sending telemetry for processing. The code was shared in the official OpenTelemetry documentation.
Prerequisites
You will need to do the following in your developer environment before proceeding:
- Install Go 1.20 or higher
- Set the GOBIN environment variable. If it’s not, initialize it appropriately, for example:
export GOBIN=${GOBIN:-$(go env GOPATH)/bin}
Environment Setup
To set up the OpenTelemetry Collector’s environment:
- Pull the OpenTelemetry Collector Docker image:
docker pull otel/opentelemetry-collector:0.93.0
- Next, install the telemetrygen utility. This utility simulates a client generating traces, metrics, and logs.
go install github.com/open-telemetry/opentelemetry-collector-contrib/cmd/telemetrygen@latest
Generating and Collecting Telemetry
To generate and collect data:
- Start the Collector using the following script:
docker run -p 127.0.0.1:4317:4317 -p 127.0.0.1:55679:55679 otel/opentelemetry-collector:0.93.0 2>&1 | tee collector-output.txt
- Open a new terminal window and produce a few sample traces:
$GOBIN/telemetrygen traces --otlp-insecure --traces 3
You should see a confirmation message in the output from telemetrygen verifying the generation of traces:
2024-01-16T14:33:15.692-0500 INFO traces/worker.go:99 traces generated {"worker": 0, "traces": 3}2024-01-16T14:33:15.692-0500 INFO traces/traces.go:58 stop the batch span processor
- When your Collector container is running in the terminal window, the collector-output.txt file will display notices showing that it is ingesting traces. Here is an example showing how to view the output:
$ grep -E '^Span|(ID|Name|Kind|time|Status w+)s+:' ./collector-output.txt
Span #0
    Trace ID       : f30faffbde5fcf71432f89da1bf7bc14
    Parent ID      : 6f1ff7f9cf4ec1c7
    ID             : 8d1e820c1ac57337
    Name           : okey-dokey
    Kind           : Server
    Start time     : 2024-01-16 14:13:54.585877 +0000 UTC
    End time       : 2024-01-16 14:13:54.586 +0000 UTC
    Status code    : Unset
    Status message :
Span #1
    Trace ID       : f30faffbde5fcf71432f89da1bf7bc14
    Parent ID      :
    ID             : 6f1ff7f9cf4ec1c7
    Name           : lets-go
    Kind           : Client
    Start time     : 2024-01-16 14:13:54.585877 +0000 UTC
    End time       : 2024-01-16 14:13:54.586 +0000 UTC
    Status code    : Unset
    Status message :
...
- To examine the traces you’ve created, visit http://localhost:55679/debug/tracez and choose any sample from the table.
- Once you have finished, you’ll need to stop the Collector container from running. The simple way to do this is by hitting Control-C.
That’s it! You have deployed an OpenTelemetry collector and used it to collect telemetry from a sample application.
Get Full Observability with OpenTelemetry and Coralogix
Data plus context are key to supercharging observability using OpenTelemetry. As Coralogix is open-source friendly, we support OpenTelemetry to get your app’s telemetry data (traces, logs, and metrics) as requests travel through its many services and other infrastructure. You can easily use OpenTelemetry’s APIs, SDKs, and tools to collect and export observability data from your environment directly to Coralogix.
