OpenTelemetry Golang: The Basics and a Quick Tutorial

Benefits of OpenTelemetry for Golang Apps
Integrating OpenTelemetry with Golang applications offers several advantages:
- Unified instrumentation: OpenTelemetry provides a consistent and standardized way to collect telemetry data across various languages and frameworks. For Golang developers, this means being able to instrument applications once and have a consistent set of telemetry data (metrics, traces, and logs).
- Performance optimization: By leveraging OpenTelemetry’s ability to trace operations and collect metrics in Go applications, developers can pinpoint performance bottlenecks, understand latency issues, and optimize code for better performance and resource utilization.
- Enhanced debugging and monitoring: The comprehensive telemetry data collected helps in identifying, diagnosing, and resolving issues faster. This is particularly valuable in distributed systems where pinpointing the source of a problem can be challenging.
- Customization and flexibility: OpenTelemetry’s extensible design allows Go developers to customize data collection to fit their application’s needs. Developers can add custom metrics, traces, and logs that are specific to their application’s behavior.
- Community and ecosystem support: Developers benefit from a large ecosystem of libraries, tools, and community support. This ensures continuous improvement, easy access to resources, and compatibility with different observability tools.
Quick Tutorial: Adding Auto-Instrumentation with OpenTelemetry for a Go Application
The example and code below is adapted from the OpenTelemetry documentation.
Step 1: Setup
To get started with implementing OpenTelemetry in Go applications, you first need to set up your project environment. This involves creating a new directory for your project and initializing a Go module within it.
The Go module can be initiated with the command go mod init, followed by your module name. For instance, if your project is named “wheeloffortune,” the command would be:
go mod init wheeloffortune
This command creates a go.mod file in your directory, setting up the basis for managing dependencies and versions in your Go application.
Step 2: Creating and Launching an HTTP Server
The next step is to create and launch an HTTP server. This involves writing Go code in a file named main.go. The code defines a simple HTTP server that listens on port 8080 and handles requests to the /spinwheel path. Here’s how the main.go file looks:
package main

import (
	"log"
	"net/http"
)

func main() {
	http.HandleFunc("/spinwheel", spinwheel)

	log.Fatal(http.ListenAndServe(":8080", nil))
}
Additionally, you need to define the behavior of your /spinwheel handler in a separate file, spinwheel.go. This handler generates a random number between 1 and 12 to simulate the spinning of a wheel of fortune and sends the result back to the client:
package main

import (
	"io"
	"log"
	"math/rand"
	"net/http"
	"strconv"
)

func spinwheel(w http.ResponseWriter, r *http.Request) {
	roll := 1 + rand.Intn(12)

	resp := strconv.Itoa(roll) + "n"
	if _, err := io.WriteString(w, resp); err != nil {
		log.Printf("Write failed: %vn", err)
	}
}
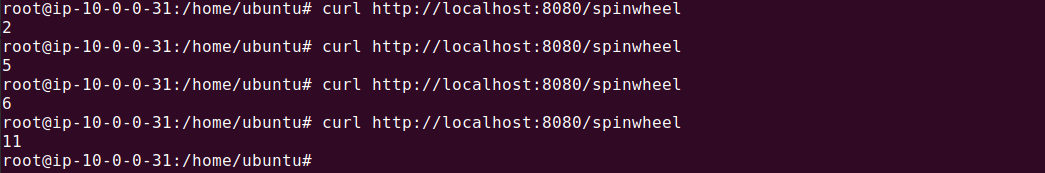
To run the server, use the command go run . (including the period) and navigate to http://localhost:8080/spinwheel in your web browser to see it in action. The output should look like this:
Step 3: Adding Dependencies
To integrate OpenTelemetry into your Go application, you need to add several dependencies. These include the OpenTelemetry SDK, standard exporters for metrics and traces, and instrumentation for the net/http package. Run the following command to install these packages:
go get "go.opentelemetry.io/otel"
"go.opentelemetry.io/otel/exporters/stdout/stdoutmetric"

  "go.opentelemetry.io/otel/exporters/stdout/stdouttrace"

  "go.opentelemetry.io/otel/propagation"

  "go.opentelemetry.io/otel/sdk/metric"

  "go.opentelemetry.io/otel/sdk/resource"

  "go.opentelemetry.io/otel/sdk/trace"

  "go.opentelemetry.io/otel/semconv/v1.24.0"

  "go.opentelemetry.io/contrib/instrumentation/net/http/otelhttp"
The output should look something like:
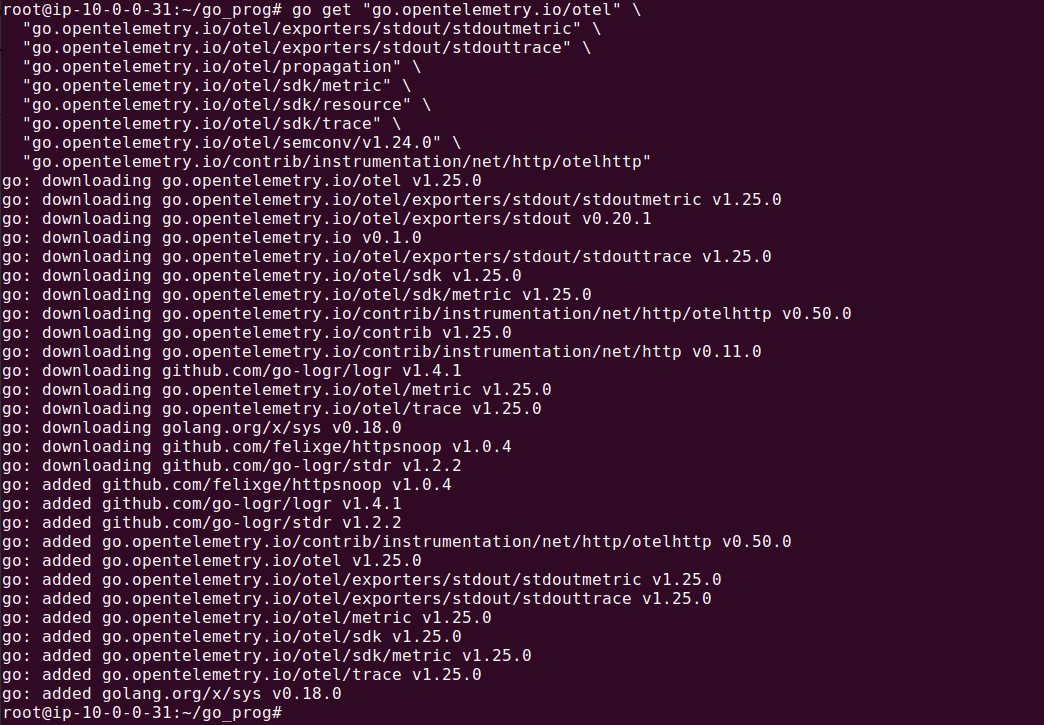
This command ensures your project has all the necessary libraries to instrument your application with OpenTelemetry.
Step 4: Initializing the OpenTelemetry SDK
Initialization of the OpenTelemetry SDK is a crucial step to start exporting telemetry data (traces and metrics) from your application. You need to create a new file, otel.go, to bootstrap the OpenTelemetry pipeline.
This setup involves configuring trace and meter providers, as well as setting up a propagator. The otel.go file will look something like this:
package main

import (
    // Import necessary packages
   "context"
        "errors"
        "time"

        "go.opentelemetry.io/otel"
        "go.opentelemetry.io/otel/exporters/stdout/stdoutmetric"
        "go.opentelemetry.io/otel/exporters/stdout/stdouttrace"
        "go.opentelemetry.io/otel/propagation"
        "go.opentelemetry.io/otel/sdk/metric"
        "go.opentelemetry.io/otel/sdk/trace"
)

func bootstrap_sdk(ctx context.Context) (shutdown  func(context.Context) error, err error) {
        var shutdownFuncs []func(context.Context) error

        // shutdown calls cleanup functions registered via shutdownFuncs
        // The errors from the calls are joined
        // Each registered cleanup will be invoked once
        shutdown = func(ctx context.Context) error {
                var err error
                for _, fn := range shutdownFuncs {
                        err = errors.Join(err, fn(ctx))
                }
                shutdownFuncs = nil
                return err
        }

        // handleErr calls shutdown for cleanup and makes sure that all errors are returned
        handleErr := func(inErr error) {
                err = errors.Join(inErr, shutdown(ctx))
        }

        // Set up propagator.
        prop := newPropagator()
        otel.SetTextMapPropagator(prop)

        // Set up trace provider.
        tracerProvider, err := newTraceProvider()
        if err != nil {
                handleErr(err)
                return
        }
        shutdownFuncs = append(shutdownFuncs, tracerProvider.Shutdown)
        otel.SetTracerProvider(tracerProvider)

        // Set up meter provider.
        meterProvider, err := newMeterProvider()
        if err != nil {
                handleErr(err)
                return
        }
        shutdownFuncs = append(shutdownFuncs, meterProvider.Shutdown)
        otel.SetMeterProvider(meterProvider)

        return
}


func newPropagator() propagation.TextMapPropagator {
        return propagation.NewCompositeTextMapPropagator(
                propagation.TraceContext{},
                propagation.Baggage{},
        )
}

func newTraceProvider() (*trace.TracerProvider, error) {
        traceExporter, err := stdouttrace.New(
                stdouttrace.WithPrettyPrint())
        if err != nil {
                return nil, err
        }

        traceProvider := trace.NewTracerProvider(
                trace.WithBatcher(traceExporter,
                        // Default is 5s. Set to 1s for demonstrative purposes.
                        trace.WithBatchTimeout(time.Second)),
        )
        return traceProvider, nil
}

func newMeterProvider() (*metric.MeterProvider, error) {
        metricExporter, err := stdoutmetric.New()
        if err != nil {
                return nil, err
        }

        meterProvider := metric.NewMeterProvider(
                metric.WithReader(metric.NewPeriodicReader(metricExporter,
                        // Default is 1m. Set to 3s for demonstrative purposes.
                        metric.WithInterval(3*time.Second))),
        )
        return meterProvider, nil
}
The initialization process sets up the necessary components for tracing and metrics, including exporters that output data to the console in this example.
Step 5: Auto-Instrumenting the HTTP server
To capture telemetry data from your HTTP server, modify the main.go file to incorporate OpenTelemetry instrumentation. This involves wrapping your HTTP handlers with the otelhttp middleware, which automatically captures HTTP request metrics and traces.
The modification includes setting up the OpenTelemetry SDK in your main function and using the otelhttp.NewHandler to instrument your server (some details omitted for brevity and replaced with an ellipsis):
package main

import (
	…
        "context"
        "errors"
        "log"
        "net"
        "net/http"
        "os"
        "os/signal"
        "time"

          "go.opentelemetry.io/contrib/instrumentation/net/http/otelhttp"


)

func main() {
	if err := run(); err != nil {
		log.Fatalln(err)
	}
}

func run() (err error) {
     // Handle shutdown scenarios
	ctx, stop := signal.NotifyContext(context.Background(), os.Interrupt)
	defer stop()

	otelShutdown, err := bootstrap_sdk(ctx)
	if err != nil {
		return
	}
	defer func() {
		err = errors.Join(err, otelShutdown(context.Background()))
	}()

	// Start HTTP server.
	srv := &http.Server{
		Addr:         ":8080",
		BaseContext:  func(_ net.Listener) context.Context { return ctx },
		ReadTimeout:  time.Second,
		WriteTimeout: 10 * time.Second,
		Handler:      newHTTPHandler(),
	}
	srvErr := make(chan error, 1)
	go func() {
		srvErr <- srv.ListenAndServe()
	}()

	// Handle interruptions
	select {
	case err = <-srvErr:
		return
	case <-ctx.Done():
		stop()
	}

	err = srv.Shutdown(context.Background())
	return
}

func newHTTPHandler() http.Handler {
	mux := http.NewServeMux()

	handleFunc := func(pattern string, handlerFunc func(http.ResponseWriter, *http.Request)) {
		handler := otelhttp.WithRouteTag(pattern, http.HandlerFunc(handlerFunc))
		mux.Handle(pattern, handler)
	}

	handleFunc("/spinwheel", spinwheel)

	// Add HTTP instrumentation for the whole server
	handler := otelhttp.NewHandler(mux, "/")
	return handler
}
Step 6: Running the Application
Finally, to run your instrumented application, make sure to tidy up your module dependencies with go mod tidy. Then, set the OTEL_RESOURCE_ATTRIBUTES environment variable to provide resource attributes like service name and version.
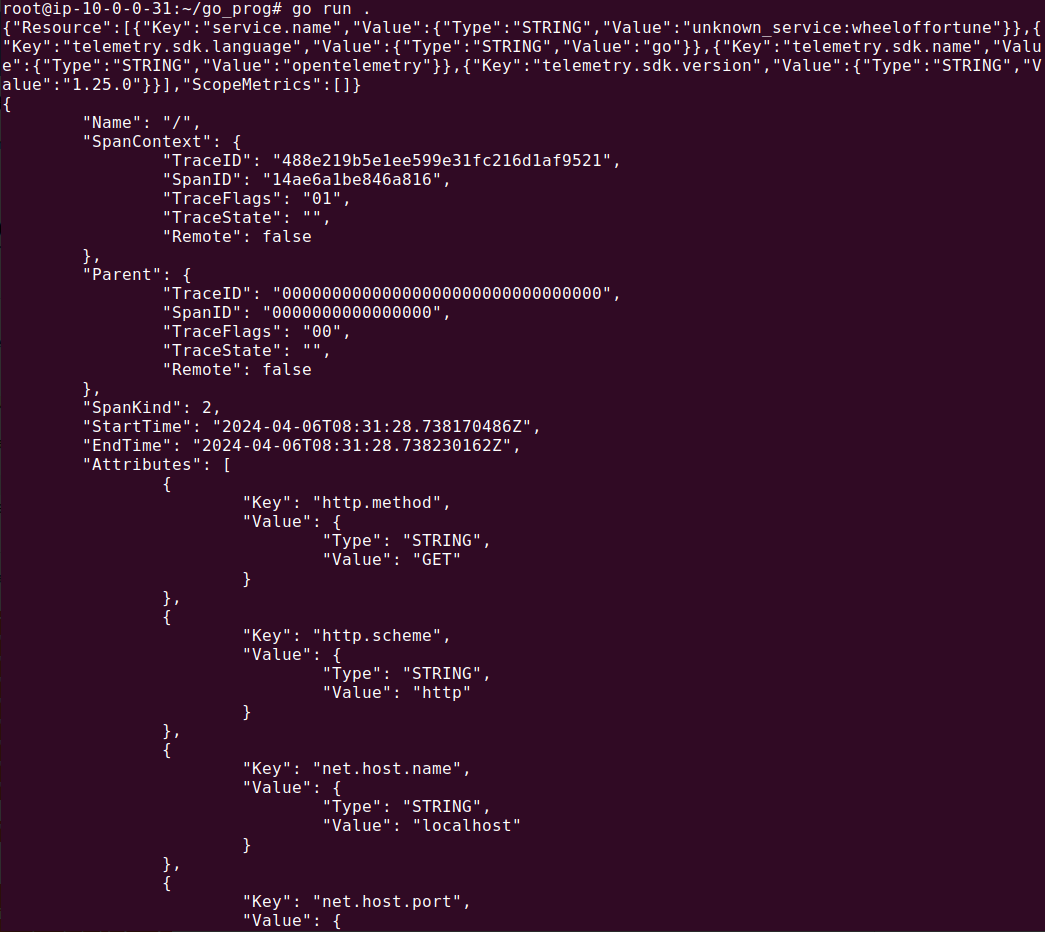
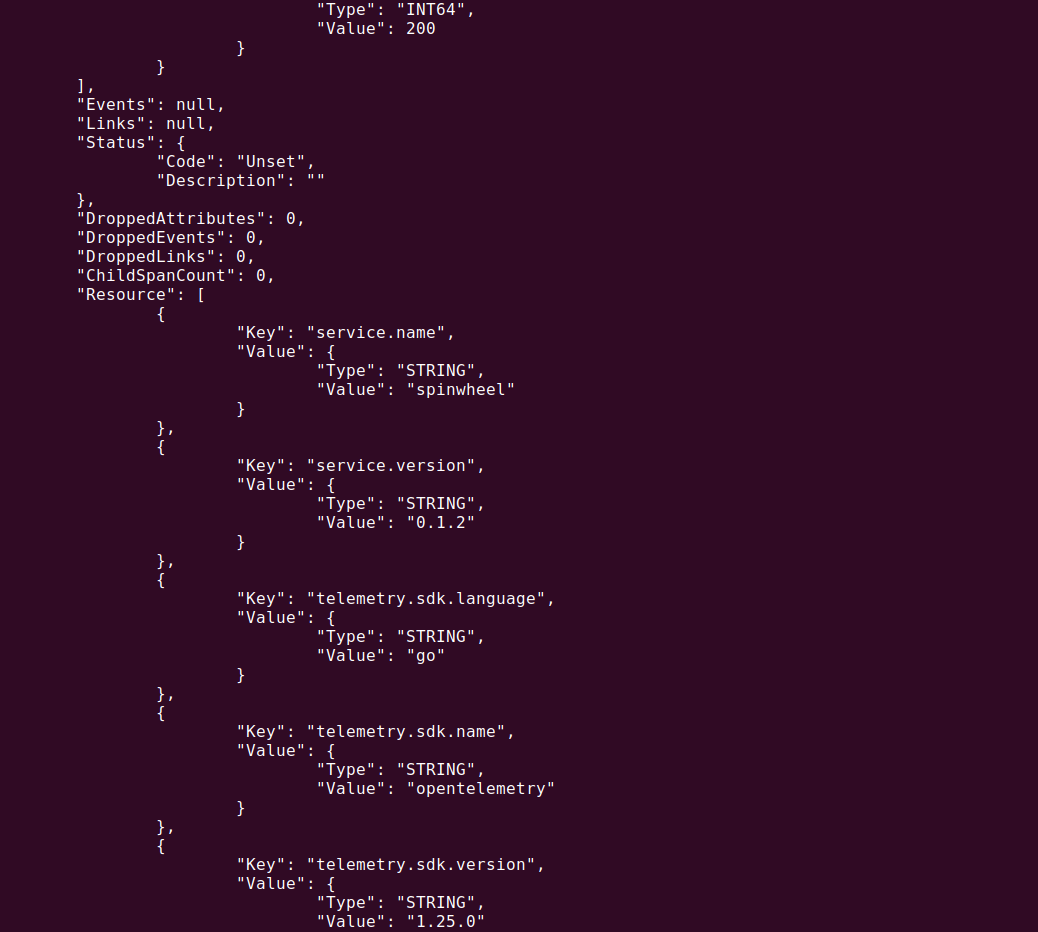
Run your application with go run and observe the telemetry data generated by both automatic and custom instrumentation in your console.
Here is an example of the output:
Get Full Observability with OpenTelemetry and Coralogix
Data plus context are key to supercharging observability using OpenTelemetry. As Coralogix is open-source friendly, we support OpenTelemetry to get your app’s telemetry data (traces, logs, and metrics) as requests travel through its many services and other infrastructure. You can easily use OpenTelemetry’s APIs, SDKs, and tools to collect and export observability data from your environment directly to Coralogix.