

Step by step cost optimization in Coralogix

Controlling observability spend should be simple, measurable and automated. Coralogix lets organizations see exactly where units are used, steer data into the right pipelines and alert long before limits are hit – all without compromising engineering insight.
1. Observe & Monitor
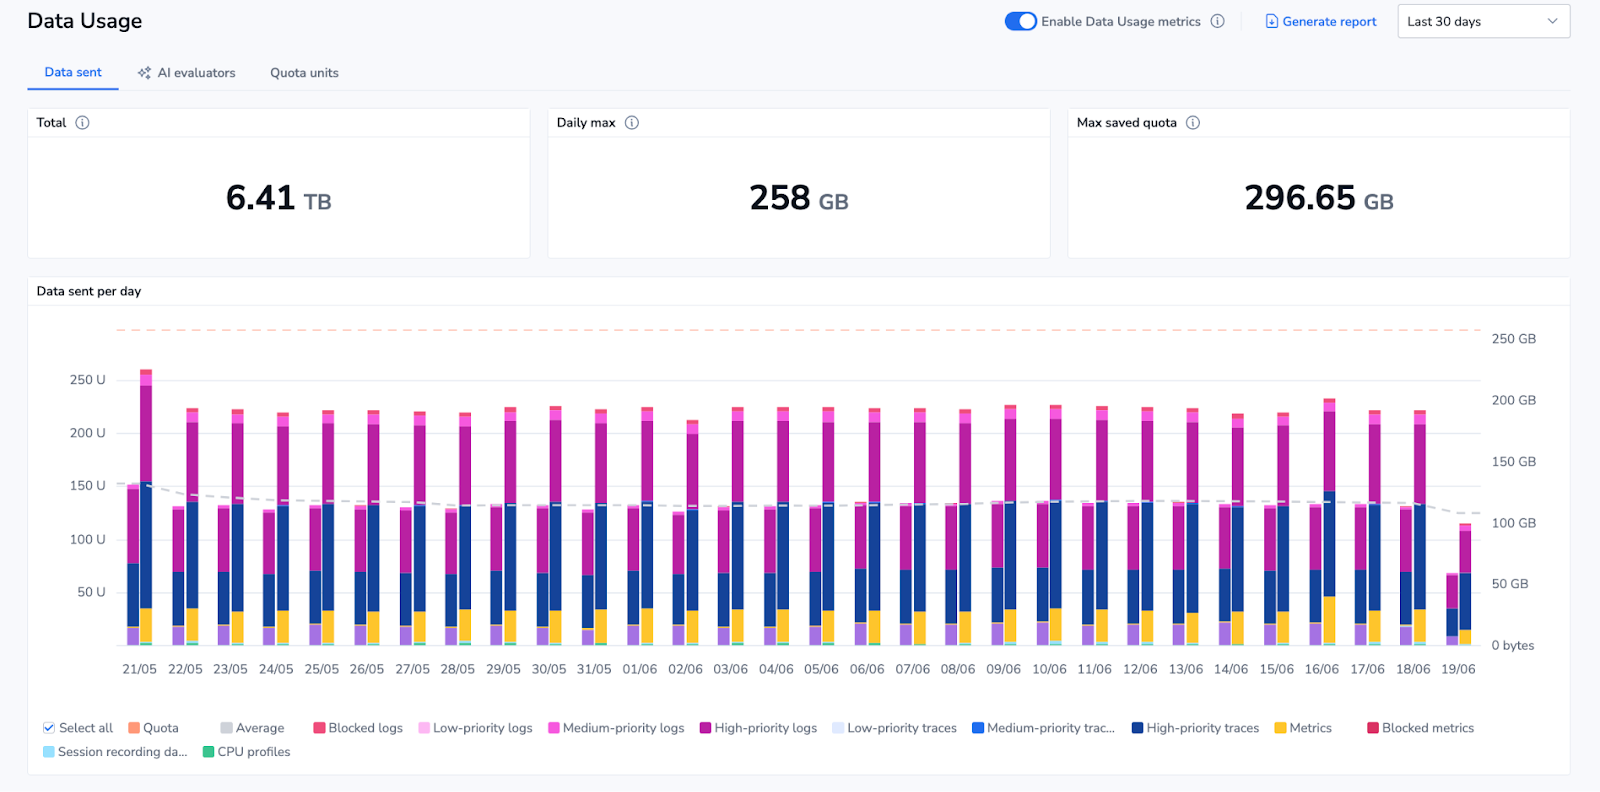
The first step in cost governance is line‑of‑sight:
| Business question | Coralogix answer | Where to find it |
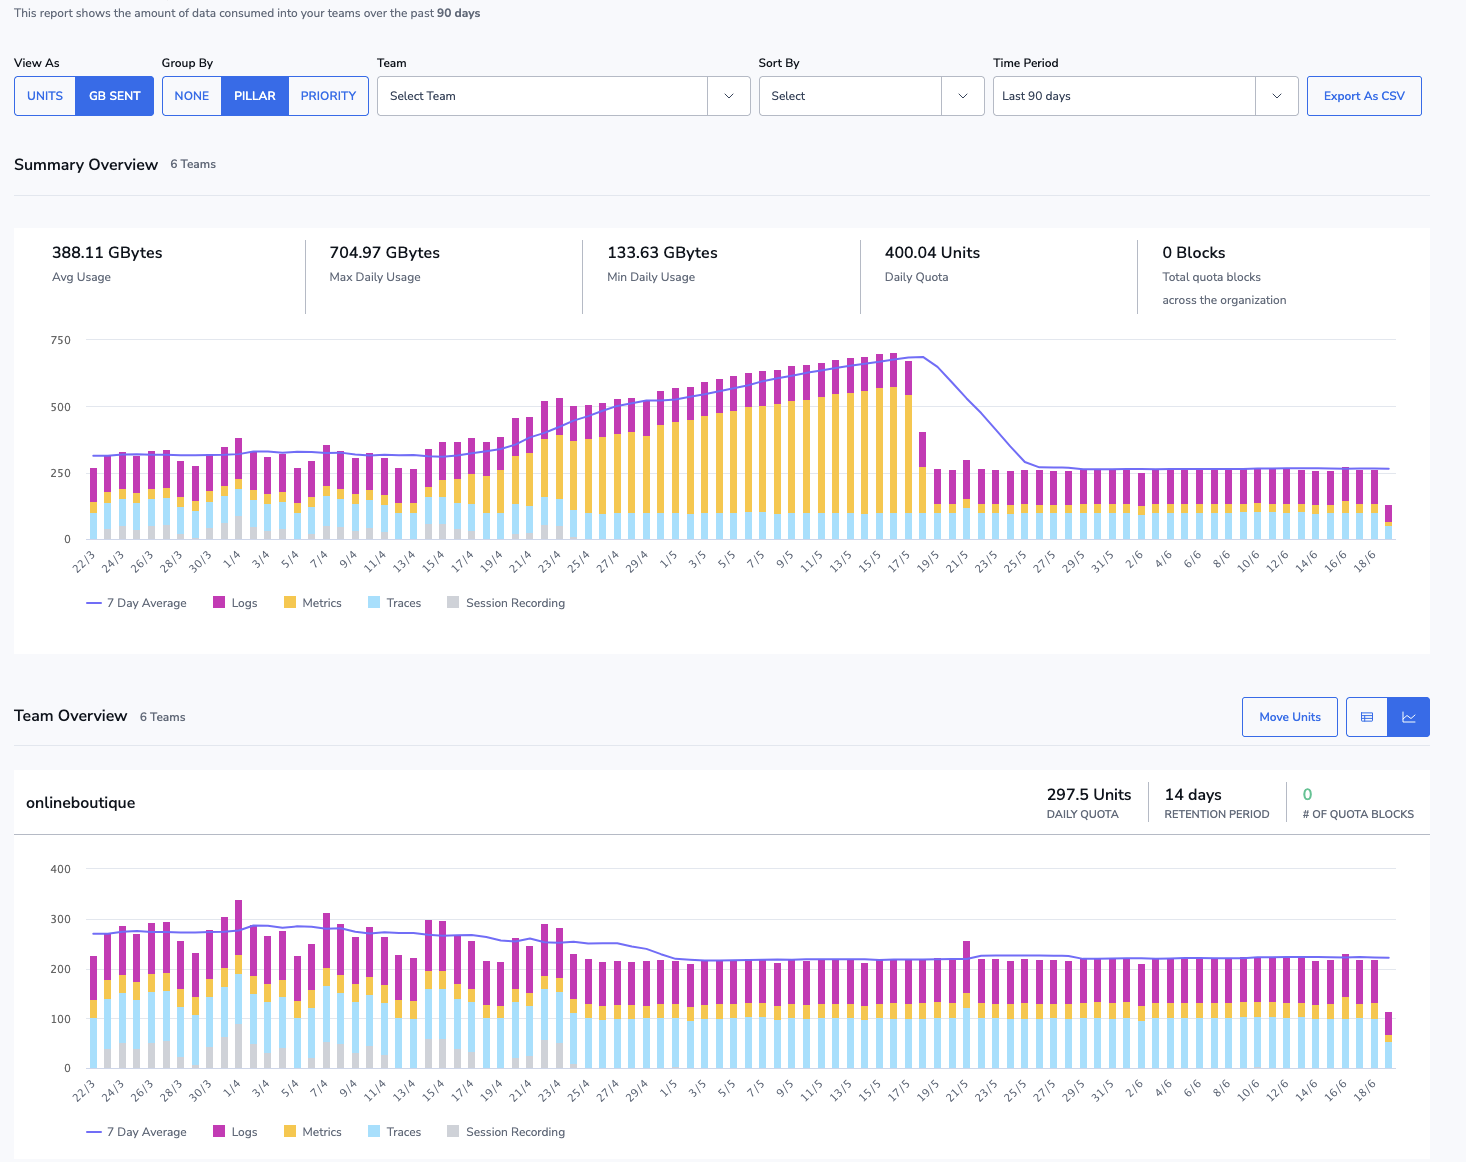
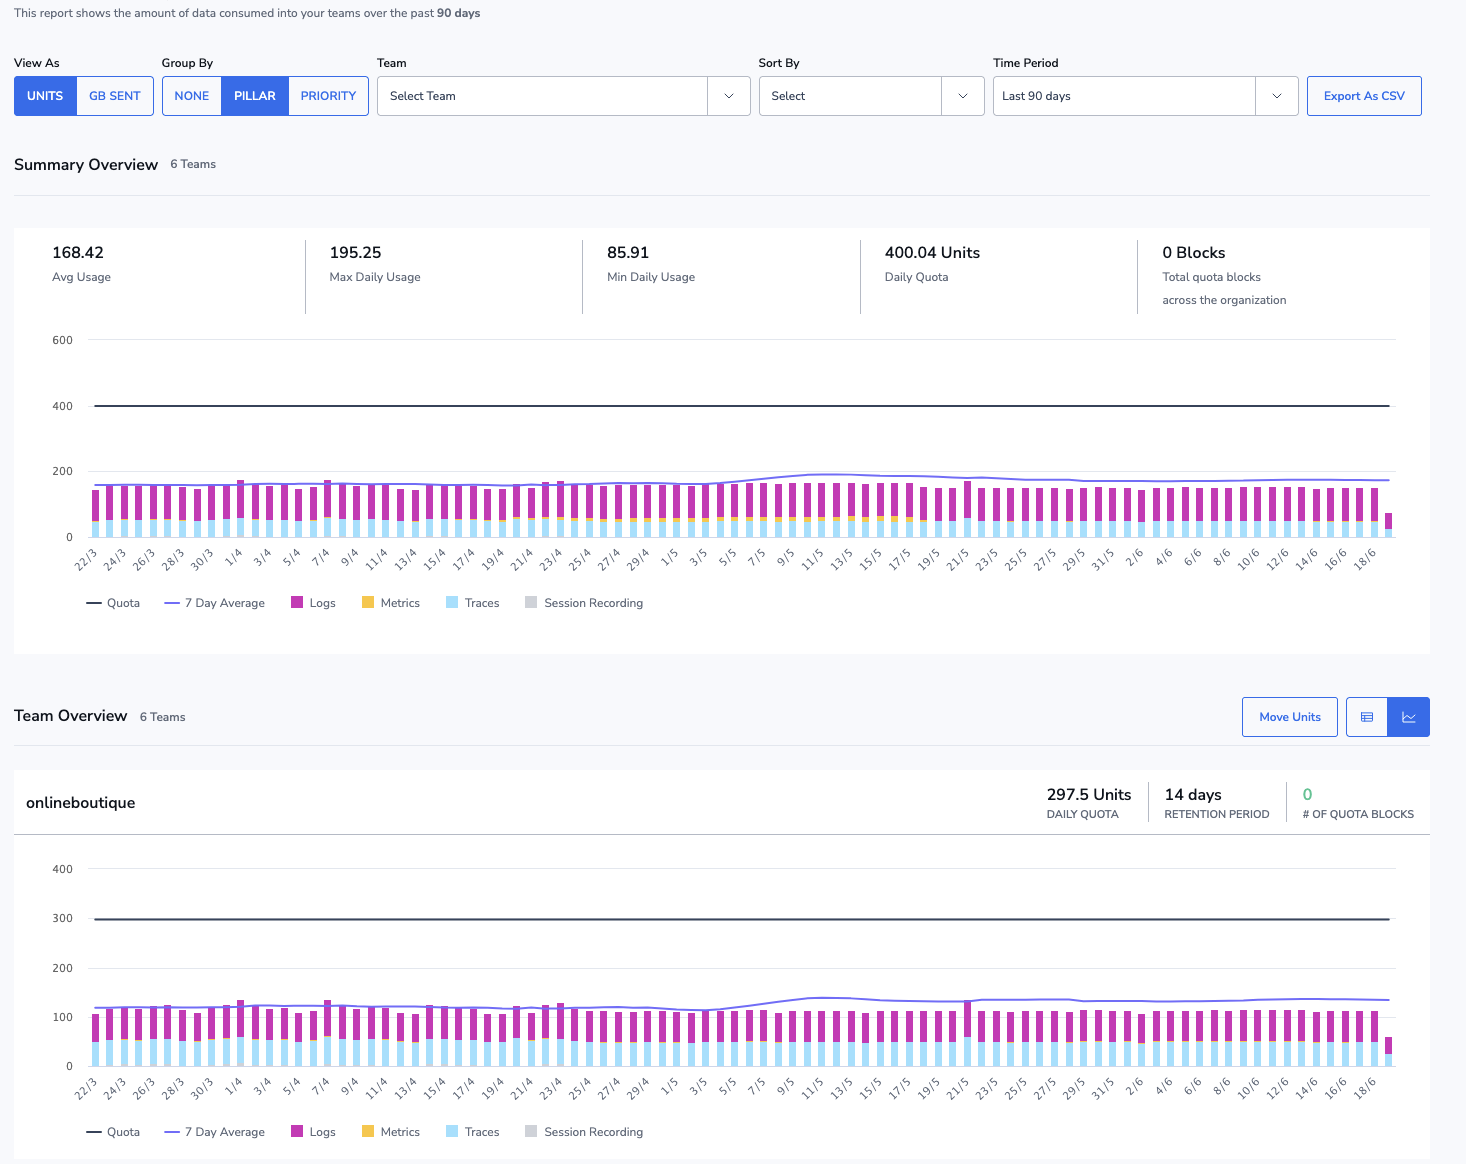
| Overall unit consumption over a given period | Totals and daily trend on Settings > Data Usage and the Data Usage Service API (resolution 6 h down to 1 h) | UI · CX Dashboards · API |
| Quota percentage (rounded) – e.g. 78 % of 100 % | Gauge widget on Data Usage page and cx_data_usage_units metric (units_used/units_quota*100) | UI · API |
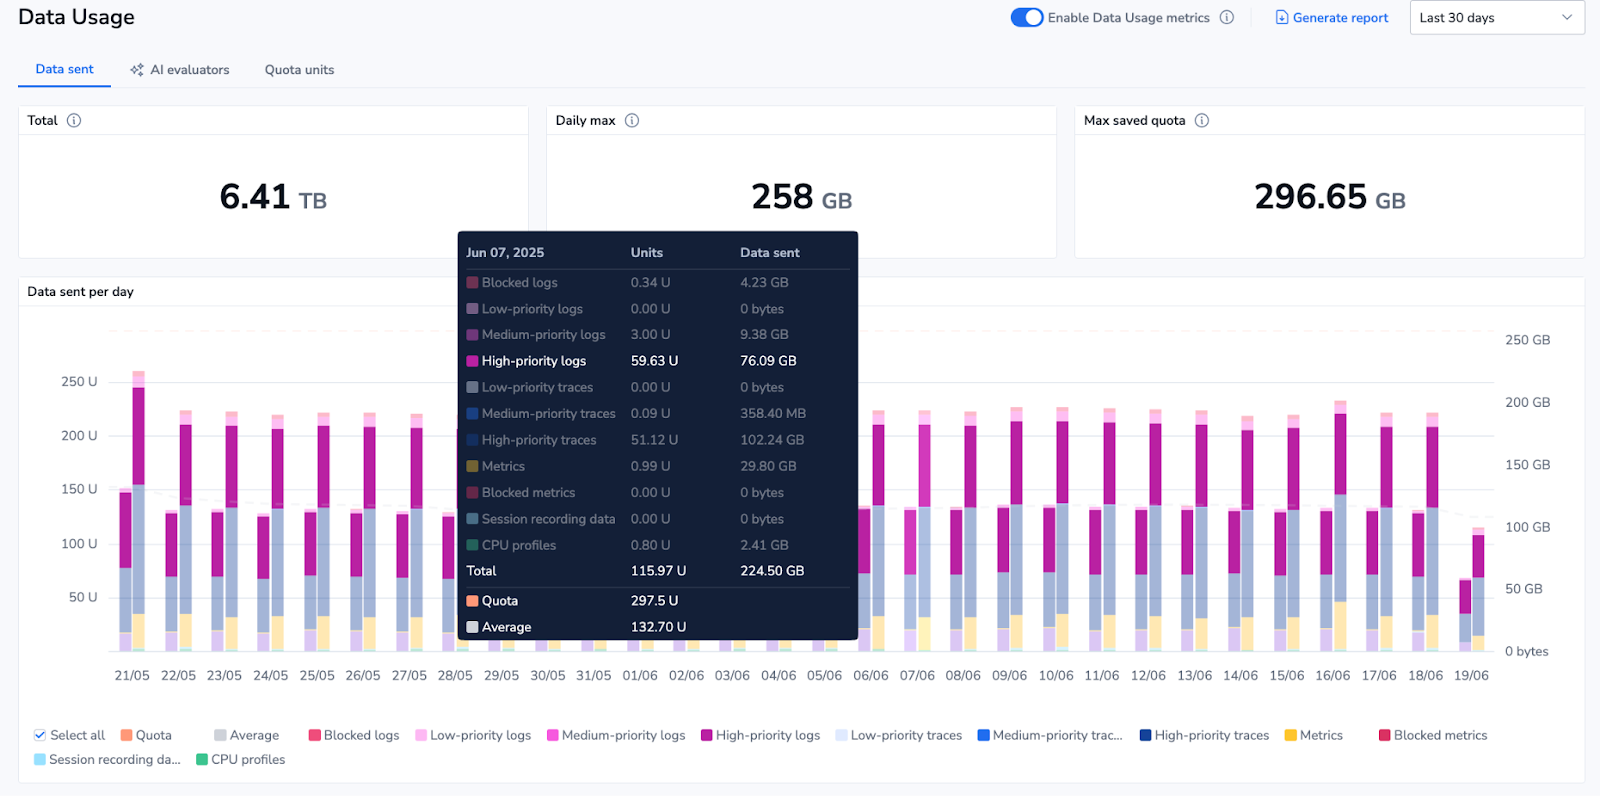
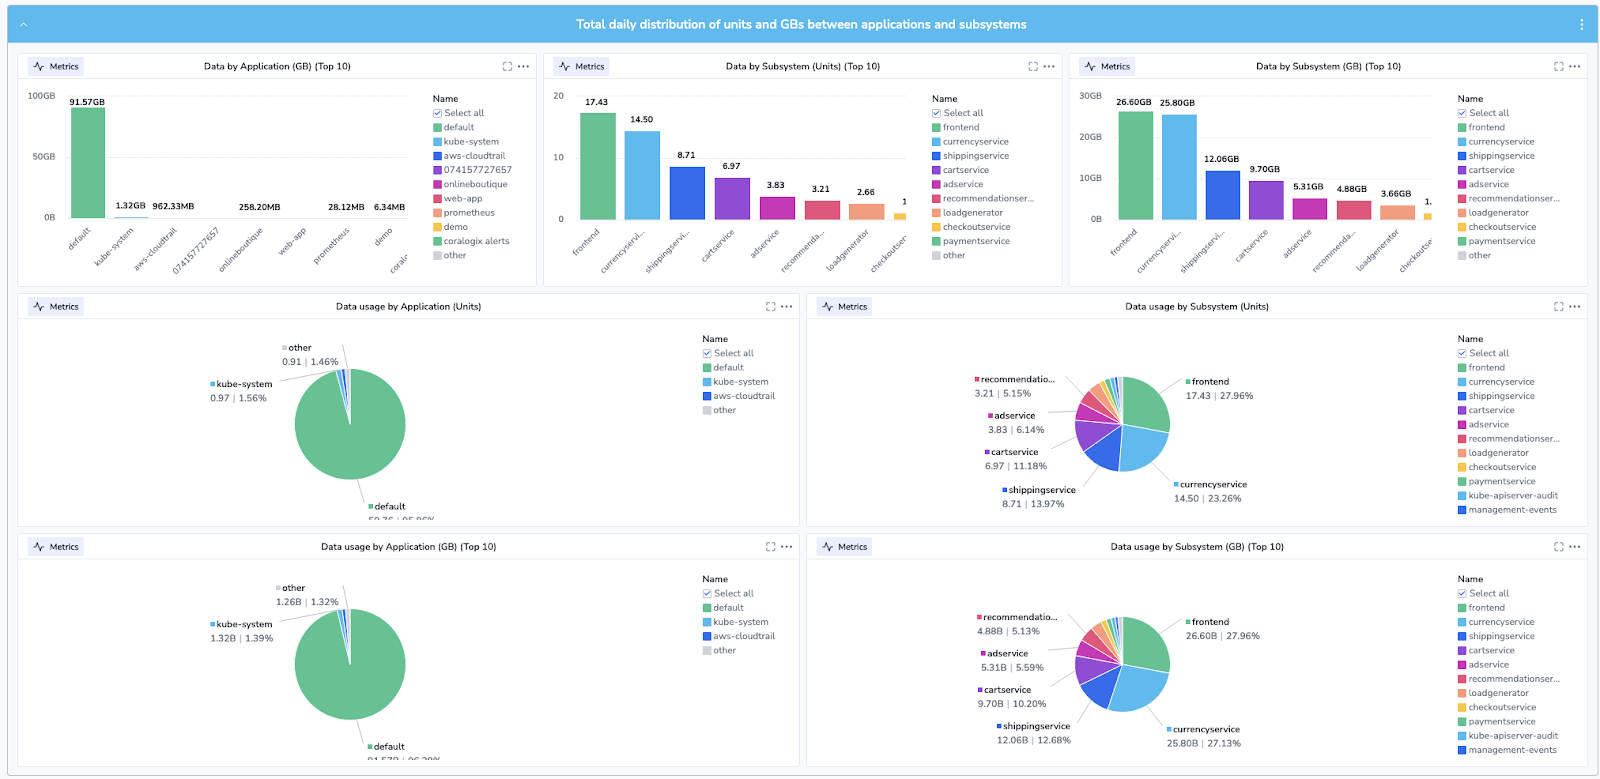
| Unit split by pillar (High, Medium, Low) and by telemetry type (Logs, Metrics, Traces) | TCO Distribution dashboards plus API fields pillar and priority | UI |
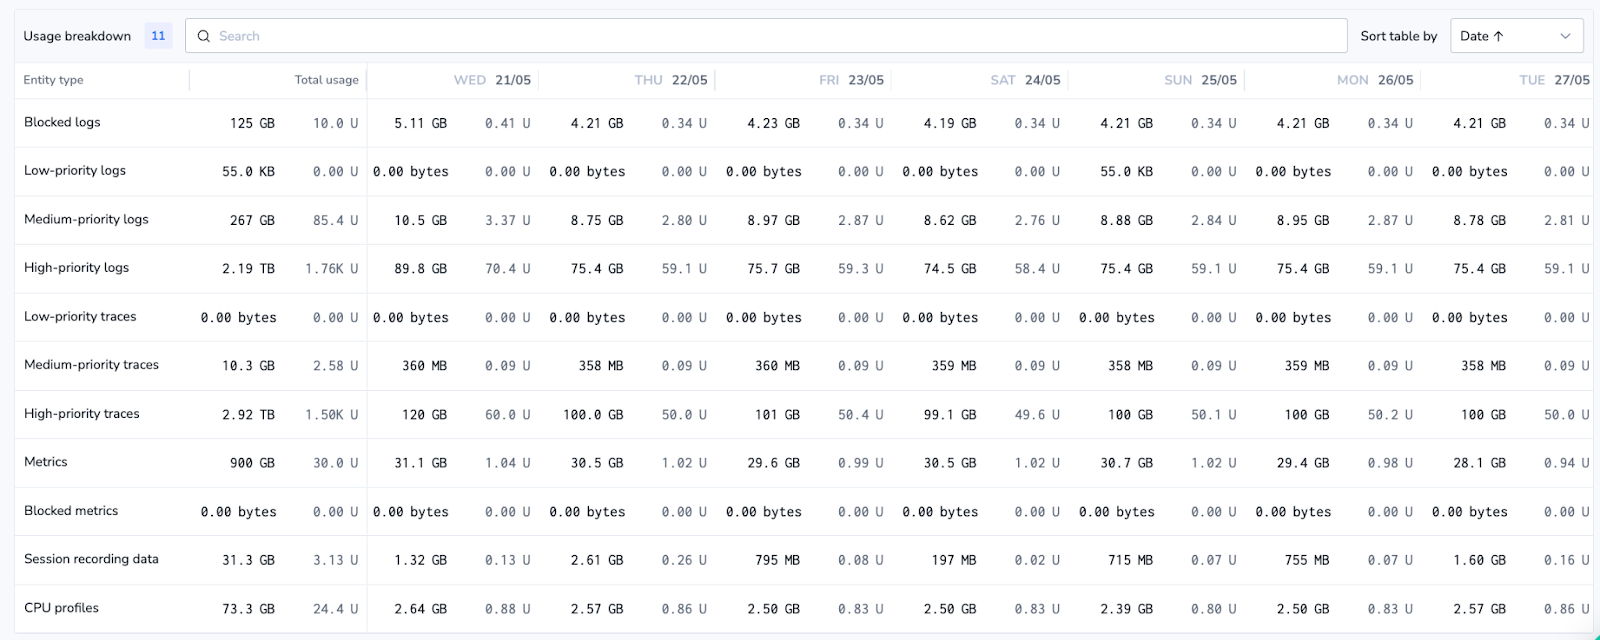
| Usage by application and subsystem | Drill‑down grid and API application_name / subsystem_name | UI |
| Usage in units and GB per team | Data Usage page – Teams tab or API dimensions.team_id | UI |
| Platform adoption across telemetry types and frequency | Metrics panel showing daily active teams per pillar per telemetry using cx_data_usage_units | UI |
** All data can be exported as scheduled reports to CSV or PDF for offline analysis.
2. Manage & Act
Once hot spots are visible, policies and rules keep spending predictable.
2.1 TCO Optimiser (Logs and Traces)
- Redirect data between High, Medium and Low pipelines in seconds with the Logs TCO Optimiser and the Traces TCO Optimiser.
- Precedence and per‑severity overrides ensure business‑ All critical events stay searchable.
2.2 Metrics Cost Optimiser
- Use the Metrics Cost Optimiser to block high-cardinality series post-ingest while preserving history.
2.3 Dynamic Blocking & Parsing Rules
- A Lambda-based Dynamic TCO App enforces temporary low-priority routing when quota approaches X percent and reverts at midnight UTC.
- Dynamic Blocking rules can also be run on a timer.
- Block rules and Remove-Field rules cut payload size by up to 90 percent.
2.4 Archive & Retention Controls
- Per‑retention tag S3 lifecycle policies move older objects from Standard S3 → GIR → Glacier/Deep Archive, minimising S3 storage cost.
3. Automate & Alert
Policies and rules can be implemented as automated alerts and remediations.
| Goal | Feature | Example |
| Be warned proactively before quota full consumption | Alert on cx_data_usage_units >= 80 % | Slack, e‑mail, webhook |
| Block noisy subsystems automatically | Dynamic Blocking script runs every 30 min (threshold > 100 k logs / day) | Threshold: >100 k logs/day |
| Treat quota like code | Terraform provider for TCO policies and alerts | resource “coralogix_tco_policy” … |
4. Report & Analyse
Create feedback loops, so the entire organization is enabled to act on the information they have.
4.1 Cost attribution
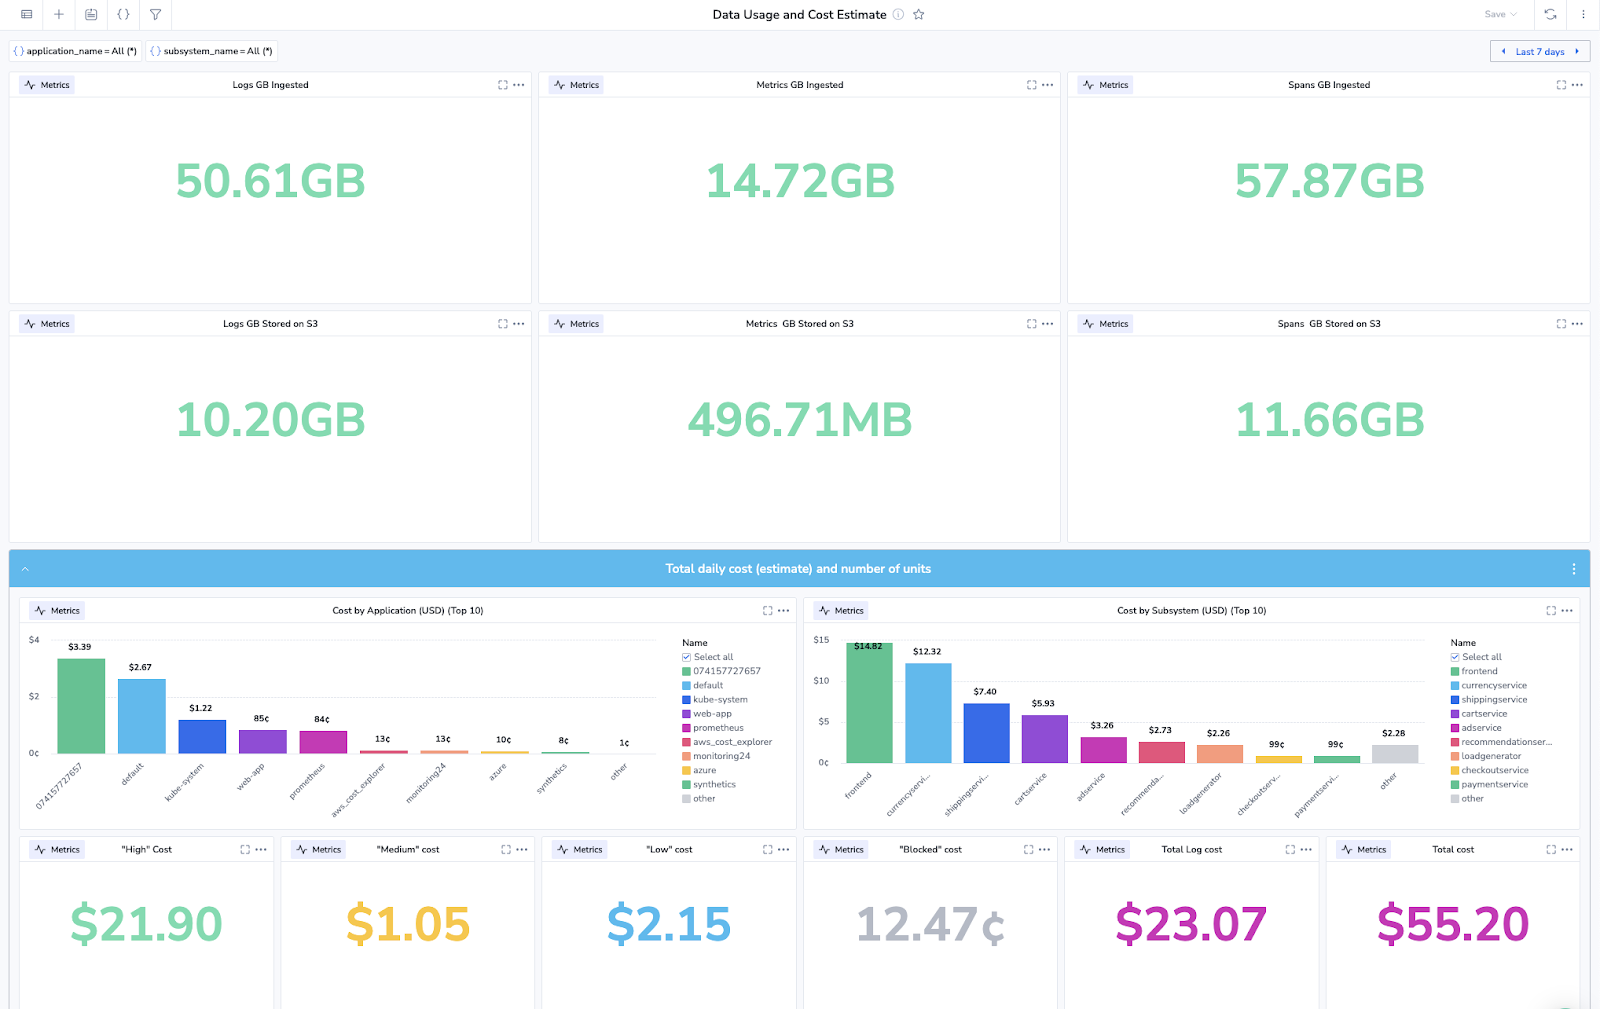
- $$ per team or BU – multiply units by contractual unit price in CX Dashboards or in Looker/BI table.
- CSV Detailed Usage Report shows units, GB, severity, pipeline and cost centre for 30/90 days.
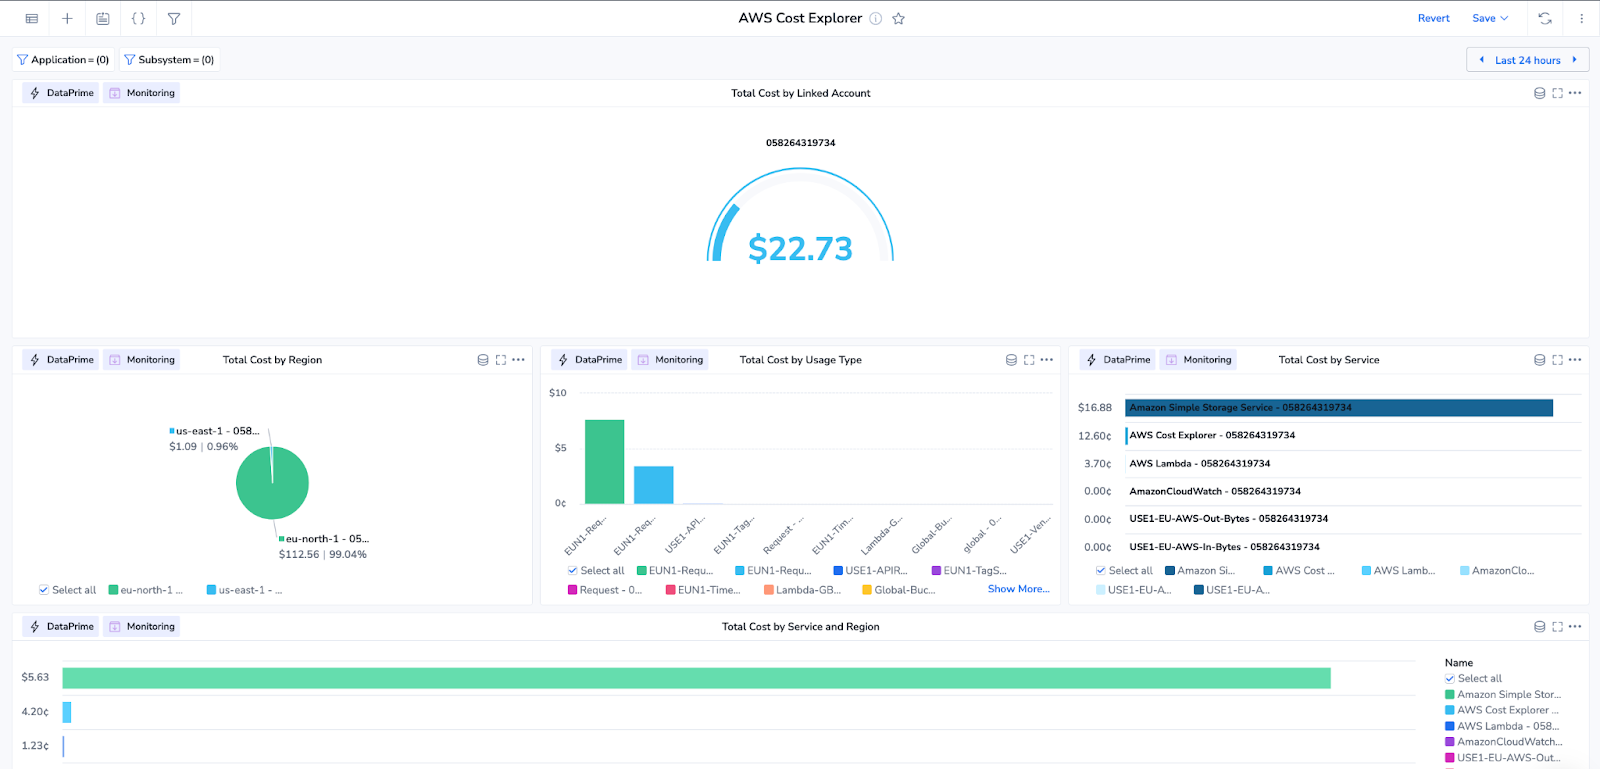
4.2 Associated AWS spend
- S3 archive size is collected via AWS Cost Explorer integration and shown as native metric.
- Compute usage for private VPC deployments shown in AWS Cost Explorer tag Coralogix-Compute.
4.3 Executive packs
- Scheduled dashboards email weekly KPI summary to operations leadership – unit headroom, savings realised, adoption trend.
5. Macro‑Level Governance
Fine‑grained controls exist, but best practice is to operate with a buffer (for example 20‑30 percent above average daily usage) and manage at team or application level – not per gigabyte. This avoids operational drag while still preventing surprise invoices.
6. Conclusion
Coralogix couples deep visibility with policy automation to reduce total cost of ownership by up to two‑thirds. Organizations gain confidence that growth in telemetry will not translate into runaway bills.
FAQ – Common questions and solutions
How do I view overall units consumption? (Section 1.1)
Overall units consumption can be viewed using the Data Usage UI in the Coralogix platform.
How do I see quota usage %? (Section 1.1)
View quota usage percentage, split by data type and TCO use case, using the Data Usage Gauges.
How do I see volumes of data, by telemetry data type and TCO use case? (Section 1.1)
The TCO Distribution table allows you to see GB volumes for every data type and TCO use case.
How do I view Unit & GB consumption per team? (Section 1.1)
The teams tab in the Data Usage UI breaks down the usage by individual teams.
How do I track unit consumption by application and subsystem? (Section 1.1)
Coralogix offers data usage metrics, that allows users to drill down into their specific costs, including by application and subsystem.
How can I view $ spend per team? (Section 4.1)
By generating data usage metrics, and calculating unit consumption x contractual unit price, customers can connect $ spend to individual teams.
Can I track AWS costs using Coralogix? (Section 4.2)
Yes. By ingesting AWS billing data, customers are able to interactively explore their AWS billing information in the Coralogix environment.
Key links and extra reading:
Coralogix logs TCO:
https://coralogix.com/docs/user-guides/account-management/tco-optimizer/logs/
Coralogix Traces TCO:
https://coralogix.com/docs/user-guides/account-management/tco-optimizer/traces/
Metric cost optimizer:
https://coralogix.com/docs/user-guides/account-management/payment-and-billing/metrics-optimization/
Coralogix Block rules:
https://coralogix.com/docs/user-guides/data-transformation/parsing/log-parsing-rules/#block
Coralogix drop fields:
https://coralogix.com/docs/user-guides/data-transformation/parsing/log-parsing-rules/#remove-fields
Coralogix dynamic blocking:
https://coralogix.com/docs/user-guides/data-transformation/dynamic-blocking/
Coralogix TCO app:
https://coralogix.com/docs/developer-portal/infrastructure-as-code/tco-controls/dynamic-tco-app/
Coralogix usage:
https://coralogix.com/docs/user-guides/account-management/payment-and-billing/data-usage/
Coralogix usage detailed metrics:
https://coralogix.com/docs/user-guides/account-management/payment-and-billing/data-usage-metrics/
Coralogix usage API:
https://coralogix.com/docs/developer-portal/apis/data-management/data-usage-service-api
Coralogix org admin quota console:
https://coralogix.com/docs/user-guides/account-management/organization-management/organization-admin-console/#quota-manager