AWS Elemental MediaTailor – measuring transcoding performance with Coralogix

AWS Elemental MediaTailor provides a wealth of information via metrics, but one key feature that is very difficult to track is the Transcoding performance. What is transcoding and why is performance important?
The role of transcoding in ad insertion
Dynamically inserting advertisements to streaming customers is a fundamental revenue component for video platforms. It’s not enough to show everyone the same advert, because each person has their own individual interests. The mission is to show relevant adverts. This means that, on the fly, advertisements should be inserted into media streams.
This is done by a process known as transcoding, where the original video stream is mutated to include the adverts that are most appropriate for the viewer. However, this puts transcoding on the critical path. If transcoding slows down, customers may experience buffering times or, worse, disconnections. So how do we measure transcoding performance, without latency metrics?
Back to basics: Log Analytics
AWS Elemental MediaTailor produces logs indicating when transcoding operations are happening. Typically, log analytics at this scale would be impossibly cost prohibitive, but Coralogix TCO Optimizer makes it possible to process this data at costs as low as $0.20/GB (depending on volume!). The trick is to break free of indexing. So how did we solve this problem? Let’s find out.
Integrating the data
The first thing was to integrate the data from AWS Elemental MediaTailor. Right now, AWS Elemental MediaTailor only supports shipping logs to Cloudwatch, so we can do a few things here:
- Reduce the TTL for logs in cloudwatch to the lowest possible (1 day)
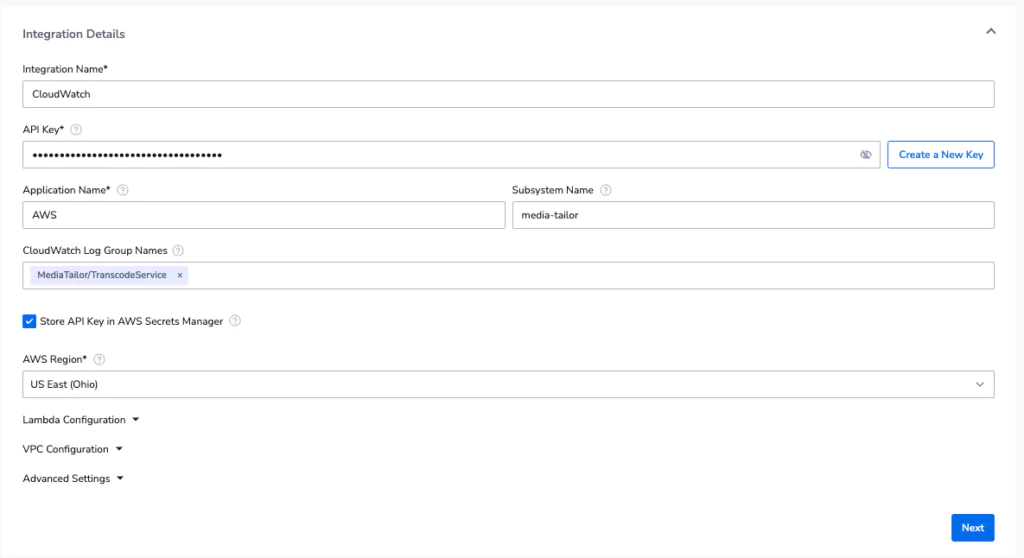
- Deploy a Cloudwatch Collector lambda using the Coralogix integration flow
Deploying the lambda is as simple as deploying a customized cloud formation stack, via the Coralogix UI:
Setting our TCO Optimizer
The goal is to ingest these logs without any dependency on traditional indexing or high performance storage. We also want to generate some alerts & metrics from this data, so it’s perfect for the Monitoring use case. This cuts down our ingestion costs by 68% and means we can make much, much better use of our data.

Utilizing DataPrime, Natural Language & Remote Query
Coralogix supports advanced analytics using DataPrime querying language and, crucially for this use case, direct querying of data that has never been indexed. This means that even though we didn’t make use of SSDs or traditional indexing, high performance queries are still available to us.
NOTE: Because of the Coralogix pricing model, we don’t charge per query, only by GB volume. Once the data is in Coralogix, you won’t be charged extra for how you use it.
Whenever I am about to use DataPrime, I always leverage our AI querying capability, which enables me to ask questions in plain English and have the Coralogix assistant generate the query for me… and generate it did, immediately giving me the difference for each transcode event from initialized to completion.
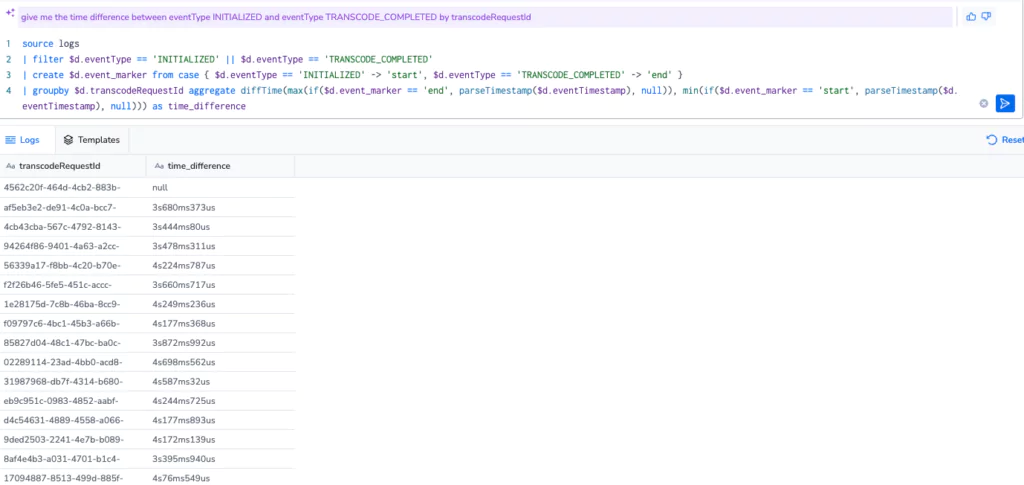
This was a great start, and after some prompt engineering (literally adding the word “average”), I collapsed the query down into a single average value in seconds. Amazing!

And by the way, if we wanted to implement this another way then we could, using joins:
source logs | filter transcodeRequestId != null
| filter eventType == 'INITIALIZED'
| join (
        source logs
        | filter eventType == 'TRANSCODE_COMPLETED'
    )
    on left->transcodeRequestId == right->transcodeRequestId into transcode_end_event
| filter transcode_end_event != null
| select transcode_end_event.eventTimestamp as transcode_end_time, eventTimestamp as transcode_start_time
| create lead_time from transcode_end_time:timestamp - transcode_start_time:timestamp
DataPrime is like any programming language. There are multiple ways to solve a problem, and the solution is as much dependent on the knowledge and comfort of the writer as it is on harder metrics like efficiency. Having this kind of expressive capability is crucial for easy exploration and analysis of your data.
The next level, with Events2Metrics
Directing queries to the archive using DataPrime is extremely powerful, but Coralogix is a broad and flexible platform, meaning there are often a few options for solving a problem. Let’s explore how we might tackle this issue using metrics.
First, we need to define our metrics, which we can do using the Events2Metrics interface in Coralogix:
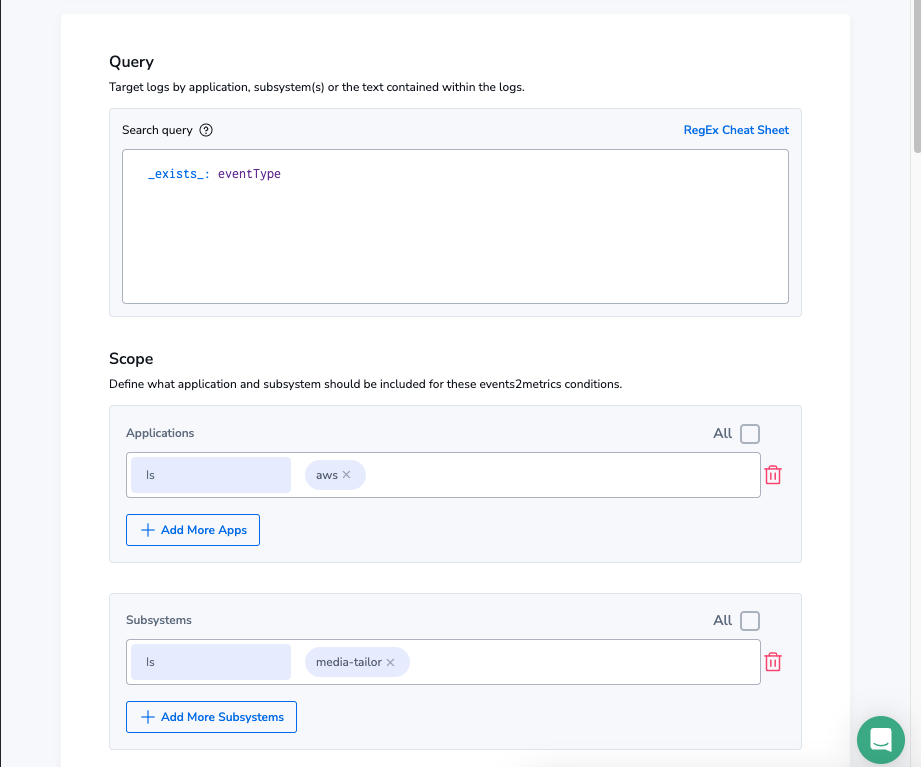
This gives us a gauge metric, which is a count of the number of events coming in from Media Tailor with an event type (ad insertion & transcoding events have event types), per minute. Next, we need to define some labels that mean we can slice this data up how we need. To do this, we’ll add the event type as a label.
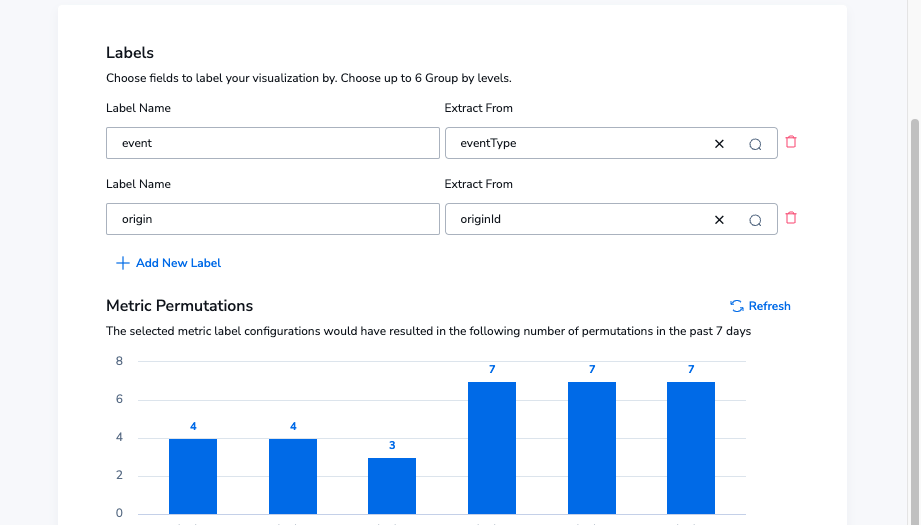
Notice the low permutation count here, indicating that this metric is not even close to high cardinality. For context, this metric is expected to use 7 permutations, and accounts begin with a soft limit of 10 million.
Analyzing using PromQL
Because of the nature of the log, there isn’t a single latency value. We also can’t label the metric with the start and end times, because it will result in absurd cardinality. Instead, we need to think about how we consider latencies.
If we think about transcoding as a series of processes, there are three stages:
- Transcoding Initialized
- Transcoding In Progress
- Transcoding Completed
We’re seeking to measure the time between Initialized & Completed. This is not unlike a manufacturing process, which means we can take a well understood calculation from manufacturing to approximate our lead time: Little’s Law, which states that:
Lead Time = WIP / ThroughputImplementing Little’s Law in PromQL
Fortunately, this is made really simple. Because of how Coralogix is aggregating the metrics, each point simply needs to be summed up. We should also pick a time range that will help to smooth over any minute to minute oddities. Calculating our WIP is made simple:
WIP = Number of Initialized Jobs [5m] - Number of Completed Jobs [5m]And translating this into PromQL is very straightforward:
(sum(sum_over_time(media_tailor_transcoding_cx_docs_total{event="INITIALIZED"}[5m])) - sum(sum_over_time(media_tailor_transcoding_cx_docs_total{event="TRANSCODE_COMPLETED"}[5m]))Next, we need to compute our throughput, which looks remarkably similar. Throughput is defined as the rate at which jobs are either entering or leaving the system. In this case, it’s the sum of transcode completions over the past 5 minutes.
sum(sum_over_time(media_tailor_transcoding_cx_docs_total{event="TRANSCODE_COMPLETED"}[5m]))And now we need to plug these values into the formula, so it is the WIP divided by the throughput, which gives us a value aggregated into 5 minute buckets. We then want to transform the value into seconds to normalize it, which is as simple as multiplying the result by 60 (for seconds) and 5 to counteract the 5 minute window.
clamp_min((sum(sum_over_time(media_tailor_transcoding_cx_docs_total{event="INITIALIZED"}[5m])) - sum(sum_over_time(media_tailor_transcoding_cx_docs_total{event="TRANSCODE_COMPLETED"}[5m]))), 0) / sum(sum_over_time(media_tailor_transcoding_cx_docs_total{event="TRANSCODE_COMPLETED"}[5m])) * 60 * 5NOTE: You’ll notice the clamp_min there. That is to handle an edge case where there is a sudden spike in transcode completions, which makes it possible to produce a negative value. In this case, the lead time is obscured, but this is very rare.
The result
We end up with a few really powerful graphs that we can use to visualize and understand our transcoding throughput.
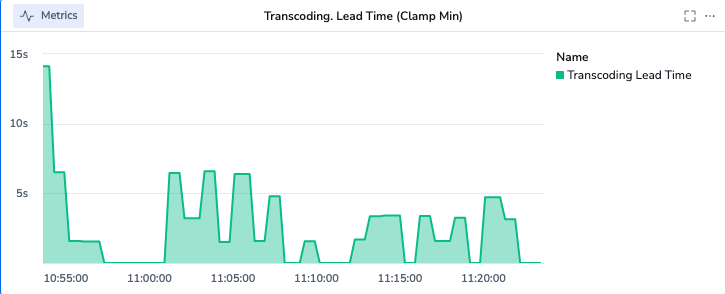
NOTE: By normalizing to seconds, we can set the unit and make the graph very readable.
From the dashboard UI, we can also define alerts, straight from the interface. For example, we may wish to trigger an alarm on any transcoding that takes longer than 15 seconds:
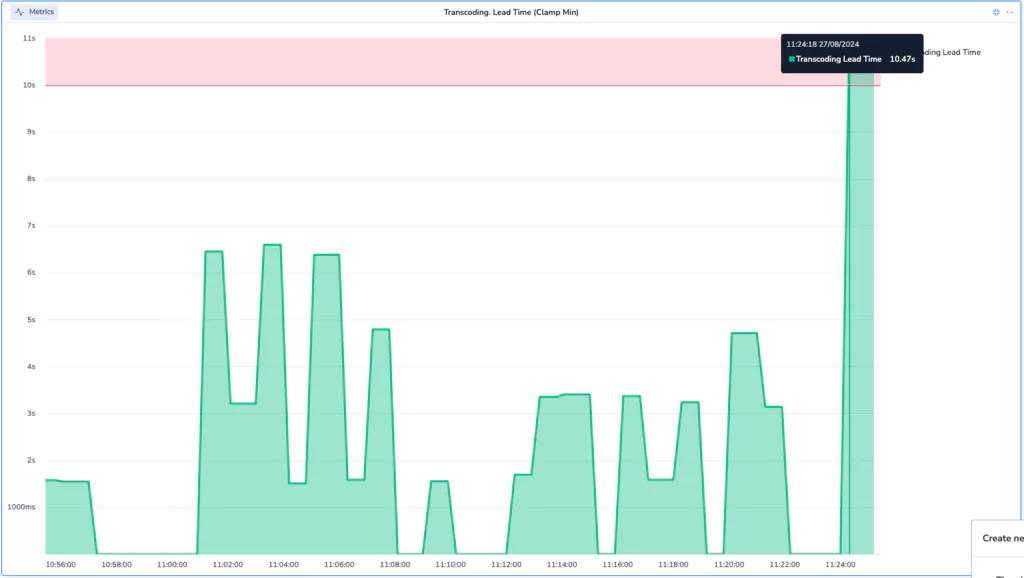
Our alert is automatically populated with our metrics details, including the query and any applied filters.
Wrap up
There are lots of new directions we can take this data, now that we have it:
- We can compute other key metrics, like throughput.
- We can build a much more sophisticated custom dashboard
- We can define flow alerts to correlate this transcoding performance with cloudfront data.
But for one blog post, we think that visualizing complex logs, querying them directly in the archive, converting them to metrics, building mathematical formulae into graphs and exporting those formulae into alerts is enough!


