How DevOps Monitoring Impacts Your Organization
DevOps logging monitoring didn’t simply become part of the collective engineering consciousness. It was built, brick by brick, by practices that have continued to grow and flourish with each new technological innovation.
Have you ever been forced to sit back in your chair, your phone buzzing incessantly, SSH windows and half-written commands dashing across your screen, and admit that you’re completely stumped? Nothing is behaving as it should and your investigations have been utterly fruitless. For a long time, this was an intrinsic part of the software experience. Deciphering the subtle clues left behind in corrupted log files and overloaded servers became a black art that turned many away from the profession.
DevOps observability is still somewhat changing, and many will have different ways to score how observable a system is. Within DevOps monitoring, There are three capabilities that continue to make themselves key in every organization. Monitoring, logging monitoring, and alerting.
By optimizing for these capabilities, we unlock a complex network of software engineering success that can change everything from our attitude, to our risk exposure, or to our deployment process.
DevOps Monitoring – What is it?
Along the walls of any modern engineering office, televisions and monitors flick between graphs of a million different variations. DevOps Monitoring is something of an overloaded term, but here we will use it to describe the human-readable rendering of system measurements.
In a prior world, it would have been enough to show a single graph, perhaps accompanied by a few key metrics. These measurements would give the engineers and support staff the necessary overview of system health. Complexity was baked into the same application back then, so the DevOps monitoring burden was less heavy. Then, microservices became the new hotness.
We could scale individual components of our system, making flexible, intelligent performance. Builds and deployments were less risky because our change impacted only a fraction of our system. Alas, simply seeing what is going on became an exponentially more difficult challenge. Faced with this new problem, our measurements needed to become far more sophisticated.
If you have five services, there are now five network hops that need to be monitored. Are they sufficiently encrypted? Are they running slowly? Perhaps one of the services responds with an error for 0.05 seconds while another service that it depends on restarts. Maybe a certificate is running out. Some high-level measurements aren’t going to adequately lead your investigating engineers to the truth when so much more is going on.
Likewise, if a single request passes through 10 different services on its journey, how do we track it? We call this property traceability and it is an essential component of your monitoring stack.
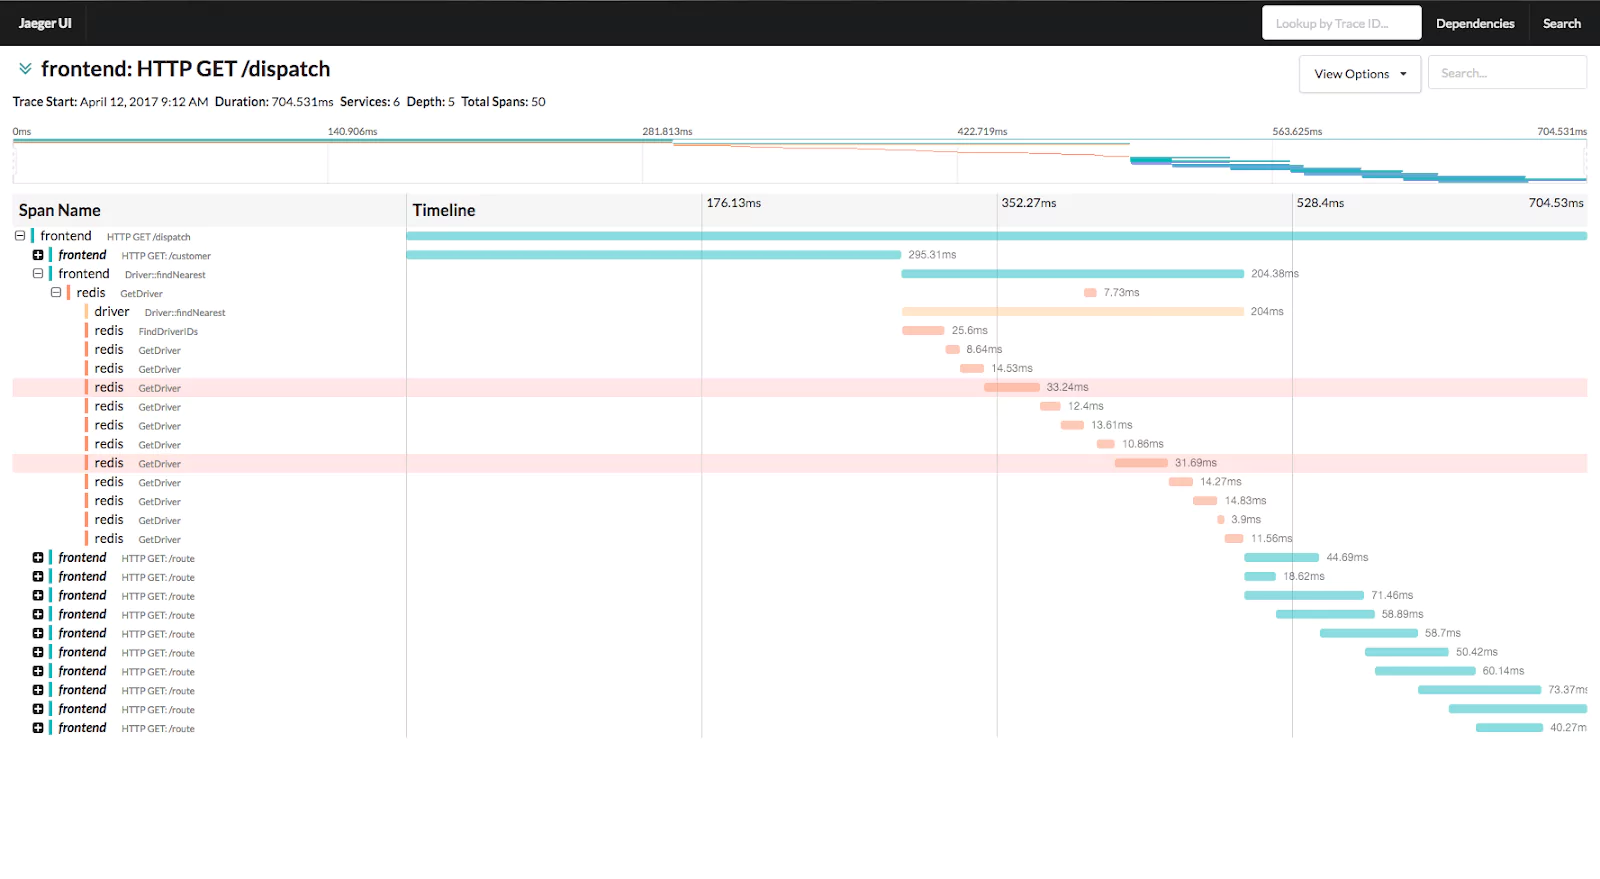
Tools such as Jaeger (pictured above) provide a view into this. It requires some work from engineers to make sure that some specific values are being passed between requests, but the pay off is huge. Tracking a single request and seeing which components are slowing you down gives you an immediate tool to investigate your issues.
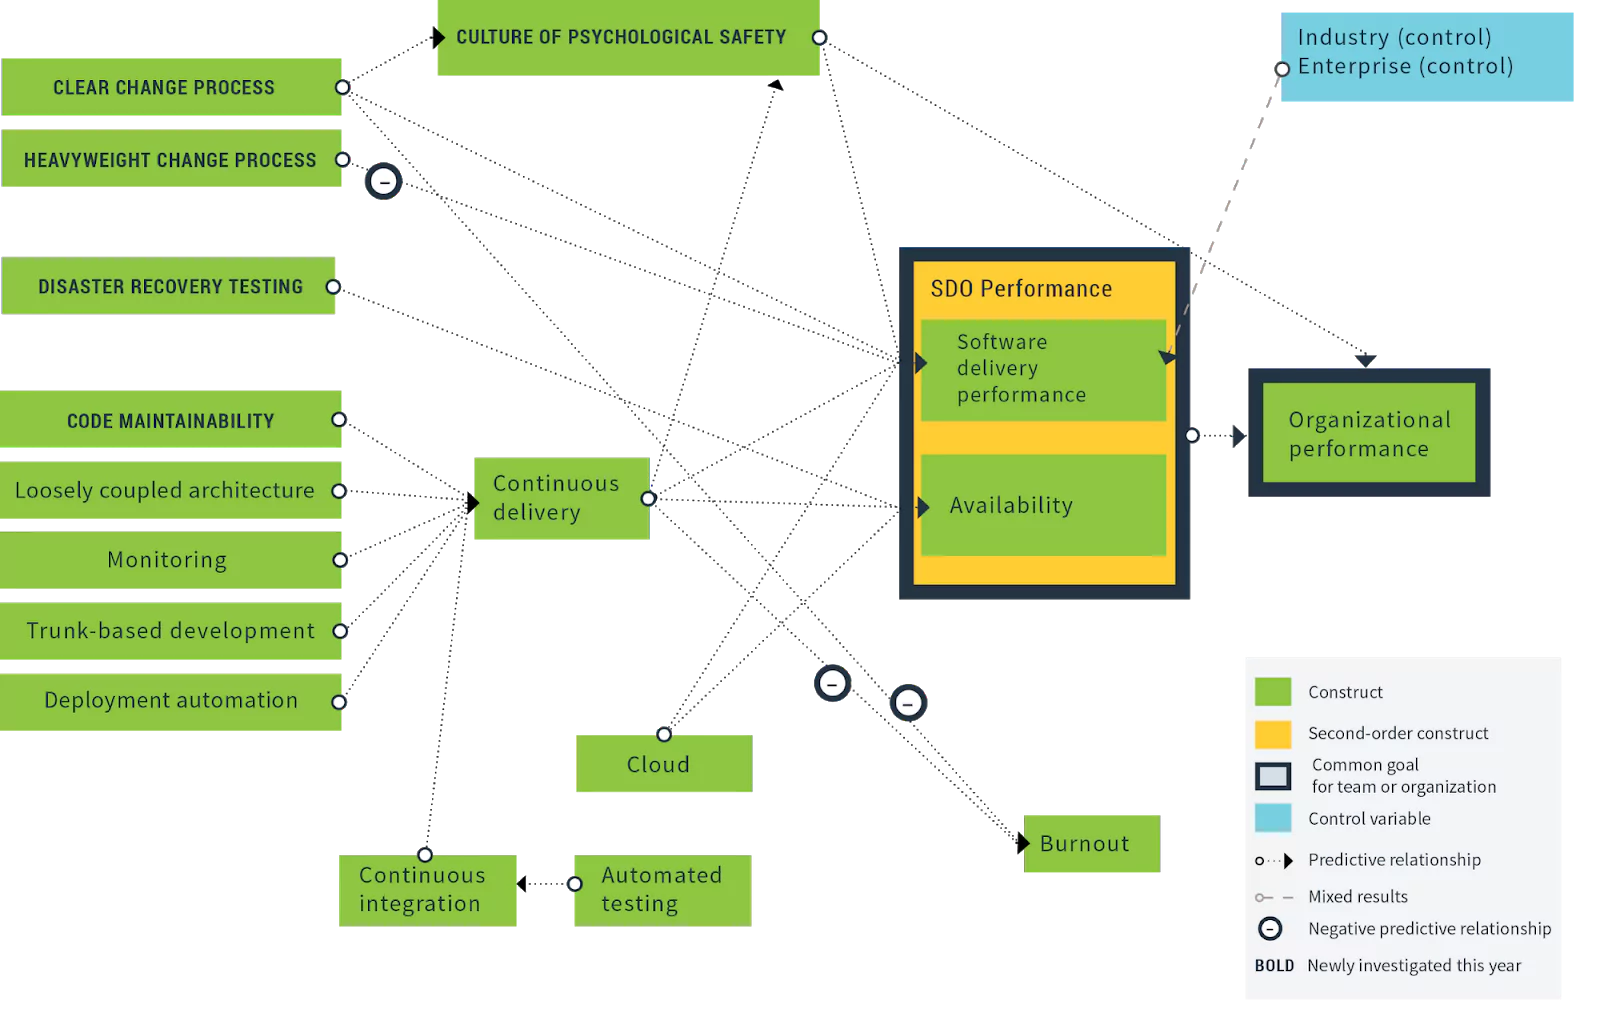
The DORA State of DevOps 2019 report even visualized the statistical relationship between monitoring (capturing concepts we cover here) and both productivity and software delivery performance. It is clear from this diagram that good DevOps monitoring actually trends with improved organizational performance.
Alas, monitoring is based on one single assumption. That when the graphs change, someone is there to see them. This isn’t always the case and as your system scales, it becomes uneconomical for your engineers to sit and stare at dashboards all day. The solution is simple. Information needs to leap out and grab our attention.
Alerting
A great DevOps alerting solution isn’t just about sounding the alarms when something goes wrong. Alerts come in many different flavours and not all of them need to be picked up by a human being. Think of alerting as more of an immune system for your architecture. Monitoring will show the symptoms, but the alerts will begin the processes that fight off the pathogen. HTTP status codes, round trip latencies, unexpected responses from external APIs, sudden user spikes, malformed data, queue depths… They can all be measured according to risk, alerted and dealt with.
Google splits alerts up into three different categories – ticket, alert and page. They increase in severity, but the naming is quite specific. A ticket level alert might simply add a Github issue to a repository, or create a ticket on a Trello board somewhere. Taking that a step further, it might trigger bots that will automatically resolve and close the issue, reducing the overall human toil and freeing up your engineers to focus on value creation.
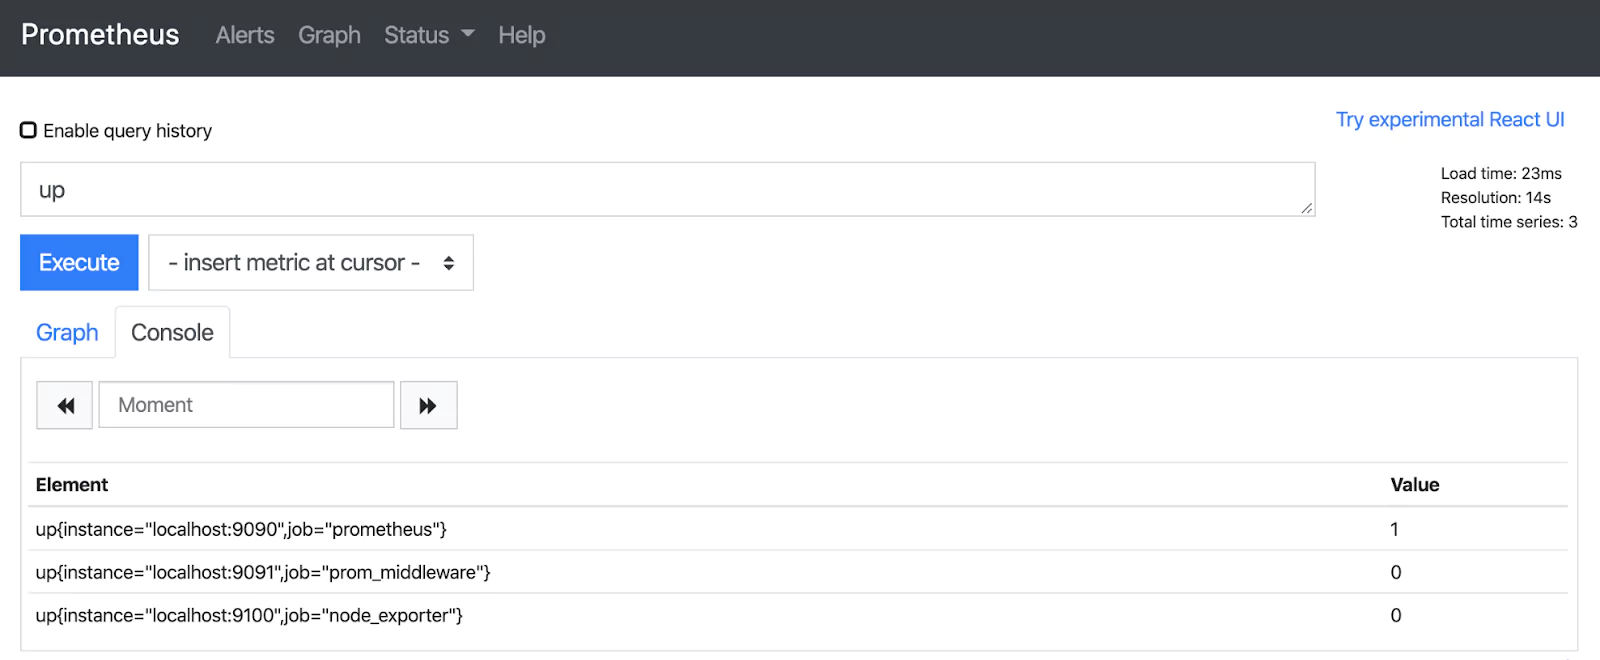
In the open source world, Alertmanager offers a straight forward integration with Prometheus for alerting. It hooks into many existing alerting solutions, such as Pagerduty. As part of a package, organisations like Coralogix offer robust and sophisticated alerting, alongside log collection, monitoring and machine learning analytics, so you can remain part of one ecosystem.
Good alerts will speed up your “mean time to recovery”, one of the four key metrics that trend with organizational performance. The quicker you know where the problem is, the sooner you can get to work. When you couple this with a sophisticated set of monitoring tools, that enables traceability across your services, and efficient, consistent logs that give you fine-grained information about your system’s behavior, you can quickly pin down the root cause and deploy a fix. When your fix is deployed, you can even watch those alerts resolve themselves. The ultimate stamp of a successful patch.
Logging
When we hear the word “logging”, we are immediately transported to its cousin, the “logfile”. A text file, housed in an obscure folder on an application server, filling up disk space. This is logging as it was for years, but software has laid down greater challenges, and logging has answered with vigor. Logs now make up the source of much of our monitoring, metrics, and health checks. They are a fundamental cornerstone of observability. A spike in HTTP 500 errors may tell you that something is wrong, but it is the logs that will tell you the exact line of broken code.
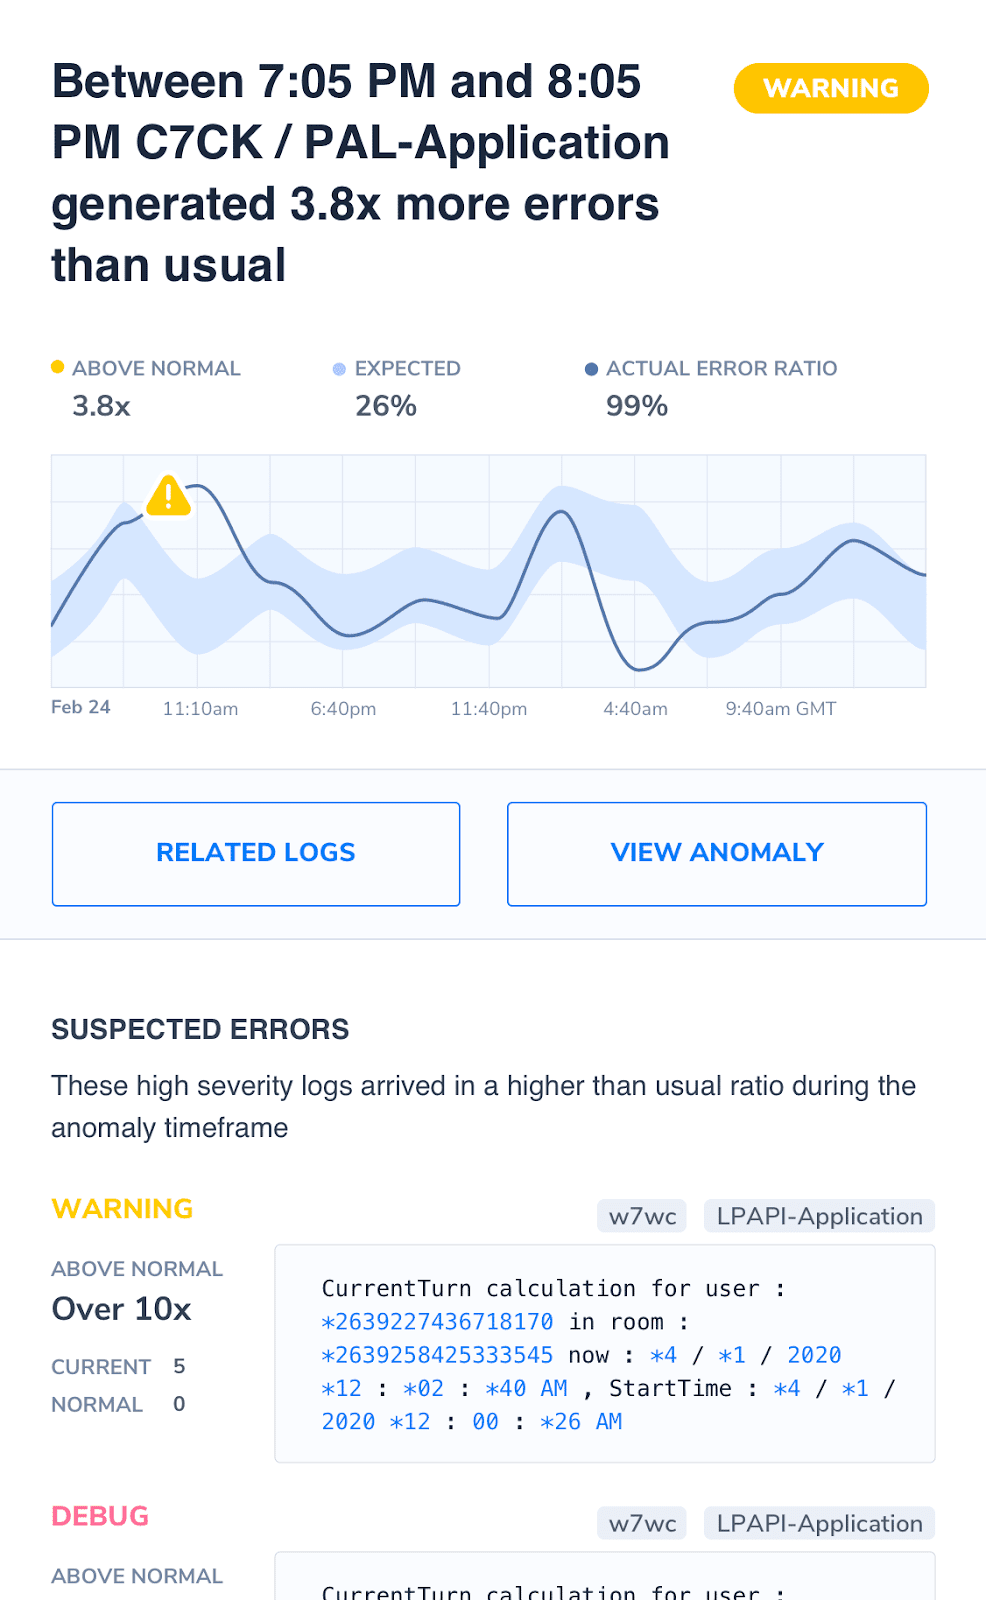
As with DevOps monitoring, modern architectures require modern solutions. The increased complexity of microservices and serverless mean that basic features, such as log collection, are now non-negotiable. Machine learning analysis of log content is now beyond its infancy. As the complexity of your system increases, so too does the operational burden. A DevOps monitoring tool like Coralogix, along with its automatic classification of logs into common templates coupled with the version benchmarks makes it possible to immediately see if some change or version release was the cause of an otherwise elusive bug.
Conclusion
Monitoring is a simple concept to understand, but a difficult capability to master. The key is to decide the level of sophistication that your organization needs and be ready to iterate when those needs change. By understanding what your system is doing and creating layers of complexity, you’ll be able to know, at a glance, if something is wrong.
Combined with alerts, you’ve got a system that tells you when it is experiencing problems and, in some cases, will run its own procedures to solve the problem itself. This level of confidence, automation, and DevOps monitoring changes attitudes and has been shown, time and time again, to directly improve organizational performance.
Over the course of this article, we’ve covered each of the topics and how they complement the monitoring of your system. Now, primed with the knowledge and possibilities that each of these solutions offers, you can begin to look inward and assess how your system behaves, where the flaws are and where you can improve. It is a fascinating journey, and when done successfully, it will pay dividends.


