How to Troubleshoot AWS Lambda Log Collection in Coralogix
AWS Lambda is a serverless compute service that runs your code in response to events and automatically manages the underlying compute resources for you. The code that runs on the AWS Lambda service is called Lambda functions, and the events the functions respond to are called triggers.
Lambda functions are very useful for log collection (think of log arrival as a trigger), and Coralogix makes extensive use of them in its AWS integrations.
This post will provide you with few tips on how to troubleshoot a situation where you don’t see or receive logs in Coralogix that are supposed to be collected and shipped by an AWS Lambda function.
7 Common Reasons You Can’t See Your Lambda Logs in Coralogix
The first things to check are some of the most trivial, but still very common, reasons for not seeing your logs within Coralogix (we promise not to tell anyone if this happens to you).
- Block Rules– Check whether your data is being blocked by any block rules set in your account under the Settings Menu –> Rules or under TCO (note that these tabs are in the settings menu and are accessible only to the account administrator).
- Private Key and Company ID– Make sure your Lambda function is using the correct private key for your account. You can find it in the Settings Menu –> Send Your Logs tab on the top left. For some of the integrations, you might need to also provide the company ID. You can find it in the same place as the Elasticsearch API Key.
- Filters– Check if you have any active filters applied in the Coralogix app (e.g. On the top-right for LiveTail or on the left panel in the Logs screen view or the Application/Subsystem dropdowns on the top right of some screens)
- Reaching Quota – Check the Coralogix logs or dashboard screens to see if the account reached its daily quota. If your quota has been reached, you’ll see a message on the top of the screen displaying a quota usage warning (sometimes a hard browser refresh is required to see the message).

- Status Page– Check out the Coralogix status page here. You can also subscribe to it to get live notifications to your email in case there are any issues with our platform.
- Your Lambda function environment variables – Verify that you’re sending the mandatory applicationName and subsystemName metadata fields.
- Your Lambda function triggers – make sure you have the correct triggers configured in your Lambda by clicking on the Lambda in question and verifying the triggers. If triggering requires changes, click on ‘Add a trigger’ or on the trigger itself to make the appropriate changes.
If none of these have uncovered the problem, the next step is to start and drill into the Lambda itself using AWS’s Lambda function monitoring graphs.
Lambda Function Monitoring
In AWS, go to Services->Lambda->Functions and click on the name of the specific Lambda you are troubleshooting. Then click on Monitoring.
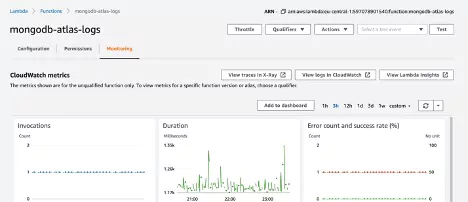
We will use some of these graphs to identify issues with the Lambda.
- Error count and success rate
When there are errors in the Lambda, you should see a red dot or red line depending on the period the errors have been happening.
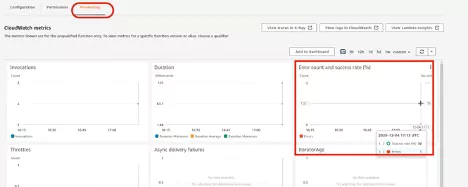
- Invocations and duration time
Using the graphs, compare the duration to historic values when you know the Lambda worked. A significant difference might indicate an issue. You do not want to see a duration that is very short (around 1-2 ms) that tells you that the lambda did not run properly.
You also don’t want to see a Lambda duration that ends with 00 (i.e. example 9000.00). This means that the lambda timed out. In this case, increase the timeout parameter in the lambda configuration. Maximum time out is 15 minutes.
- Memory usage
Make sure the memory allocated to this Lambda is more than the memory used. If the memory used is more than the memory allocated that indicates that you need to up the memory for the Lambda function.
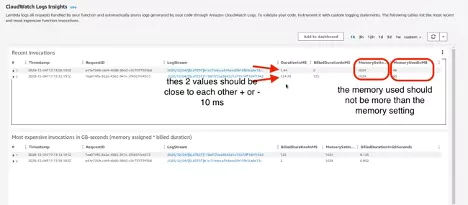
Lambda Invocation Logstream
Check the logstream for the last invocation for the lambda in Cloudwatch. Usually, AWS saves lambda logs in cloudwatch under /aws/lambda/lambda-function-name. You want to check this logstream and see if there are any errors. If there are, take a look and try to fix them.
If none of the above fixed the problem, it is time to dive deeper into the Lambda function and turn on debug mode.
Debug Mode
Each one of our integration Lambda functions is shipped with an optional debug execution mode. Enabling debug is done by removing the comment form the debug line at the bottom of the Lambda function code.

You want to check monitoring under the Lambda in question to make sure there are no errors in the log of the LAMBDA execution.
If none of these steps have uncovered the source of the problem, you can always reach out to Coralogix Support to get help with resolving the issue.


