Is your CDN really at the edge?

tldr: This post discusses how to measure CDN request locality without indexing a single log.
The function of a CDN is to bring cacheable data, like pictures & videos, physically closer to your customers. This reduces latencies, and load on your backend servers. When measuring CDNs, there are some very common metrics:
- Latency (mean, median, 95th and 99th percentile)
- Error Rate
- Cache hit / miss
These are important metrics, but they don’t test one fundamental component of CDNs, and indeed Edge computing in general. Is the edge really all that close to the customer? In short, how do you measure request locality?
The problems with monitoring CDNs
CDNs are utilized to help organizations manage scale. High volume traffic, however, drives high volume telemetry. This complicates matters, and while CDNs offer dashboards within their UI, they can not easily be correlated with other data, like RUM or application telemetry.
- High volume of logs makes it impossible to index everything and maintain performance and cost effectiveness
- A limited set of metrics creates a rigid and shallow observability experience
- The siloing of data within the CDN UI makes it impossible to correlate data.
The solution
Coralogix has a set of features that tackle the problem of deep CDN monitoring directly, so let’s walk through the steps I took to build a suite of detailed metrics, including request locality (requests that were made from a user to a CDN node within the same country). We have:
- An empty Coralogix account.
- Some JSON logs from an Akamai CDN server
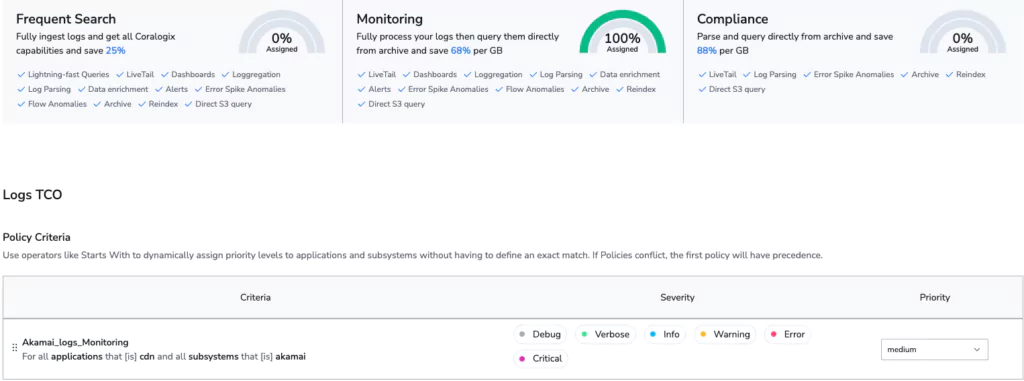
Step 1: Cost optimization
Our goal is to avoid indexing any data. In Coralogix, this means using the TCO Optimizer to change the data use case. We intend to perform analysis of this data, and archive it in S3, which makes it a perfect fit for the Monitoring use case. Even when the data is archived, it can be directly queried, at will, using Coralogix Remote Query.
Step 2: Geo-location enrichment
We’re interested in the location of the client & the edge node. This information is not natively supplied by Akamai, so instead, we can use Coralogix Geo-location enrichment to add these fields to our log. The two IP fields that we want to enrich are: cliIP and edgeIP. So how do we enrich our logs?
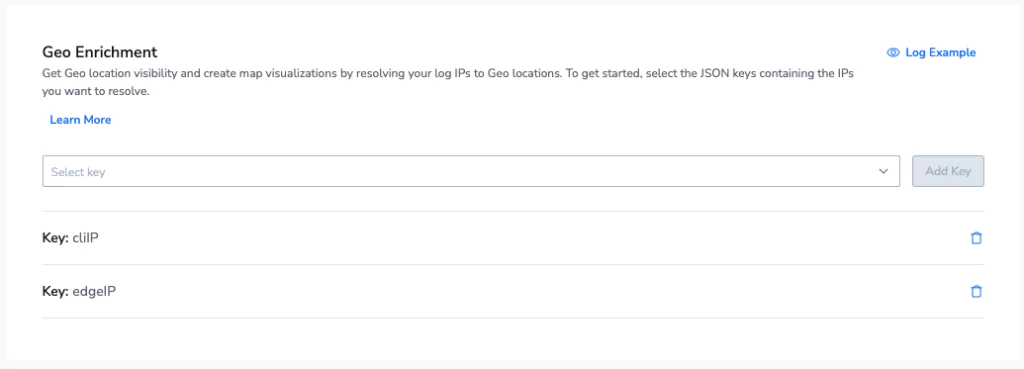
It’s as simple as declaring the fields, and let Coralogix do the rest. This will add a new object to our Akamai logs that contains a wealth of locational information:
<strong><mark style="background-color:rgba(0, 0, 0, 0)" class="has-inline-color has-vivid-green-cyan-color">edgeIP_geoip:{
    ip:180.94.11.246
    ip_ipaddr:180.94.11.246
    location_geopoint:{
        lat:-6.1728
        lon:106.8272
    }
    continent_name:Asia
    country_name:Indonesia
    city_name:Jakarta
    postal_code:null
}</mark></strong>
Note: Coralogix bills only by GB volume, so the enriching service costs nothing to use.
Step 3: Metric generation
Logs that are being processed in the monitoring use case can be queried from a dashboard, train machine learning models, trigger alarms and much more. They can also be used to generate metrics. Converting logs into metrics is an incredible cost optimization method. Metrics can be held for a very long time, while maintaining high performance queries. This is a key step in observability without indexing.
We’ll create an Events2Metric group called Akamai_Edge_Logs_Locality and we’ll query for the appropriate metric. Creating Events2Metrics in Coralogix is easy. Simply specify the logs you want, and the fields you wish to track.
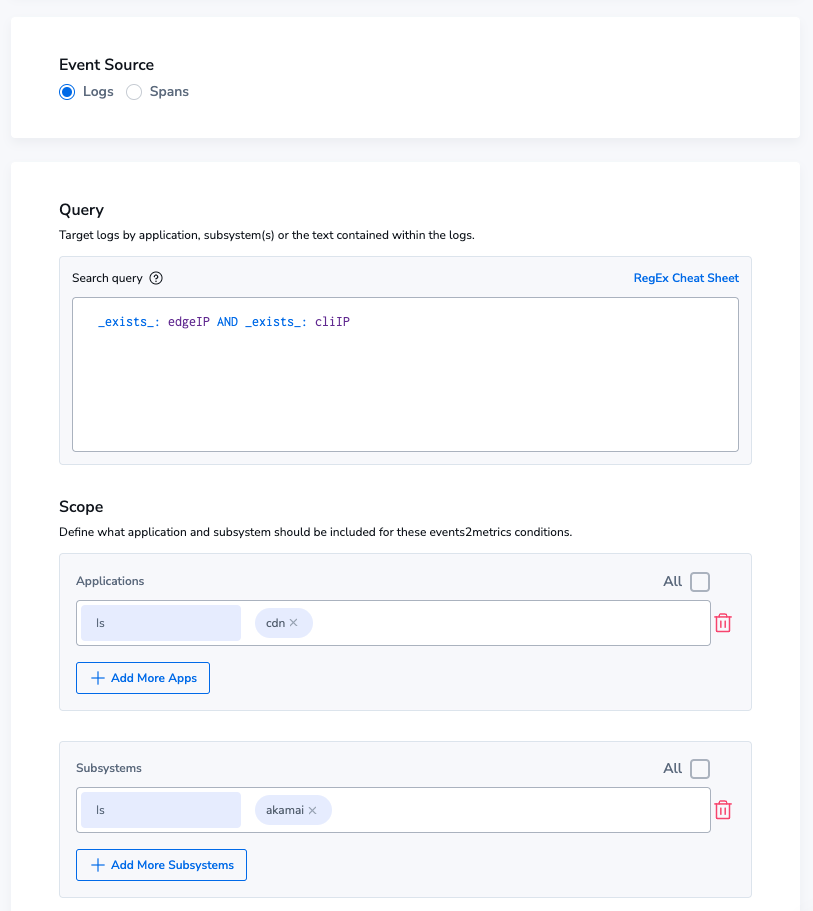
This will generate a metric for us, that we can query as often very quickly, and use PromQL to perform in-depth analysis.
How do we label our metric?
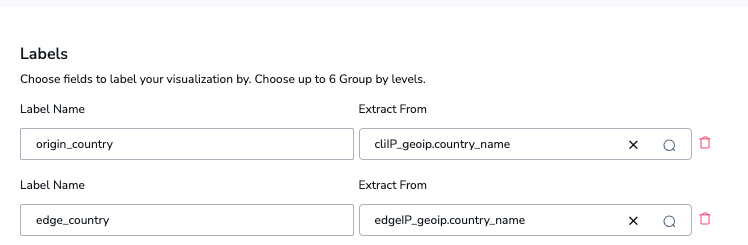
Metric labels can be derived directly from values in the logs. In this case, we want two values, both of which came from our geo enrichment: edgeIP_geoip.country_name and cliIP_geoip.country_name. We will add these as the following:
- The client IP will be added to a metric label source_country
- The Edge IP (the IP of the CDN Node) will be added to a metric label edge_country
Configuring this is completely straightforward, and requires no code at all.
Step 3: Analysis
We’ve now got everything we need to perform our analysis, which is simple.
- Count all of the requests where the source country and the edge country are equal
- Count all of the requests in total
- Divide these two values, to yield a percentage rate of requests served in the same country vs not.
There is a small challenge. PromQL does not natively support comparing two labels like this, so we’ve got to do something interesting with label rewriting. Without too much preamble, the function looks like this:
<strong><mark style="background-color:rgba(0, 0, 0, 0)" class="has-inline-color has-vivid-green-cyan-color">sum(
  akamai_edge_logs_locality_cx_docs_total
  and
  label_replace(akamai_edge_logs_locality_cx_docs_total, "origin_country", "$1", "edge_country", "(.*)")
) / sum(akamai_edge_logs_locality_cx_docs_total)</mark></strong>
Let’s break down each step in this query:
- We’re going to sum, because we want the total amount.
- We’re going to use label_replace to take whatever the value is of origin_country and place it into edge_country, thereby defining the parameters of our query. Sum all metric streams that have the same origin_country and edge_country.
- Divide it by the total amount of requests issued.
This gives us a value between 0 and 1 indicating a percentage rate of how many requests have been served by nodes in the same country as the requester. So what can we do now?
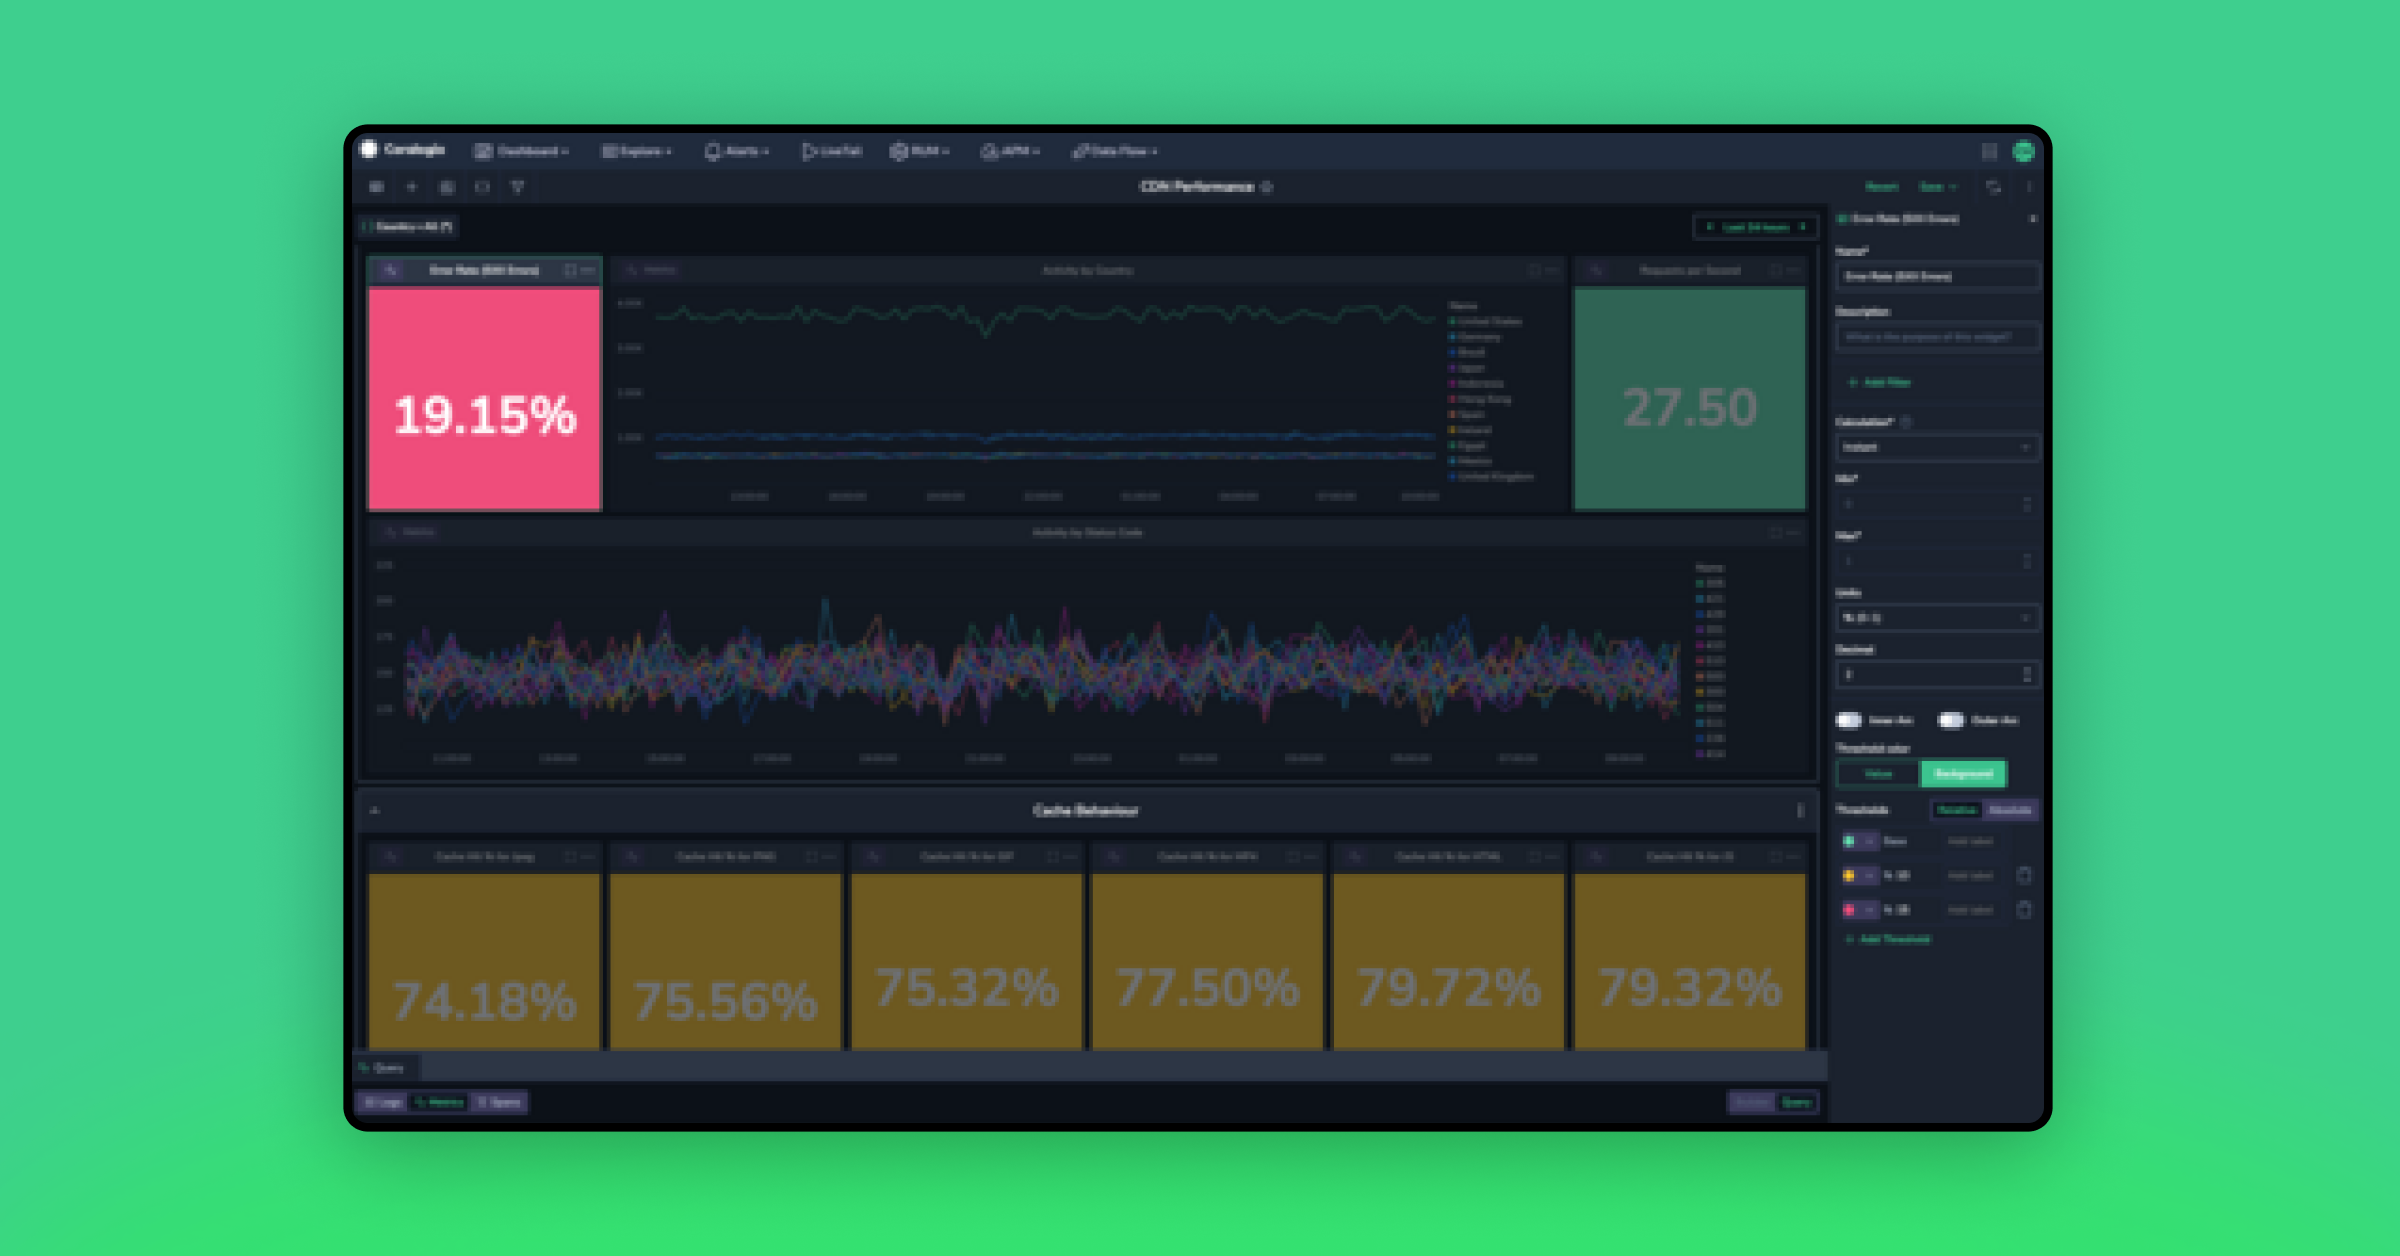
Step 4: Visualize in custom dashboards
We can choose to render this information in a dozen different ways, but the easiest way is to select a gauge widget. This widget type will display a single value. There are some key configurations we will put in place for this widget:
- We will color code it, so that below 50% is red, 70% is amber and above that is green. In other words, if less than half of our traffic is being served in the country from which it has originated, we need to know about it.
- We set the units on the gauge to be %(0-1). This will ensure the gauge represents the data in the most readable format.
The result is a wonderful, color coded tile!
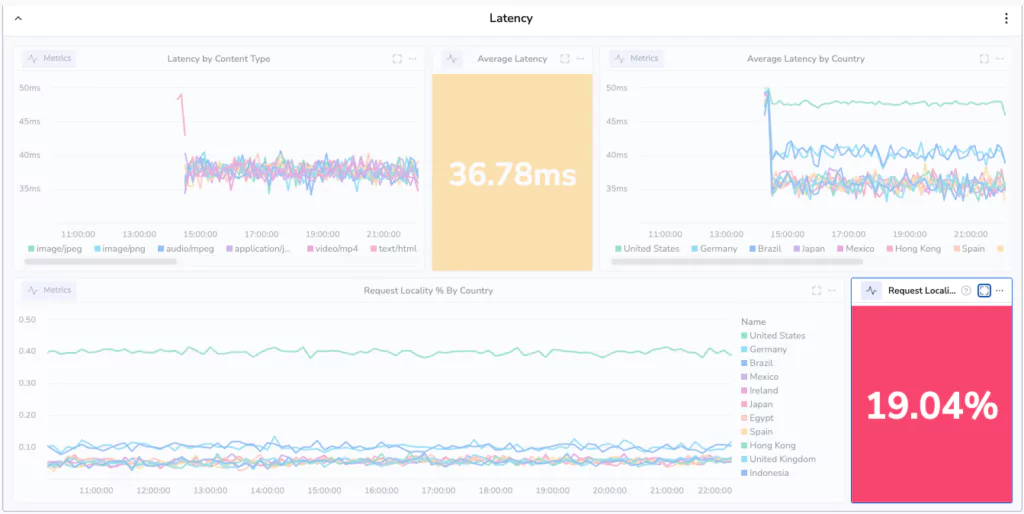
Oh dear, 19.04%! That’s terrible. Less than 1/5th of our requests are being handled within the same country. This may have serious latency implications for our users. We’d better investigate! But how do we make sure we know if this happens again?
Step 5: Defining an alert… in style
Our line graph has a 3 dot menu on it. By selecting this menu, some hidden features pop up.
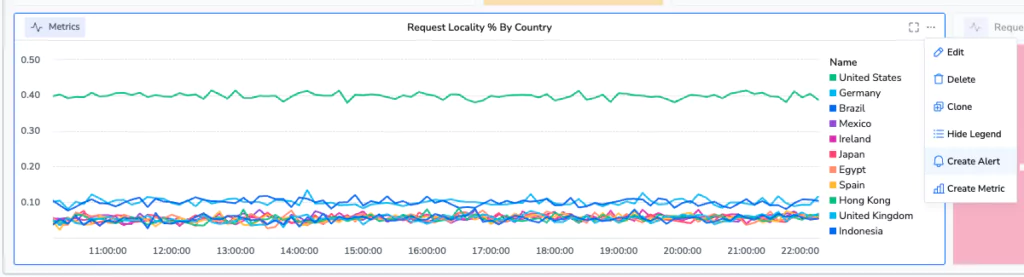
One of them is the ability to create an alert directly from this alarm. By selecting this, a UI appears over your graph with a threshold.
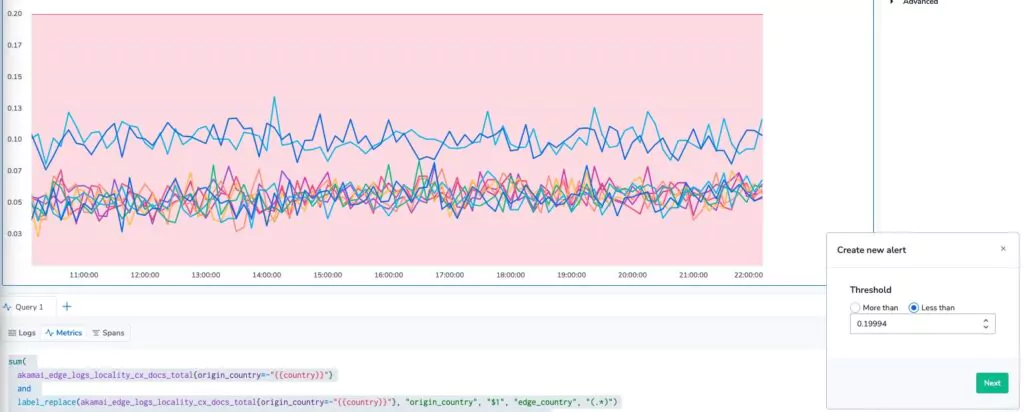
We can now easily define an alarm, set priorities, set more complex alerting conditions and more, so that we find out when the edge of our CDN isn’t as sharp as we’d like it to be!
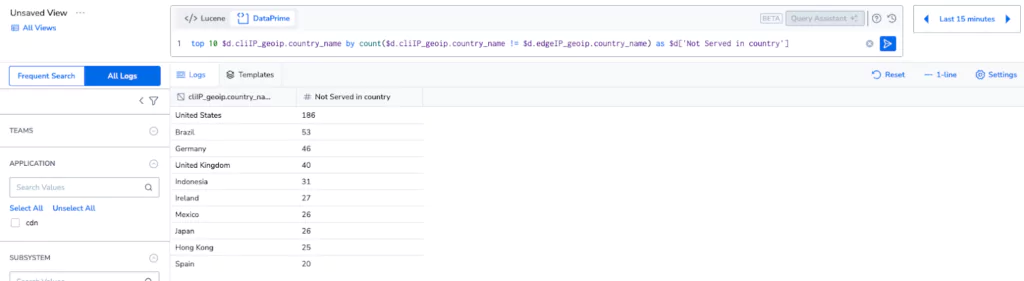
Step 6: But what if I want to access my logs?
Without indexing, logs are typically only available if they’re rehydrated, but Coralogix does not depend on indexing, even for queries. By switching to logs explore, and selecting All Logs mode, customers can directly query the logs, held in the cloud storage in their own account, for no additional cost per query. This allows for deeper exploration of data, and unprecedented insight generation with absolutely no cost implications.
Summary
Throughout this tutorial, we’ve used a number of Coralogix features to solve a complex and nuanced observability problem. We have:
- Used the Coralogix TCO Optimizer to remove 70% of our costs.
- Enriched IP addresses with geo-locational information.
- Converted those logs into metrics for low cost, high performance and very long retention.
- Visualized our locality metric in a custom dashboard.
- Defined an alarm, directly from within the custom dashboard, to minimize context switching.
- Explored our original logs that were never indexed in the first place, using Coralogix Remote Query.
Now if you don’t mind, my edge locality just dropped below 20% and I have to know why!