You don’t need ALL those metrics!

Metrics are key to monitoring system health and performance but you probably are ingesting far more metrics than you will ever need or use.
The issue is that popular tools in this space, such as OpenTelemetry and Prometheus, leverage node exporters to emit a plethora of metrics. OpenTelemetry tracks even the minutest details of system performance. Prometheus exporters can generate a vast array of metrics, ranging from CPU usage to disk I/O, and everything in between.
These metrics provide insights into system operations. However, not all metrics are created equal, and many emitted metrics are never even queried or used. For instance, have you ever used the following metrics:
node_arp_entries

node_network_receive_nohandler_total

node_sockstat_RAW6_inuse

node_slabinfo_pages_per_slab

node_softnet_dropped_total

node_softnet_processed_total
Even if you personally have leveraged some of these at some point in time, for most folks, these are examples of rarely used metrics that nonetheless are being ingested, potentially eating your observability budget while slowing your system down. I mean, just imagine this data per network card, CPU, and host. This cardinality keeps multiplying!!
This is why we are excited to introduce Coralogix Metrics Cost Optimizer, so you can scale up your observability, effectively and economically.
But before we get into the details of our latest offering, why is it that until now, so many of us have endured this metrics madness?
Dropping metrics at emission is complicated
Yes, the logical solution to all this is to drop the irrelevant metrics at the time of emission. However, this approach is not straightforward at all.There are known approaches to reducing costs, such as filtering collected and forwarded metrics. Using Prometheus relabel_config to implement Allowlists and Denylists.
The workflow is simple and is called Client Side Filtering.
You identify the noisy and unused metrics and block them at the time of emission. However, rolling out to a large farm of agents and collectors requires implementing these decisions in configuration files and dispatching them equally and reliably to all emitters involved in the system.
Configuration Change
- job_name: monitoring/kubelet/1
  honor_labels: true
  honor_timestamps: false
  scrape_interval: 30s
  scrape_timeout: 10s

. . .
  metric_relabel_configs:
  - source_labels: [__name__]
    regex: node_softnet_|node_slabinfo_|node_arp
    action: drop
Additionally, the process of configuring which metrics to emit is inherently error-prone. It typically involves meticulous planning and careful release management to avoid disrupting the observability framework. Incorrect configurations can lead to critical metrics being omitted or, conversely, unnecessary metrics still being collected.
Both scenarios undermine the effectiveness of the observability strategy, making it crucial to have a reliable method for managing metric collection.
Given the risk and delicate precision, teams usually avoid making frequent changes and incurring bills. Here’s an illustration.
Easily identify and block irrelevant metrics with Coralogix
Understanding these challenges, Coralogix has developed a groundbreaking feature aimed at optimizing observability while reducing costs. Our new feature, Metrics Cost Optimizer, empowers you to identify which unneeded metrics are burning through your data quota and safely block them without having to deal with complex configurations or risking the stability of your observability setup. This feature provides a user-friendly interface to streamline the process of identifying and discarding superfluous metrics.
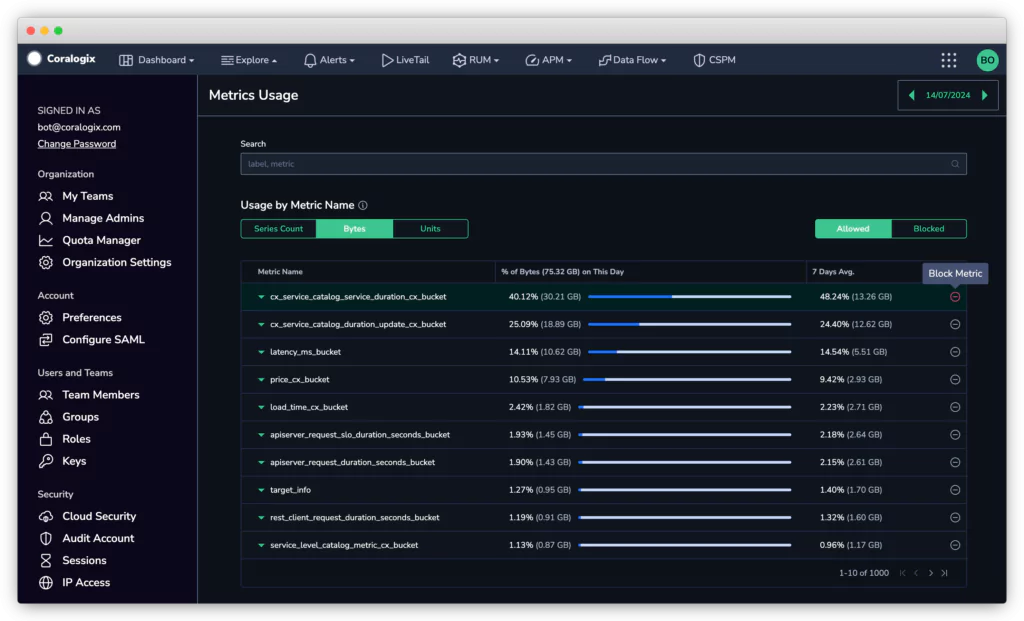
By eliminating unnecessary metrics, our customers can significantly reduce data storage and processing costs. This reduction directly translates into lower operational expenses, making observability more cost-effective.
With irrelevant metrics out of the way, teams can focus on analyzing the data that truly matters. This targeted approach enhances the clarity and utility of the insights derived from the observability system, leading to better decision-making and system performance.
Value based pricing
Coralogix Metrics Cost Optimizer is yet another Coralogix feature (see for example one of our flagship features, the TCO Optimizer) that delivers built-in cost optimization for your observability practice. So say for example you normally ingest 110GB of metrics and decide to block 100 of them. You would end up paying for 11GB (the extra 1 GB is charged for to offset the processing involved in blocking the metrics). So essentially, our Metrics Optimizer enables you to block 100% of the irrelevant metrics, delivering a 90% cost savings for you.
See more details on our transparent and simple pricing model.
Getting started
We’re committed to helping you scale your observability so you can monitor more data, logs, metrics and traces, without overages and cost-prohibitive billing. To get started with our Metrics Cost Optimizer, head over to our documentation for all the details.


