Kubernetes Logging with Elasticsearch, Fluentd, and Kibana

Kubernetes, a Greek word meaning pilot, has found its way into the center stage of modern software engineering. Its in-built observability, log monitoring, metrics, and self-healing make it an outstanding toolset out of the box, but its core offering has a glaring problem. The Kubernetes logging challenge is its ephemeral resources disappearing into the ether, and without some 2005-style SSHing into the correct server to find the rolled over log files, you’ll never see the log data again.
If your server is destroyed, which is perfectly normal, your logs are scattered to the winds – precious information, trends, insights, and findings are gone forever. And should you get a hold of your logs, pulling them out will place extra stress on the very API that you need to orchestrate your entire application architecture. This situation is not palatable for any organization looking to manage a complex set of microservices. A modern, persistent, reliable, sophisticated Kubernetes logging strategy isn’t just desirable – it’s non-negotiable.
Fortunately, there is a remedy. Creating a production-ready K8s logging architecture is no longer the complex feat of engineering that it once was and by leveraging the innate features of Kubernetes, combined with ubiquitous open source tooling, logs will be safely streamed out into a powerful set of analytics tools, where they can become the cornerstone of your operational success.
This tutorial will walk you step-by-step through the process of setting up a logging solution based on Elasticsearch, Fluend and Kibana.
This article is aimed at users who have some experience with Kubernetes. Before proceeding to the tutorials and explanations, there are some concepts that you should be familiar with. The Kubernetes documentation does an excellent job of explaining each of these ideas. If you don’t recognize any of these terms, it is strongly recommended that you take a minute to read the relevant documentation:
- Pod
- Deployment
- DaemonSet
- Sidecar
- Helm
Kubernetes Logging Architectures
Due to the consistency of Kubernetes, there are only a few high-level approaches to how organizations typically solve the problem of logging. One of these archetype patterns can be found in almost every production-ready Kubernetes cluster.
Straight from the Pod
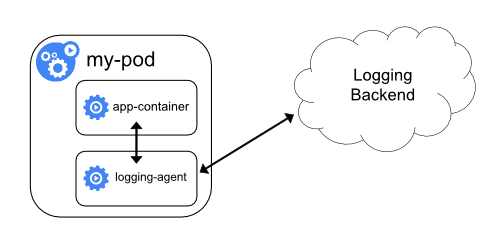
In this example, logs are pushed directly from a container that lives inside of the pod. This can take the form of the “sidecar” pattern, or the logs can be pushed directly from the “app-container”. This method offers a high degree of flexibility, enabling application-specific configuration for each stream of logs that you’re collecting. The trade-off here, however, is repetition. You’re solving the problem once for a single app, not everywhere.
Collected Asynchronously
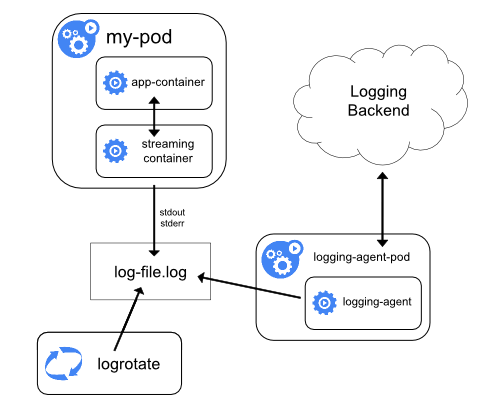
The other common approach is to read the logs directly from the server, using an entirely external pod. This pod will aggregate logs for the entire server, ingesting and collecting everything once. This can either be implemented using the somewhat unknown static pod, or more commonly, using the DaemonSet. Here, we take more of a platform view of the problem, ingesting logs for every pod on the server, or in the case of the DaemonSet, every server in the cluster. Alas, we sacrifice the vital flexibility that the previous pattern afforded us.
Types of Kubernetes Logs
Kubernetes is itself software that needs to be monitored. It is tempting to only consider your application logs when you’re monitoring your system, but this would only give you part of the picture. At the simplest level, your application is pushing out log information to standard output.
Your application is running on a node, however, and it is also crucial that these logs are harvested. Misbehavior in your node logs may be the early warning you need that a node is about to die and your applications are about to become unresponsive.
On each of your nodes, there is a kubelet running that acts as sheriff of that server, alongside your container runtime, most commonly Docker. These can not be captured using typical methods since they do not run within the Kubernetes framework but are a part of it.
A crucial and often ignored set of logs are HTTP access logs. It is common practice in a Kubernetes cluster to have a single ingress controller through which all of the inbound cluster traffic flows. This creates a single swimlane that needs to be tightly monitored. Fortunately, these logs are represented as pod logs and can be ingested in much the same way.
Alongside this, there are nodes that are running your control plane components. These components are responsible for the orchestration and management of all of your services. The logs that are generated here include audit logs, OS system level logs, and events. Audit logs are especially important for troubleshooting, to provide a global understanding of the changes that are being applied to your cluster.
Collecting Kubernetes Logs
Log collection in Kubernetes comes in a few different flavors. There is the bare basic solution, offered by Kubernetes out of the box. From there, the road forks and we can take lots of different directions with our software. We will cover the most common approaches, with code and Kubernetes YAML snippets that go from a clear cluster to a well oiled, log collecting machine.
The Basic Approach to Kubernetes Logging
In order to see some logs, we’ll need to deploy an application into our cluster. To keep things simple, we’ll run a basic busybox container with a command to push out one log message a second. This will require some YAML, so first, save the following to a file named busybox.yaml.
apiVersion: v1
kind: Pod
metadata:
 name: counter
spec:
 containers:
 - name: count
   image: busybox
   args: [/bin/sh, -c,
           'i=0; while true; do echo "$i: Hello"; i=$((i+1)); sleep 1; done']
Then, run the following command to deploy this container into your cluster. If you wish to deploy into a specific namespace, be sure to specify it in your command.
kubectl apply -f busybox.yaml
This should deploy almost instantly into your cluster. Reading the logs is then simple:
kubectl logs counter
You should see output that looks something like this:
1: Hello
2: Hello
3: Hello
4: Hello
5: Hello
6: Hello
7: Hello
8: Hello
9: Hello
10: Hello
11: Hello
So what can we do with this?
The standard logging tools within Kubernetes are not production-ready, but that’s not to say they’re lacking in every feature. To see these logs in real-time, a simple switch can be applied to your previous command:
kubectl logs counter -f
The -f switch instructs the CLI to follow the logs, however, it has some limitations. For example, you can’t tail the logs from multiple containers at once. We can also see logs after a given time, using the following command:
kubectl logs counter --since-time=2020-05-10T09:00:00Z
But if the pod disappears or crashes?
Let’s test out how well our logs hold up in an error scenario. First, let’s delete the pod.
kubectl delete -f busybox.yaml
Now let’s try to get those logs again, using the same command as before.
Error from server (NotFound): pods "counter" not found
The logs are no longer accessible because the pod has been destroyed. This gives us some insight into the volatility of the basic Kubernetes log storage. Let’s amend our busybox so that it has trouble starting up.
apiVersion: v1
kind: Pod
metadata:
name: counter
labels:
   app: counter
spec:
containers:
- name: count
  image: busybox
  args: [/bin/sh, -c,
          'invalid bash syntax']
If we query for the logs this time, we’ll get the logs from the last attempt. We won’t see all of the logs that the pod has printed out since it was deployed. This can be remedied with the -p switch, but we can see quickly that the tool becomes cumbersome with even the most basic of complications. If this were a 3 am, high impact outage, this CLI would quite quickly become a stumbling block. When combined with the volatility of the pod log storage, these examples betray the lack of sophistication in this tooling. Next, we’ll remedy these issues, step by step, by introducing some new concepts and upgrading the logging capabilities of our Kubernetes cluster.
Note: Before proceeding, you should delete the counter pod that you have just made and revert it to the fully working version.
Kubernetes Logging Agent
Logging agents the middlemen of log collection. There is an application that is writing logs and a log collection stack, such as Elasticsearch Kibana Logstash that is analyzing and rendering those logs. Something needs to get the logs from A to B. This is the job of the logging agent.
The advantage of the logging agent is that it decouples this responsibility from the application itself. Instead of having to continuously write boilerplate code for your application, you simply attach a logging agent and watch the magic happen. However, as we will see, this reuse comes at a price, and sometimes, the application-level collection is the best way forward.
Prerequisites
Before proceeding, you should have an Elasticsearch server and a Kibana server that is communicating with one another. This can either be hosted on a cloud provider or, for the purposes of a tutorial, ran locally. If you wish to run them locally, the following file can be used with docker compose to spin up your very own instances:
version: '3'

services:
 elasticsearch:
   image: docker.elastic.co/elasticsearch/elasticsearch:7.6.2
   environment:
     - cluster.name=docker-cluster
     - discovery.type=single-node
     - bootstrap.memory_lock=true
     - "ES_JAVA_OPTS=-Xms512m -Xmx512m"
   ulimits:
     memlock:
       soft: -1
       hard: -1
   ports:
     - "9200:9200"
 kibana:
   image: docker.elastic.co/kibana/kibana:7.6.2
   ports:
     - "5601:5601"
Write this to a file named docker-compose.yaml and run the following command from the same directory to bring up your new log collection servers:
docker-compose up
They will take some time to spin up, but once they’re in place, you should be able to navigate to https://localhost:5061 and see your fresh Kibana server, ready to go. If you’re using Minikube with this setup (which is likely if Elasticsearch is running locally), you’ll need to know the bound host IP that minikube uses. To find this, run the following command:
minikube ssh "route -n | grep ^0.0.0.0 | awk '{ print $2 }'"
This will print out an IP address. This is the IP address of your Elasticsearch server. Keep a note of this, you’ll need it in the next few sections.
As a DaemonSet
This is our first step into a production-ready Kubernetes logging solution. Exciting! When we’ve made it through the following steps, we’ll have Fluentd collecting logs from the server itself and pushing them out to an Elasticsearch cluster that we can view in Kibana.
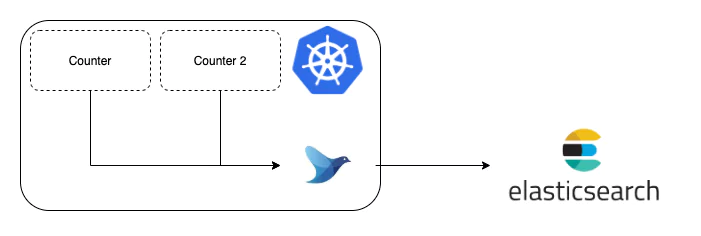
From YAML
Deploying raw YAML into a Kubernetes cluster is the tried and true method of deploying new software into your environment. It has the advantage of being explicit about the changes you’re about to make to your cluster. Firstly, we’ll need to define our DaemonSet. This will deploy one pod per node in our cluster. There are plenty of great examples and variations that you can play within the fluent github repository. For the sake of ease, we’ll pick a simple example to run with:
apiVersion: apps/v1
kind: DaemonSet
metadata:
 name: fluentd
 namespace: kube-system
 labels:
   k8s-app: fluentd-logging
   version: v1
spec:
 selector:
   matchLabels:
     k8s-app: fluentd-logging
     version: v1
 template:
   metadata:
     labels:
       k8s-app: fluentd-logging # This label will help group your daemonset pods
       version: v1
   spec:
     tolerations:
     - key: node-role.kubernetes.io/master
       effect: NoSchedule # This will ensure fluentd collects master logs too
     containers:
     - name: fluentd
       image: fluent/fluentd-kubernetes-daemonset:v1-debian-elasticsearch
       env:
         - name:  FLUENT_ELASTICSEARCH_HOST
           value: "localhost" # Or the host of your elasticsearch server
         - name:  FLUENT_ELASTICSEARCH_PORT
           value: "9200" # The port that your elasticsearch API is exposed on
         - name: FLUENT_ELASTICSEARCH_SCHEME
           value: "http" # Either HTTP or HTTPS.
         - name: FLUENT_ELASTICSEARCH_USER
           value: "elastic" # The username you've set up for elasticsearch
         - name: FLUENT_ELASTICSEARCH_PASSWORD
           value: "changeme" # The password you've got. These are the defaults.
       resources:
         limits:
           memory: 200Mi
         requests:
           cpu: 100m
           memory: 200Mi
       volumeMounts:
       - name: varlog
         mountPath: /var/log
       - name: varlibdockercontainers
         mountPath: /var/lib/docker/containers
         readOnly: true
     terminationGracePeriodSeconds: 30
     volumes:
     - name: varlog
       hostPath:
         path: /var/log
     - name: varlibdockercontainers
       hostPath:
         path: /var/lib/docker/containers
Save this to a file named fluentd-daemonset.yaml and deploy it to your cluster using the following command:
kubectl apply -f fluentd-daemonset.yaml
Then, you can monitor the pod status with the following command:
kubectl get pods -n kube-system
Eventually, you’ll see the pod become healthy and the entry in the list of pods will look like this:
fluentd-4d566 1/1 Running 0 2m22s
At this point, we’ve deployed a DaemonSet and we’ve pointed it at our Elasticsearch server. We now need to deploy our counter back into the cluster.
kubectl apply -f busybox.yaml
From here, we can see what our cluster is pushing out. Open up your browser and navigate to https://localhost:5601. You should see a dashboard and on the left-hand side, a menu. The discover icon is a compass and it’s the first one on the list. Click on that and you’ll be taken to a page, listing out your indices.
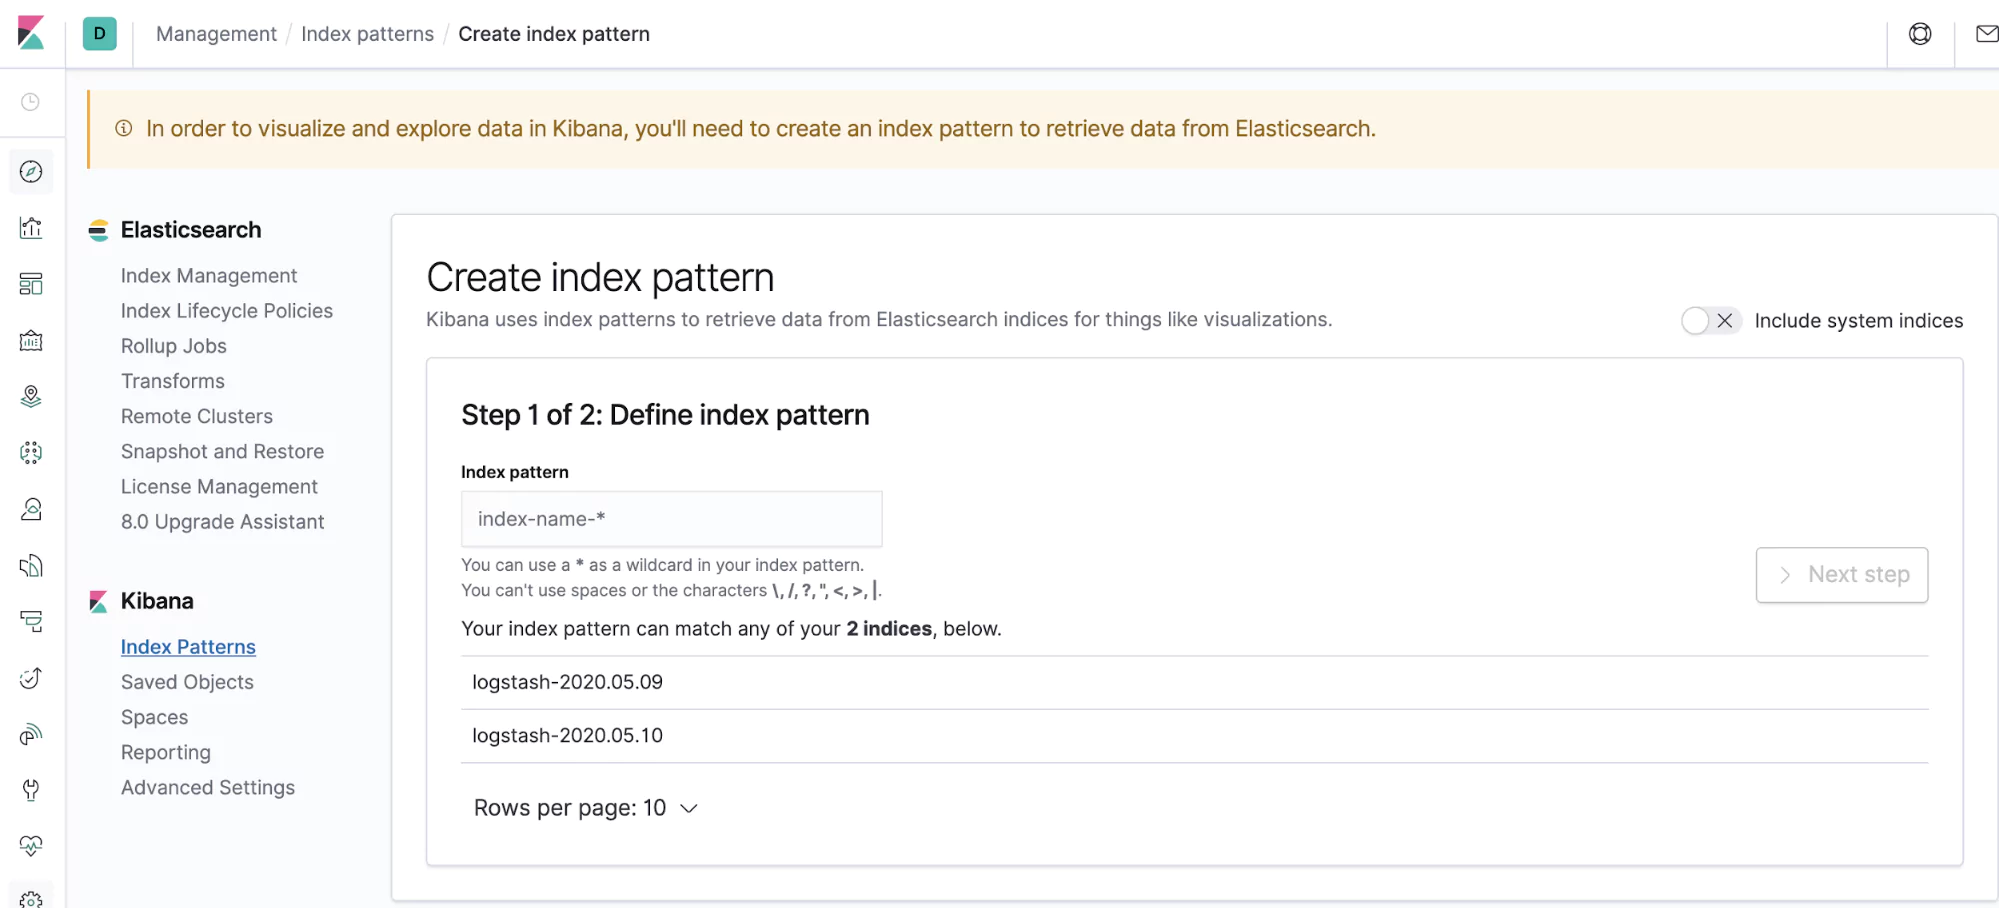
Here, you’ll need to create an index pattern. An index pattern simply groups indices together. You can see that Fluentd has kindly followed a Logstash format for you, so create the index logstash-* to capture the logs coming out from your cluster.
In the next window, select @timestamp as your time filter field. You’ll notice that you didn’t need to put this in your application logs, Fluentd docker did this for you! You’ve just gained a really great benefit from Fluentd. Your application didn’t care about its log format. Your logging agent just captured that and made it compatible, without any extra effort from you.
Create your index pattern and let’s explore the next screen a little bit. You’ll notice that there are lots of fields in this index. That’s because Fluentd didn’t just add a @timestamp for you, it also added a bunch of extra fields that you can use as dimensions on which to query your logs.
One example is kubernetes.pod_name. We’re now going to use this to hunt down the logs from our counter app, which is faithfully running in the background. Head back to the discover screen (the compass icon on the left) and in the search bar at the top of the screen, enter the following:
kubernetes.pod_name.keyword: counter
The logs from your counter application should spring up on the screen.
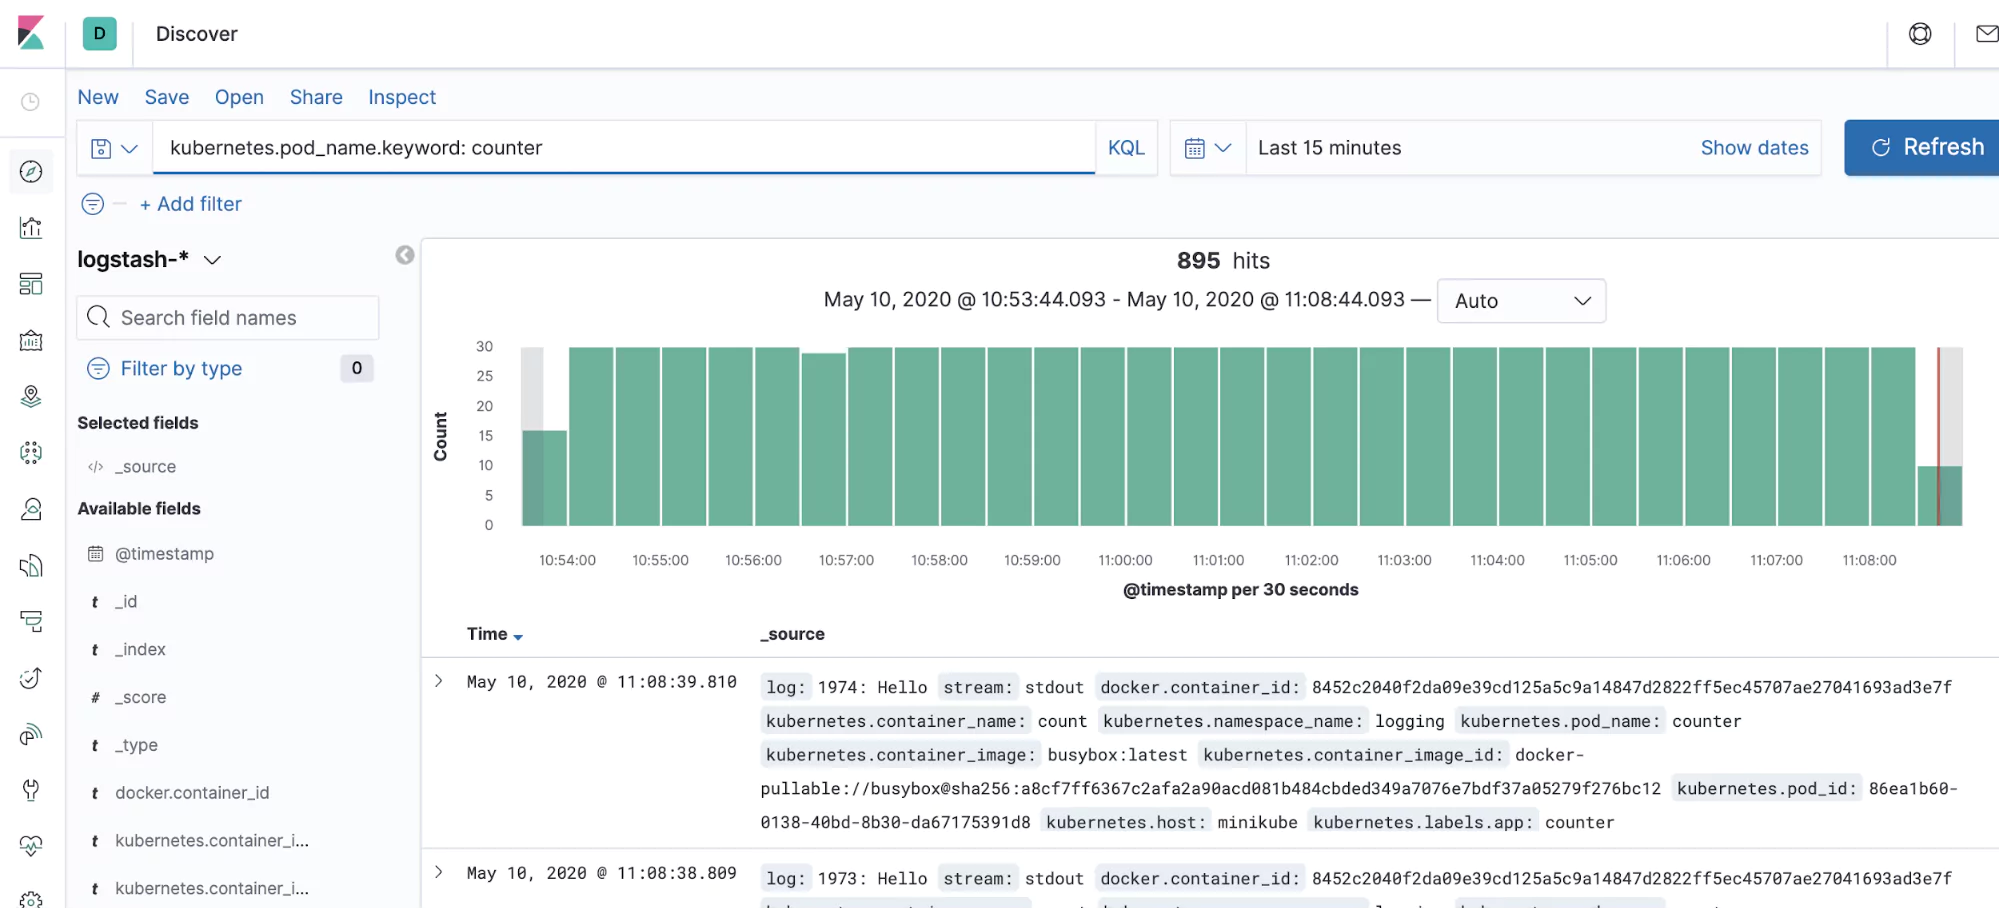
So thanks to your clever use of Fluentd, you’ve just taken your cluster from volatile, unstable log storage, all the way through to external, reliable and very searchable log storage. We can even visualize our logs, using the power of Kibana:
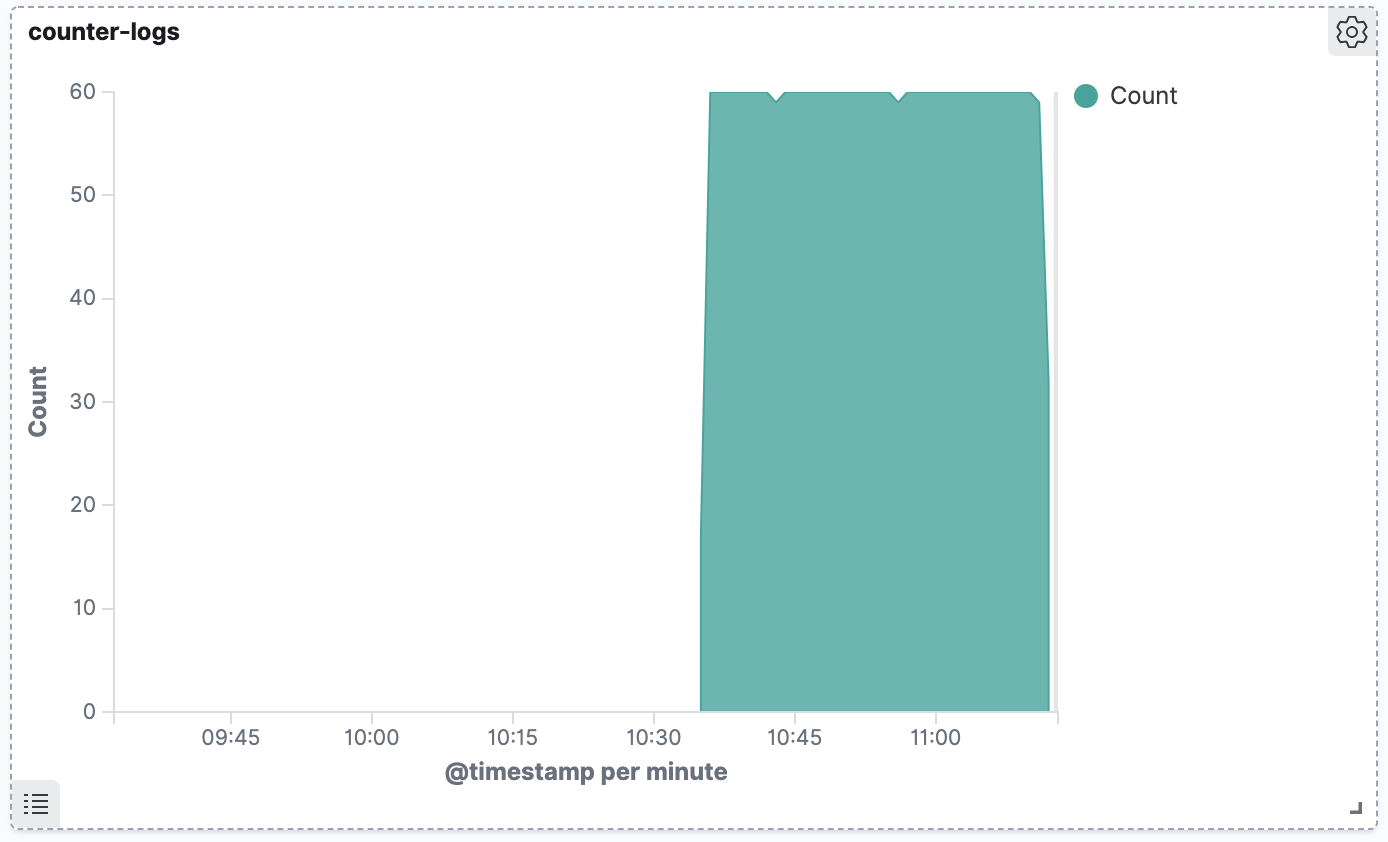
Explore these labels, they are immensely powerful and require no configuration. You can query all sorts of dimensions, such as namespace or host server. If you like the open source Kibana but need ML-powered alerting, tools like Coralogix offer an even greater level of sophistication that can help you get the most of your K8s log data.
From Helm
Helm hides away much of the complex YAML that you find yourself stuck with when rolling out changes to a Kubernetes cluster. Instead of a complex list of different resources, Helm provides production-ready deployments with a single configuration file to tweak the parameters you want. First, let’s remove our DaemonSet from Kubernetes. Don’t worry, because we have the YAML file, we can reinstall it whenever we want.
kubectl delete -f fluentd-daemonset.yaml
Next, we’ll create our very own fluentd-daemonset-values.yaml file. This values file contains the configuration that we can use for a Helm chart. Paste in the following values:
elasticsearch:
   hosts: ["10.0.2.2:9200"]
Then, you’ve got two commands to run. The first links up to your local Helm CLI with the repository that holds the Fluentd Helm chart:
helm repo add kiwigrid https://kiwigrid.github.io
The next one will actually install Fluentd into your cluster. You’re going to notice a lot more resources are created. This is the power of Helm – abstracting away all of the inner details of your deployment, in much the same way that Maven or NPM operates. Our first example got something working, but this Helm chart will include many production-ready configurations, such as RBAC permissions to prevent your pods from being deployed with god powers.
helm install fluentd-logging kiwigrid/fluentd-elasticsearch -f fluentd-daemonset-values.yaml
This command is a little longer, but it’s quite straight forward. We’re instructing Helm to create a new installation, fluentd-logging, and we’re telling it the chart to use, kiwigrid/fluentd-elasticsearch. Finally, we’re telling it to use our configuration file in which we have specified the location of our Elasticsearch cluster. Navigate back to Kibana and logs have started flowing again.
But there are no credentials!
The Helm chart assumes an unauthenticated Elasticsearch by default. While this sounds crazy, if the Elasticsearch instance is hidden behind networking rules, many organizations deem this secure enough. However, we’ll do the job properly and finish this off. We first need to create a secret to hold our credentials. My secret is using the default Elasticsearch credentials, but you can craft yours as needed – the key part is to keep the keys and secret names the same. Create a file named credentials-secret.yaml and paste this inside:
apiVersion: v1
kind: Secret
metadata:
 name: es-credentials
type: Opaque
data:
 ES_USERNAME: ZWxhc3RpYw==
 ES_PASSWORD: Y2hhbmdlbWU=
Deploy that to the cluster with the following command:
kubectl apply -f credentials-secret.yaml
And now you’ll need to update your fluentd-daemonset-values.yaml file to look something like this:
secret:
   - name: FLUENT_ELASTICSEARCH_USER
     secret_name: es-credentials
     secret_key: ES_USERNAME
   - name: FLUENT_ELASTICSEARCH_PASSWORD
     secret_name: es-credentials
     secret_key: ES_PASSWORD
elasticsearch:
   hosts: ["10.0.2.2:9200"]
   auth:
       enabled: true
You’ll see now that the file is referring out to an existing secret, rather than holding credentials in plaintext (or, not at all, like before). Additionally, authentication has now been enabled in the Helm chart. This means your Fluentd instance is now communicating with your Elasticsearch using a username and password.
The advantage of a DaemonSet
So now you’ve got your logs, but there is another perk that we haven’t touched on yet. That is the power of a DaemonSet. From now on, any new pod on every server is going to be aggregated. We can test this. Create a new file, busybox-2.yaml and add the following content to it:
apiVersion: v1
kind: Pod
metadata:
name: counter-2
labels:
   app: counter-2
spec:
containers:
- name: count
  image: busybox
  args: [/bin/sh, -c,
          'i=0; while true; do echo "$i: Hello from pod 2"; i=$((i+1)); sleep 1; done']
Run the following command to deploy this new counter into our cluster:
kubectl apply -f busybox-2.yaml
That’s it. Head back to your Kibana instance and, this time, search for logs coming from the default namespace:
kubernetes.namespace_name.keyword: "default"
And you’ll see logs from both of your pods. No additional configuration or work needed. Your app started logging and Fluentd started collecting. Now imagine if you’ve got servers spinning up and closing down every hour, hundreds of nodes popping in and out of service. This creates a very scalable model for collecting logs.
This is a very powerful tool, but that automatic log collection creates complications. Sooner or later, a special case will pop up. Even the best rules have exceptions, and without a provision to put special cases into your cluster, you’re likely to run into some trouble. You’ll need a second option. For this, we can implement a sidecar.
As a SideCar
Sidecars have fallen out of favor of late. You will still find examples of them floating around but the ease and scalability of DaemonSets have continually won out. A sidecar pod is often a wasteful allocation of resources, effectively doubling the number of pods that your cluster needs to run, in order to surface the logs.
There are some edge cases for using a sidecar. For example, some open-source software will not write to standard out but instead to a local file. This file needs to be picked up and handled separately.
Yet, even this can be restricting. Dynamic properties on logs, small optimizations, computed fields. Sometimes, our logging logic can become so complex that we need access to a much more sophisticated programming capability. As our last port of call, we can bring everything up to the application level.
Push logs directly to a backend from within an application.
Application-level logging is rapidly falling out of favor, especially in Kubernetes clusters. It is recommended to try and keep as much of this logic out of your application code as possible so that your code most succinctly reflects the business problems that you are trying to solve.
It is very difficult to write a tutorial for this since it highly depends on the application level code you’re writing, so instead, it is best to give a few common problems and challenges to look out for:
- Separation of concerns is crucial here. You do not want your business logic polluted with random invocations of the Elasticsearch API. Instead, abstract this behind a service and try to make some semantic method names that describe what you’re doing.
- Rate limiting from the Elasticsearch API will happen if your application is too busy. Many libraries offer automatic retry functionality, but this can often make things worse. Error handling, retry and exponential back-off logic will become crucial at scale.
- Backing up log messages during an Elasticsearch outage is vital. Backfilling log messages that are held on disk creates a property of eventual consistency with your logs, which is far superior to large gaps in important information, such as audit data.
These problems are covered for you by bringing in a logging agent and should be strongly considered over including such low-level detail in your application code. The aim should be to solve the problem once for everything and we should pathologically avoid reinventing the wheel.
Transforming your Logs
Logs are an incredibly flexible method of producing information about the state of your system. Alas, with flexibility comes the room for error and this needs to be accounted for. We can filter out specific fields from our application logs, or we can add additional tags that we’d like to include in our log messages.
By including these transformations in our logging agents, we are once again abstracting low-level details from our application code and creating a much more pleasant codebase to work with. Let’s update our fluentd-daemonset-values.yaml to overwrite the input configuration. You’ll notice that this increases the size of the file quite a bit. This is an unfortunate side effect of using the Helm chart, but it is still one of the easiest ways to make this change in an automated way:
elasticsearch:
hosts: ["10.0.2.2:9200"]
configMaps:
useDefaults:
containersInputConf: false
extraConfigMaps:
containers.input.conf: |-
@id fluentd-containers.log
@type tail
path /var/log/containers/*.log
pos_file /var/log/containers.log.pos
tag raw.kubernetes.*
read_from_head true
@type multi_format
format json
time_key time
time_format %Y-%m-%dT%H:%M:%S.%NZ
format /^(?
# Detect exceptions in the log output and forward them as one log entry.
@id raw.kubernetes
@type detect_exceptions
remove_tag_prefix raw
message log
stream stream
multiline_flush_interval 5
max_bytes 500000
max_lines 1000
# Concatenate multi-line logs
@id filter_concat
@type concat
key message
multiline_end_regexp /n$/
separator ""
timeout_label @NORMAL
flush_interval 5
# Enriches records with Kubernetes metadata
@id filter_kubernetes_metadata
@type kubernetes_metadata
# This is what we've added in. The rest is default.
@type record_transformer
hello "world"
# Fixes json fields in Elasticsearch
@id filter_parser
@type parser
key_name log
reserve_time true
reserve_data true
remove_key_name_field true
@type multi_format
format json
format none
Install your Fluentd Helm chart again:
helm install Fluentd-logging kiwigrid/fluentd-elasticsearch -f fluentd-daemonset-values.yaml
Now go to Elasticsearch and look for the logs from your counter app one more time. If you inspect one of the documents, you should see a brand new field.

Notice the exclamation mark next to world there? That means the field has not been indexed and you won’t be able to search on it yet. Navigate to the settings section (the cog in the bottom left of the page) and bring up your Logstash index that you created before.
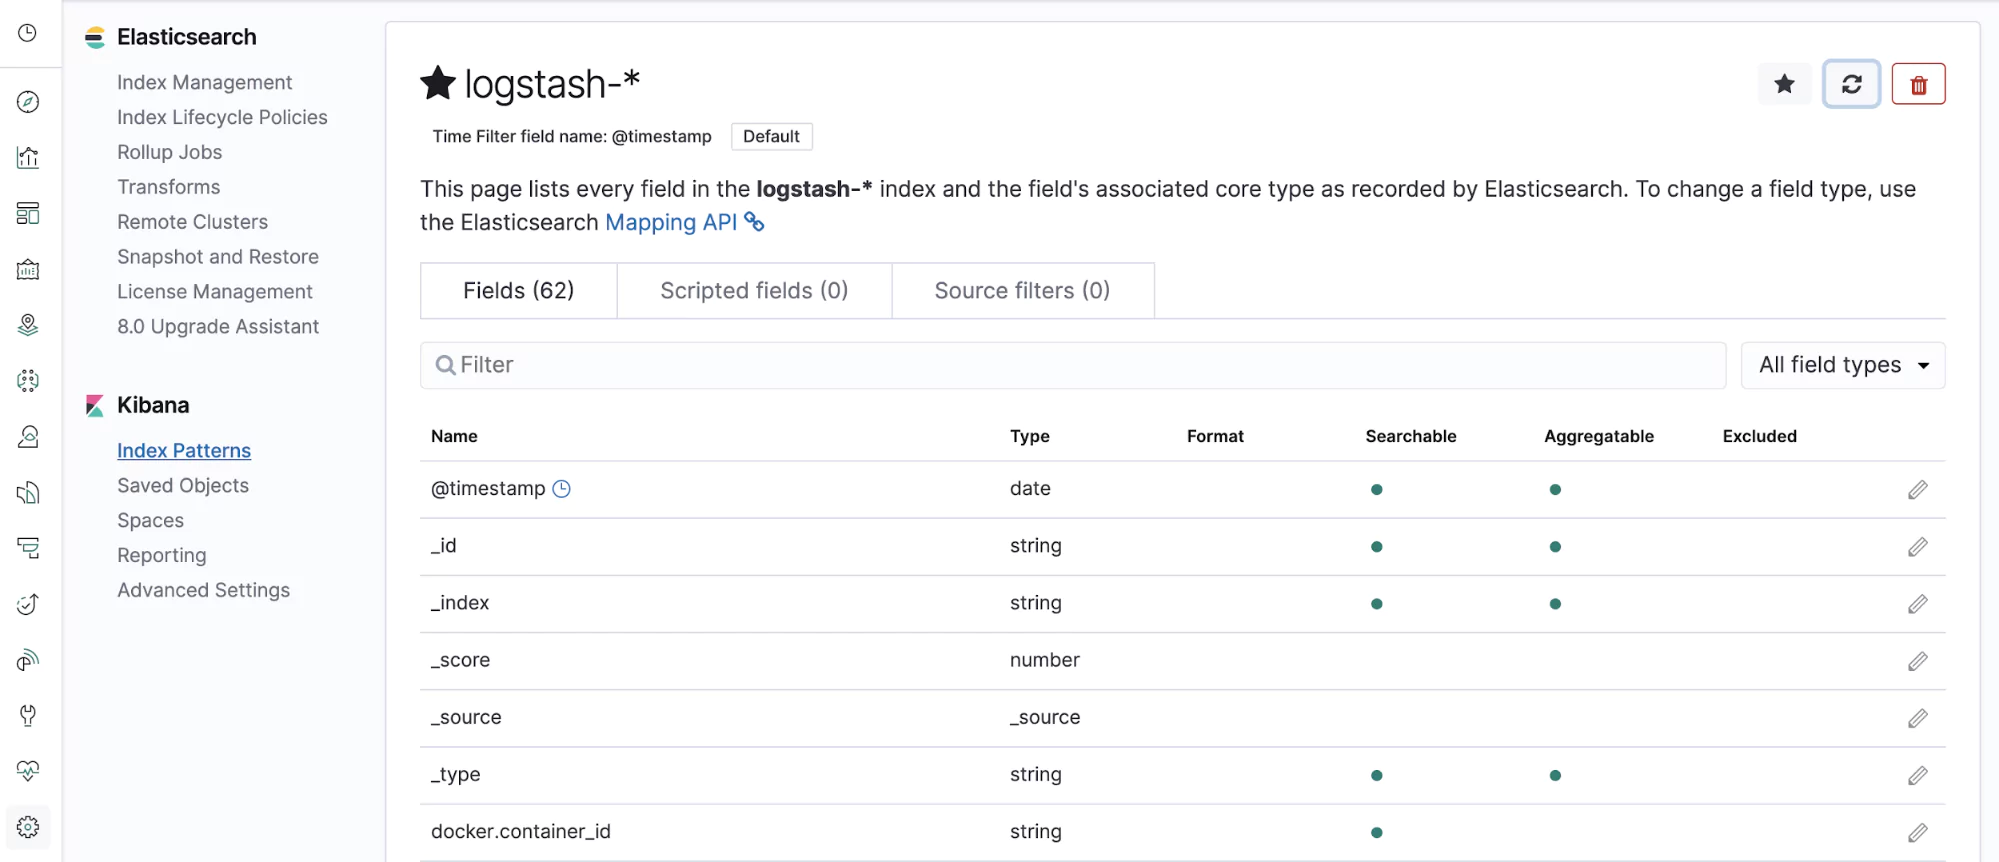
In the top left, we can see the refresh icon. This button will automatically index new fields that are found on our logs. Click this and confirm. If you search for your new field, it should appear in the search result:
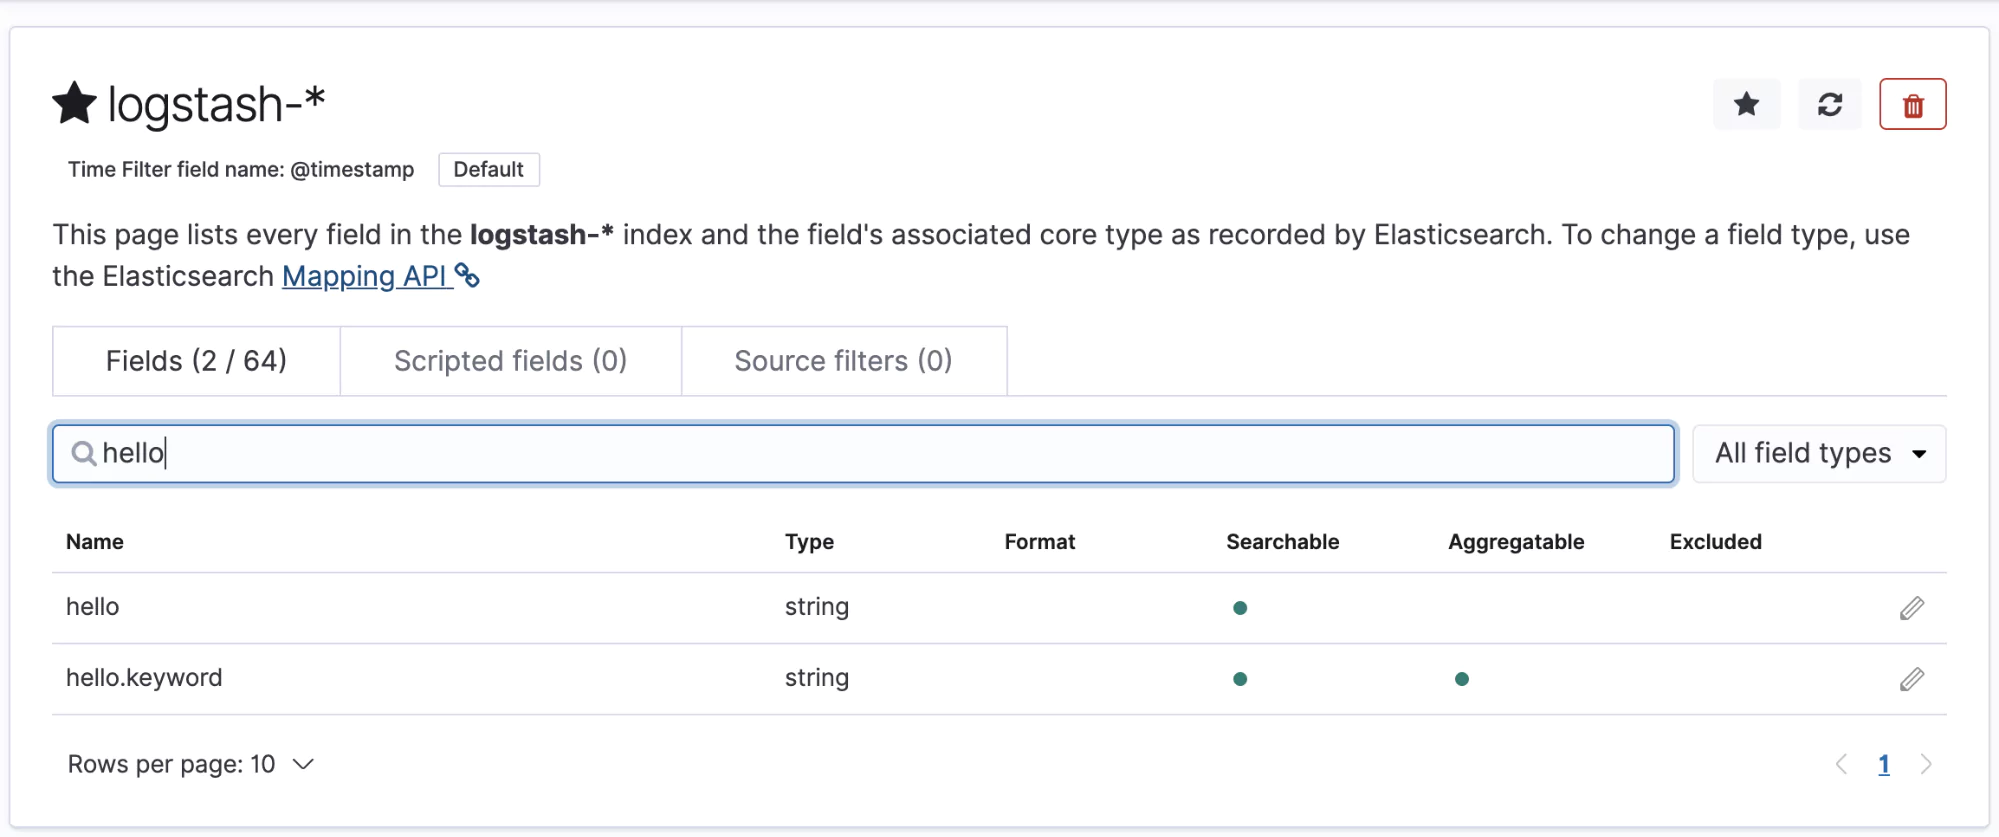
This is a very basic feature but it illustrates the power of this mechanism. We could, for example, remove the password field from any logs, or we could delete any logs that contain the word password. This creates a basic layer of security on which your applications can sit and further reduces the worries of the engineers who are building the application code.
A word of warning
To make even a small change to the Fluentd config, as you have seen, requires a much more complex values file for your Helm chart. The more logic that you push into this file, the more complex and unmaintainable this file is going to become. There are a few things you can do to mitigate this, such as merging multiple Helm values files, but it is something of a losing battle. Use this functionality sparingly and when it is most effective, to maintain a balance between a sophisticated log configuration and a complex, hidden layer of rules that can sometimes mean mysteriously lost logs or missing fields.
Helm or simple YAML?
At scale, almost all major Kubernetes clusters end up abstracting the raw YAML in one way or another. It simply doesn’t work to have hundreds of YAML files that are floating about in the ether. The temptation to copy and paste, often spreading the same errors across dozens of files, is far too strong.
Helm is one way of abstracting the YAML files behind a Helm chart and it certainly makes for a more straightforward user experience. There are some other games in town, such as FluxCD, that can offer a similar service (and quite a bit more), so investigate the various options that are at your disposal.
The question comes down to scale and maintainability. If you expect more and more complexity, it’s wise to start baking in scalability into your solutions now. If you’re confident that things are going to remain simple, don’t over-invest. Helm is great but it comes with its own complexities, such as very specific upgrade and rollback rules.
Working Examples
So now we’ve got some logs flowing into our Elasticsearch cluster. What can we do with them? Here, we’ll work through some examples of how we can use the logs to fulfill some common requirements.
Monitoring ETCD
ETCD is the distributed database that underpins Kubernetes. It often works behind the scenes and many organizations that are making great use of Kubernetes are not monitoring their ETCD databases to ensure nothing untoward is happening. We can prevent this with a bit of basic monitoring, for example, tracking the frequency of ETCD compaction.
Compaction of its keyspace is something that ETCD does at regular intervals to ensure that it can maintain performance. We can easily use the logs as the engine behind our monitoring for this functionality. Navigate into Elasticsearch and click on the Visualise button on the left-hand side of the screen.
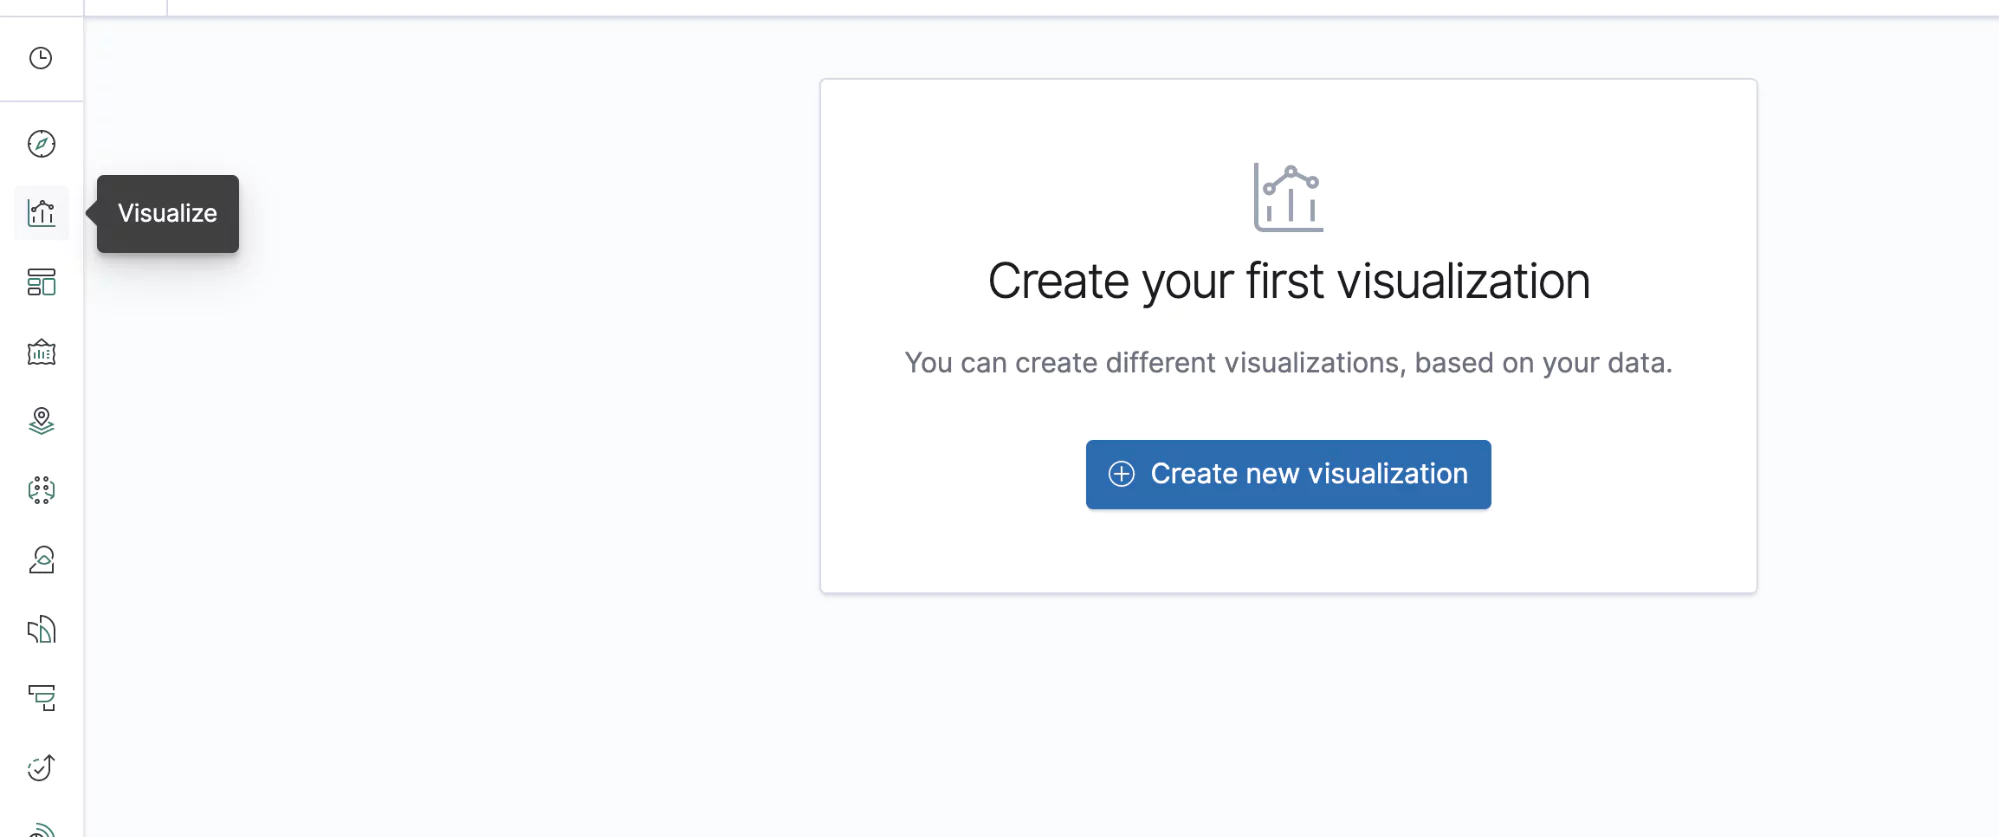
Create a new visualization, select your Logstash index, and add the following into the search bar at the top of the query. This is Lucene syntax and it will pull out the logs that indicate a successful run of the ETCD scheduled compaction:
kubernetes.labels.component.keyword: "etcd" and message.keyword: *finished scheduled compaction*
Next, on the left-hand side, we’ll need to add a new X-axis to our graph.
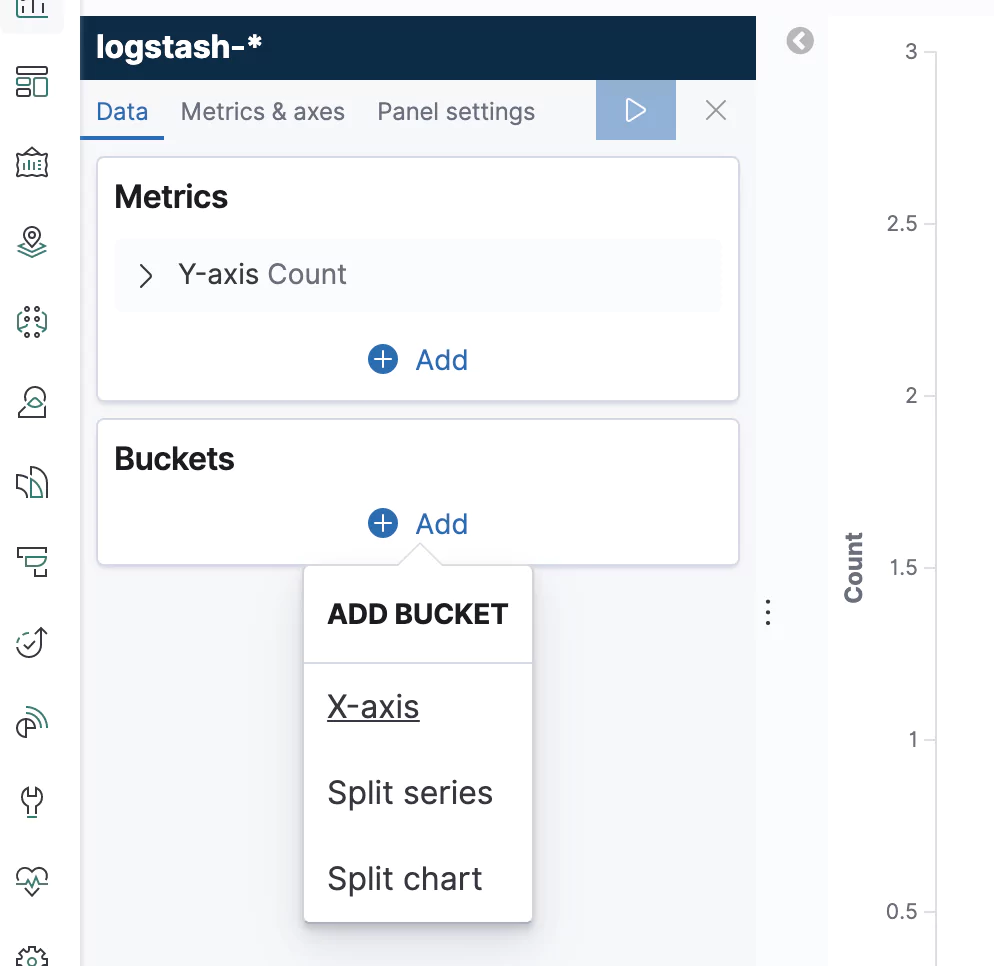
Click on X-axis and select the Date Histogram option. Elasticsearch will automatically select the @timestamp field for you. Simply click on the blue Run button just above and you should see a lovely, saw-tooth shape in your graph:
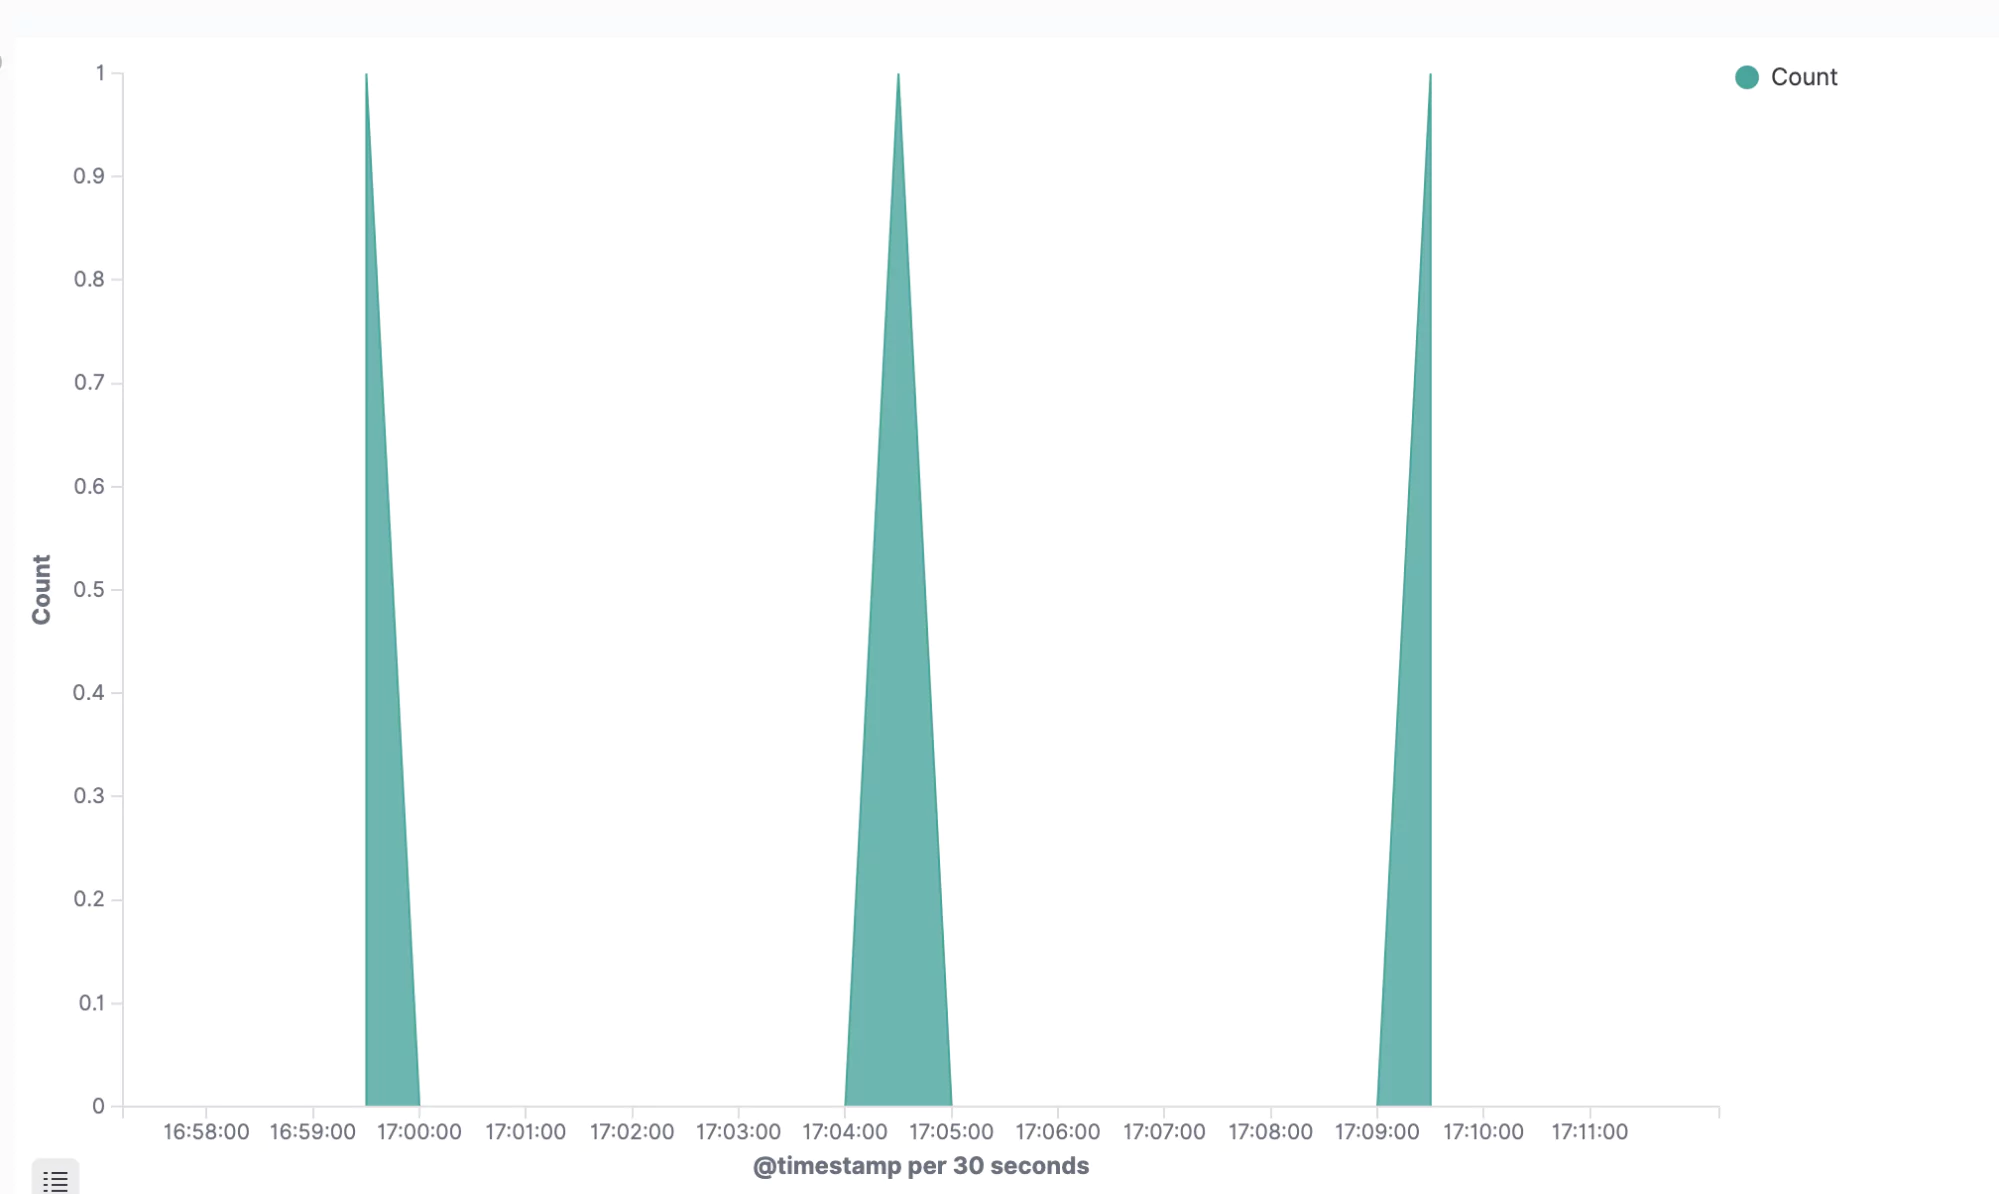
This is a powerful insight into a low-level process that would normally go hidden. We could use this and many other graphs like it to form a full, ETCD monitoring board, driven by the many different log messages that we’re ingesting from ETCD.
Maintenance
Okay, so you have your logs, but how do you prune them down? How do you decide how long to keep those logs for? We’ll iron out these weaknesses and add the finishing touches to your log collection solution and we’ll do this in the same production-quality, the secure way we’ve been doing everything else. No corners cut.
Log Pruning
This is a problem as old as logging itself. As soon as you’re bringing all of those logs into one place, be it a file on a server or a time-series database like Elasticsearch, you’re going to run out of space sooner or later. There needs to be a decision on how long you keep those logs for and what to do with them when you’re done.
Elasticsearch Curator
The simple answer is to clear out old logs. A typical period to hold onto logs is a few weeks, although given some of your constraints, you might want to retain them for longer. Elasticsearch can hold huge volumes of data, but even such a highly optimized tool has its limits. Thanks to Kubernetes and Helm, deploying your curator is trivial.
First, let’s create ourselves a YAML file, curator-values.yaml and put the following content inside:
configMaps:
   config_yml: |-
       ---
       client:
       hosts:
           - 10.0.2.2 # Or the IP of your elasticsearch cluster.
       port: 9200
       http_auth: elastic:changeme # These are default. Set to your own.
   action_file_yml: |-
       ---
       actions:
           1:
           action: delete_indices
           description: "Clean up ES by deleting old indices"
           options:
               timeout_override:
               continue_if_exception: False
               disable_action: False
               ignore_empty_list: True
           filters:
           - filtertype: age
               source: name
               direction: older
               timestring: '%Y.%m.%d'
               unit: days
               unit_count: 7
               field:
               stats_result:
               epoch:
               exclude: False
This contains some important details. We can see in the config_yml property that we’re setting up the host and the credentials. Those of you who are security-minded will be glaring at the plaintext username and password, but not to worry, we’ll fix that in a moment.
The filters section is where the action is. This will delete indices in Elasticsearch that are older than 7 days, effectively meaning that you always have a week of logs available to you. For systems of a sufficient scale, this is a great deal of information. If you need more, it might be worth investigating some managed ELK options that take some of the headaches away for you.
Deploying this is the same as any other Helm chart:
helm install curator stable/elasticsearch-curator -f curator-values.yaml
You can then view the CronJob pod in your Kubernetes cluster.
NAME                            SCHEDULE    SUSPEND   ACTIVE   LAST SCHEDULE   AGE
curator-elasticsearch-curator   0 1 * * *   False     0                  33s
This job will run every day and clear out logs that are more than seven days old, giving you a sliding window of useful information that you can make use of.
Hiding those credentials
Our secret is in place from our previous work with Fluentd, so all you need to do is instruct the Helm chart to use this secret to populate some environment variables for you. To do this, you need to add a new property into the Helm chart envFromSecrets.
envFromSecrets:
   ES_USERNAME:
       from:
         secret: es-credentials
         key: 'ES_USERNAME'
   ES_PASSWORD:
       from:
         secret: es-credentials
         key: 'ES_PASSWORD'
This is a feature of the curator Helm chart that instructs it to read the value of an environment variable from the value stored in a given secret and you’ll notice the syntax is slightly different from the Fluentd helm chart. The functionality is much the same, but the implementation is subtly different.
Now, we’ve only got one more final step. We need to instruct Curator to read these environment variables into the config. To do this, replace the entire contents of your curator-values.yaml with the following:
envFromSecrets:
   ES_USERNAME:
       from:
         secret: es-credentials
         key: 'ES_USERNAME'
   ES_PASSWORD:
       from:
         secret: es-credentials
         key: 'ES_PASSWORD'
configMaps:
   config_yml: |-
       ---
       client:
         hosts:
           - 10.0.2.2
         port: 9200
         http_auth: ${ES_USERNAME}:${ES_PASSWORD}
   action_file_yml: |-
       ---
       actions:
           1:
           action: delete_indices
           description: "Clean up ES by deleting old indices"
             options:
               continue_if_exception: False
               disable_action: False
               ignore_empty_list: True
           filters:
           - filtertype: age
             source: name
             direction: older
             timestring: '%Y.%m.%d'
             unit: days
             unit_count: 7
             exclude: False
Now, the credentials don’t appear anywhere in this file. You can hide the secret file away somewhere else and control access to those secrets using RBAC.
Conclusion
Over the course of this article, we have stepped through the different approaches to pulling logs out of a Kubernetes cluster and rendering them in a malleable, queryable fashion. We have looked at the various problems that arise from not approaching this problem with a platform mindset and the power and scalability that you gain when you do.
Kubernetes is set to stay and, despite some of the weaknesses of its toolset, it is a truly remarkable framework in which to deploy and monitor your microservices. When combined with a sophisticated, flexible log collection solution, it becomes a force to be reckoned with. For a much smoother approach to Kubernetes logging, give Coralogix a spin and get all the (human) help you need 24/7 to manage your logs.


