Onelogin Log Insights with Coralogix


OneLogin is one of the top leading Unified Access Management platforms, enabling organizations to manage and Access their cloud applications in a secure way. OneLogin makes it simpler and safer for organizations to access the apps and data they need anytime, everywhere. This post will show you how Coralogix can provide analytics and insights for your OneLogin log data – including performance and security insights.
OneLogin Logs
OneLogin generates system events related to the authentication activity of your users and any actions made by them. The data provides an audit trail that helps you understand activities within your platforms. Each log event object describes a single logged action or “event” performed by a certain actor for a certain target and its result.
You can leverage this event data by using Coralogix alerts and dashboards to instantly detect problems and their root causes, spot malicious behavior, and get real-time notifications on any event you can define. Ultimately, this offers a better monitoring experience and more value out of your Auth0 data with minimal effort.
To connect your OneLogin logs with Coralogix you will first need to send your OneLogin events to Amazon EventBridge and route them to AWS CloudtTail and then, send them from CloudTrail to Coralogix with our predefined Lambda function.
OneLogin Dashboards
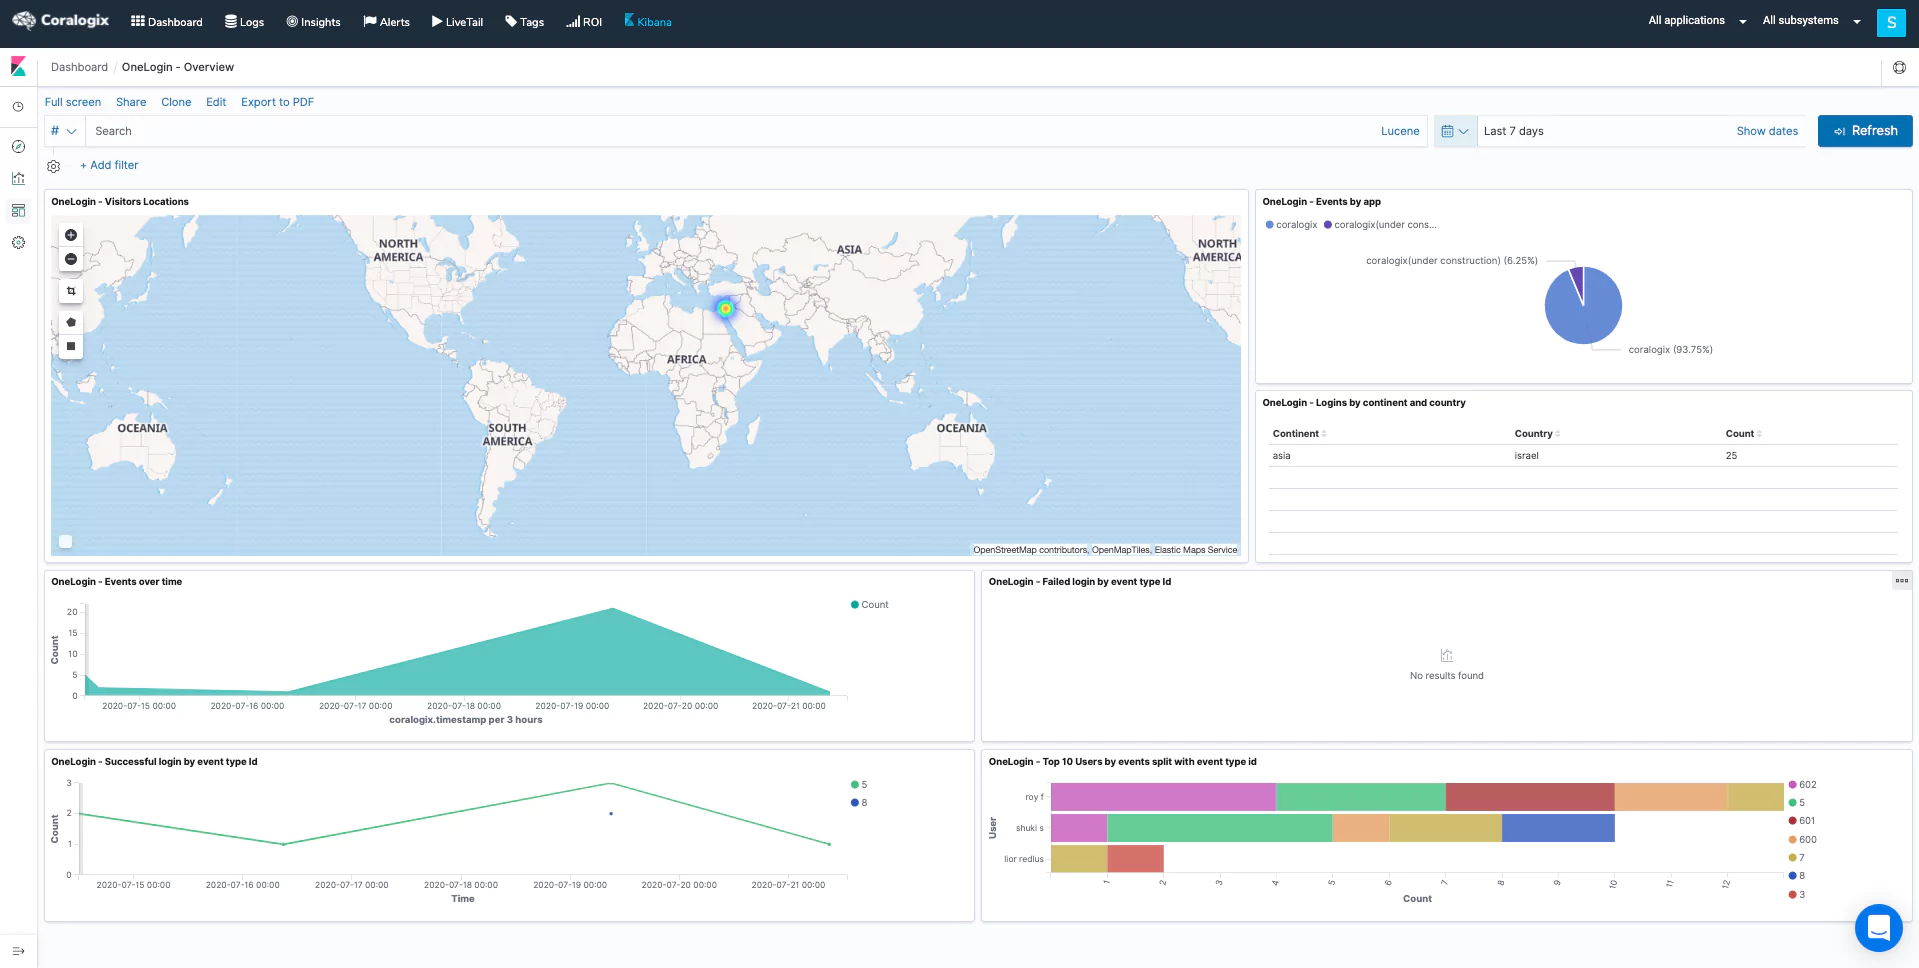
Here are a few examples of Kibana dashboards we created, using the OneLogin log data, Coralogix IP address GEO enrichment, and Elastic queries.
- Overview
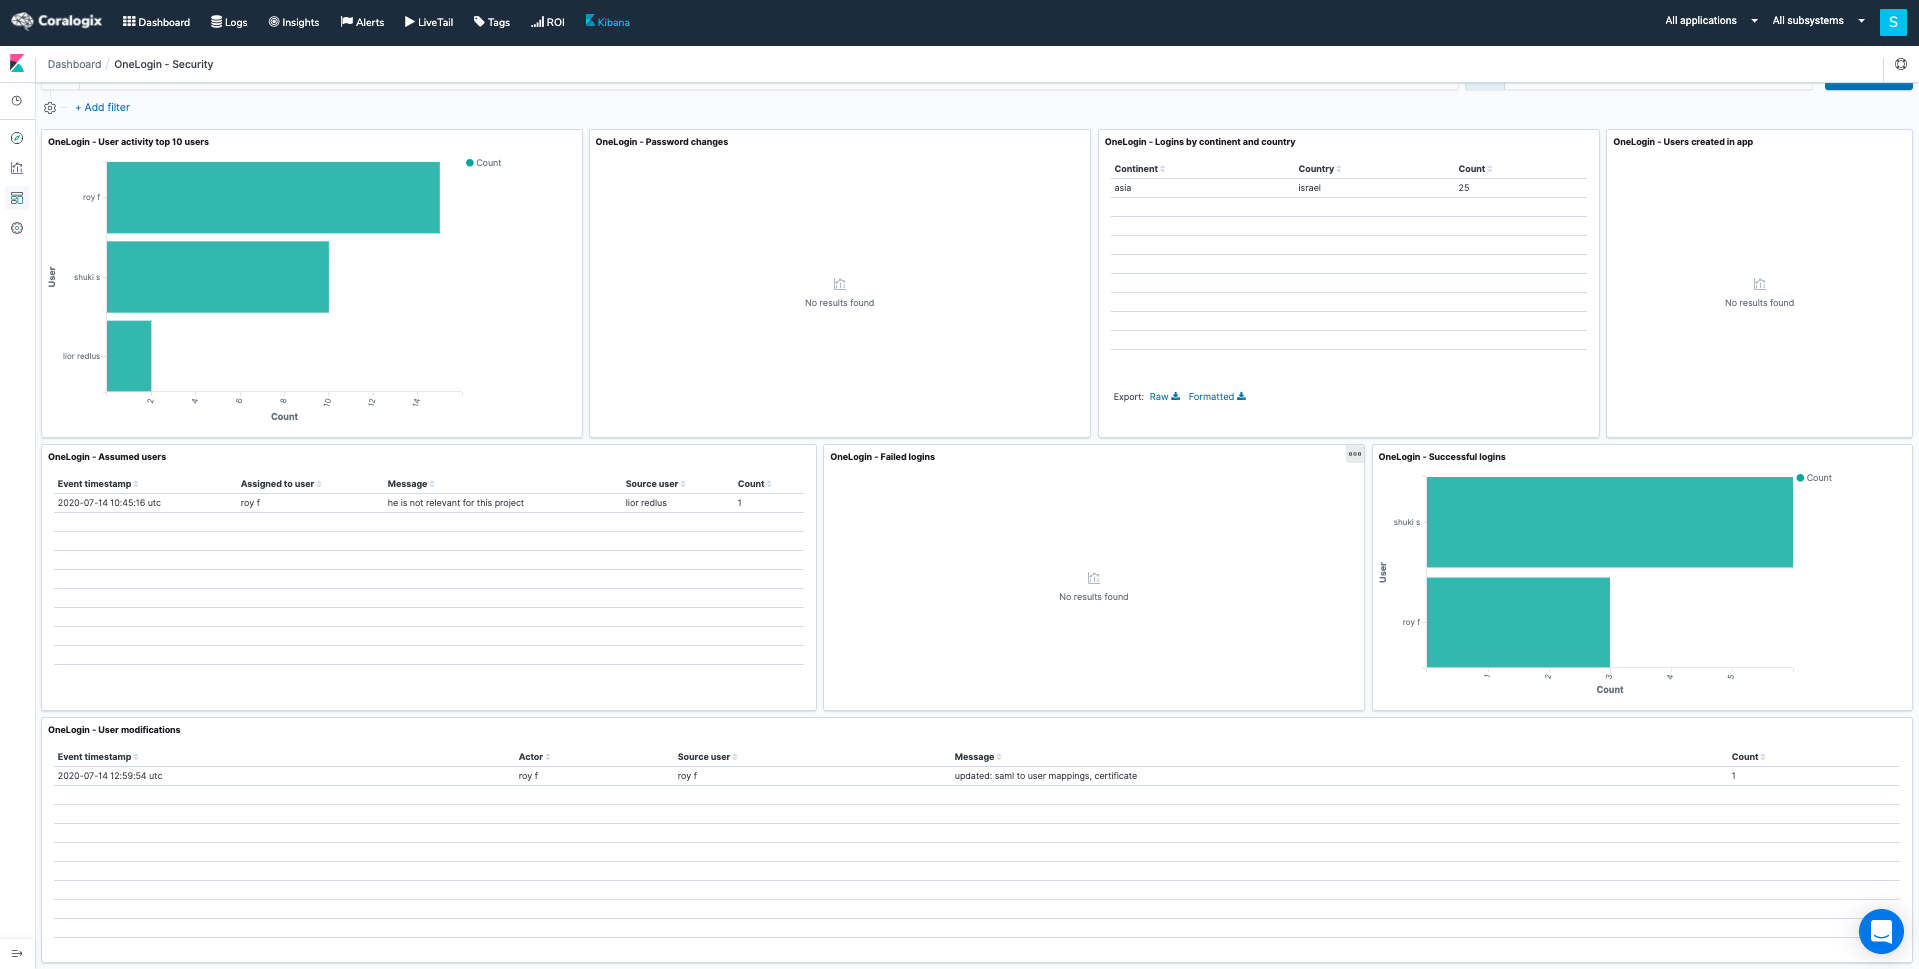
- Security
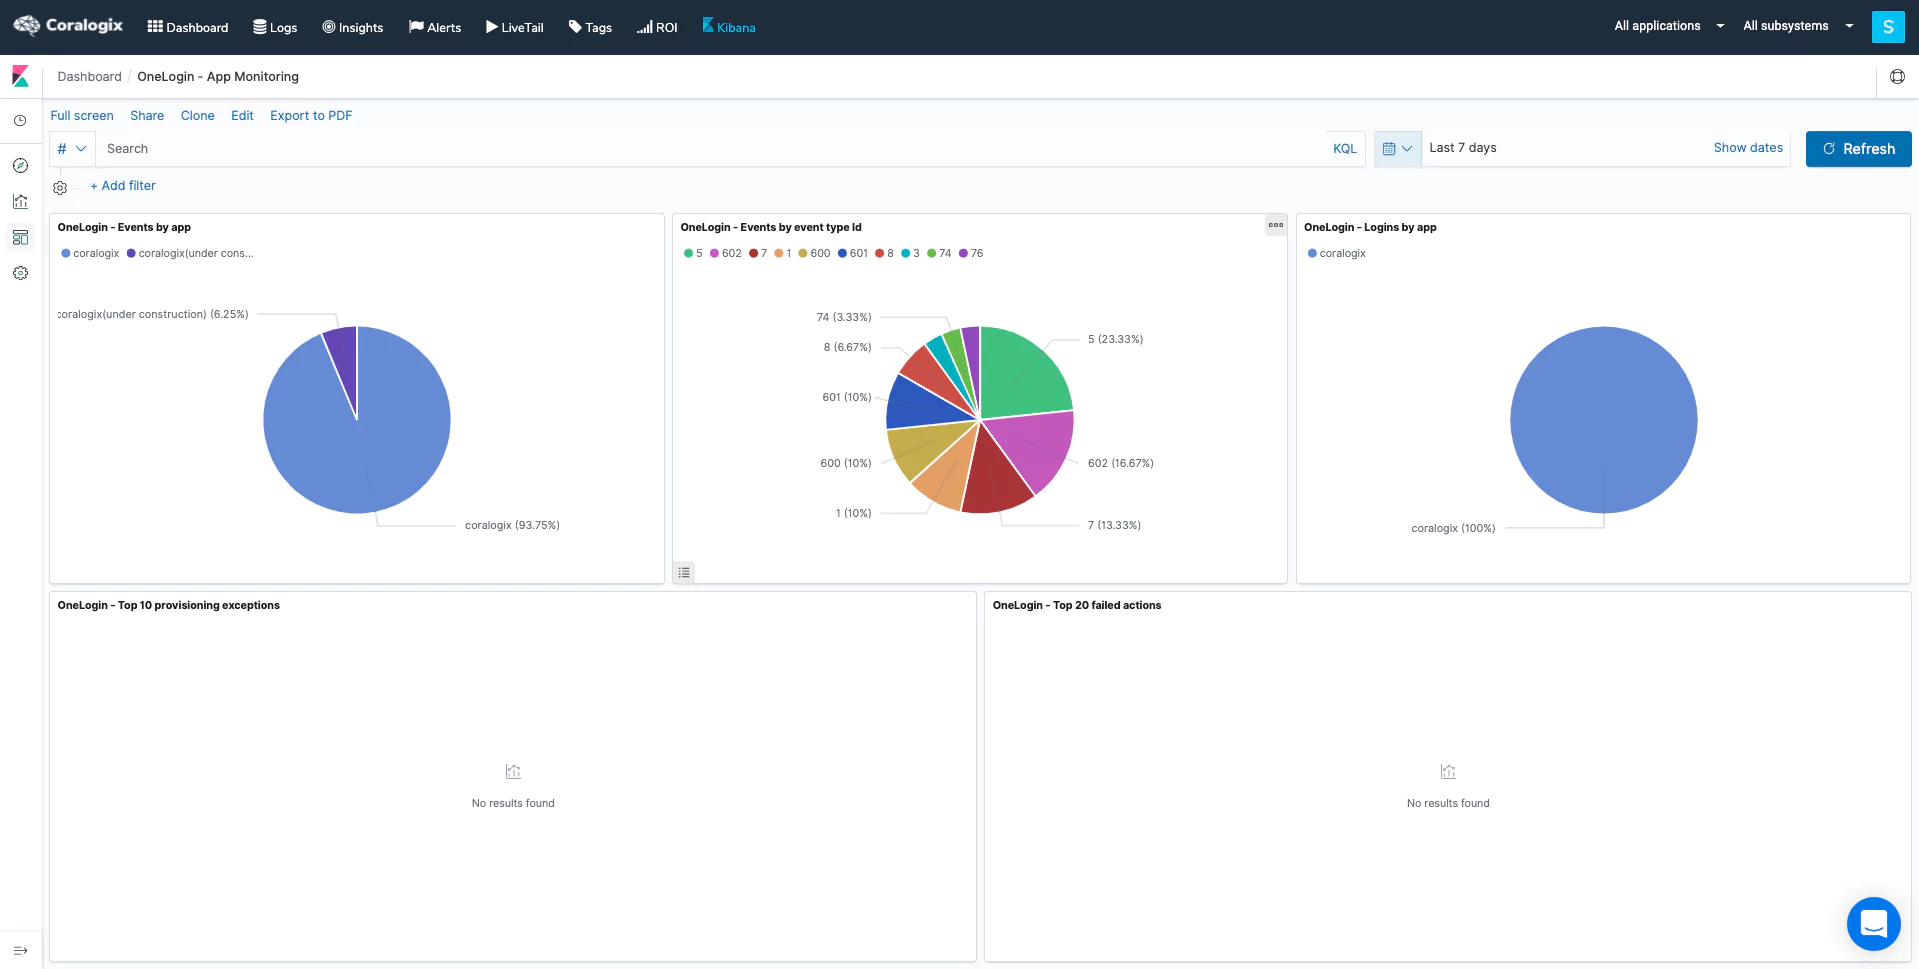
- App Monitoring
You may create additional visualizations and dashboards of your own, using your OneLogin logs.
-
Overview
-
Security
- App Monitoring
OneLogin Alerts
Coralogix User-defined alerts enable you to easily create any alert you have in mind, using complex queries and various conditions heuristics, thus being more proactive with your OneLogin logs and notified in real-time when issues arise. Here are some examples of alerts we created using traditional OneLogin log data.
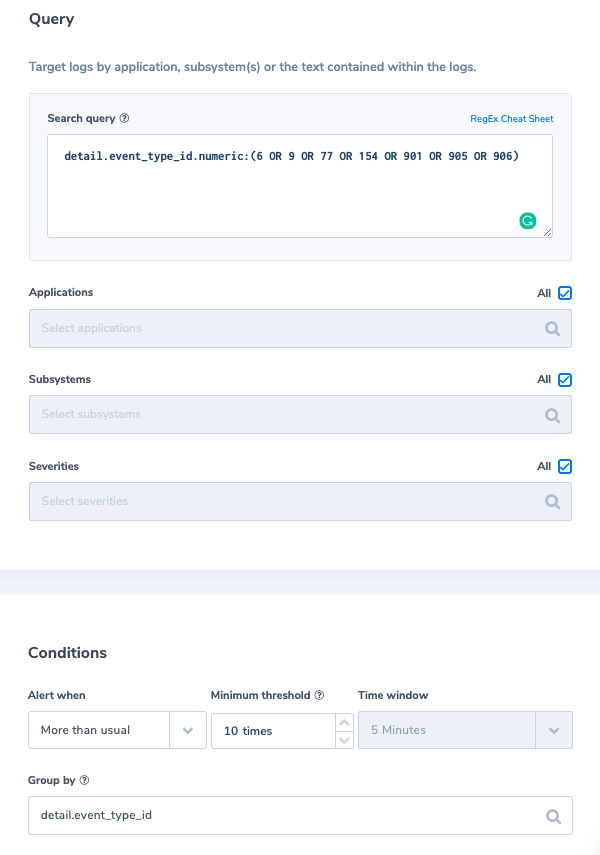
1. More than usual login failure per event type
Alert Filter: detail.event_type_id.numeric:(6 OR 9 OR 77 OR 154 OR 901 OR 905 OR 906)
Alert Condition: ‘More than usual times, within 5 min with a minimum of 10 occurrences’, grouped by detail.event_type_id.
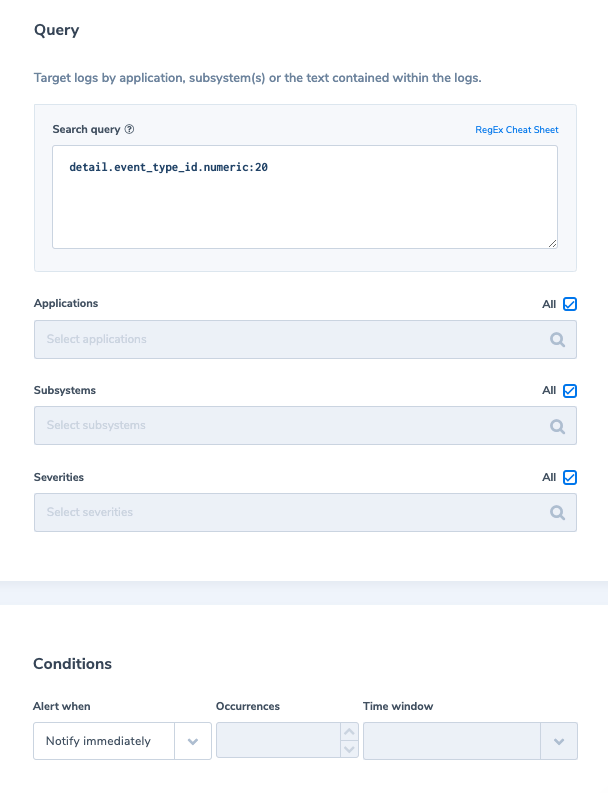
2. App user limit reach
Alert Filter: detail.event_type_id.numeric:20
Alert Condition: ‘Notify immediately’
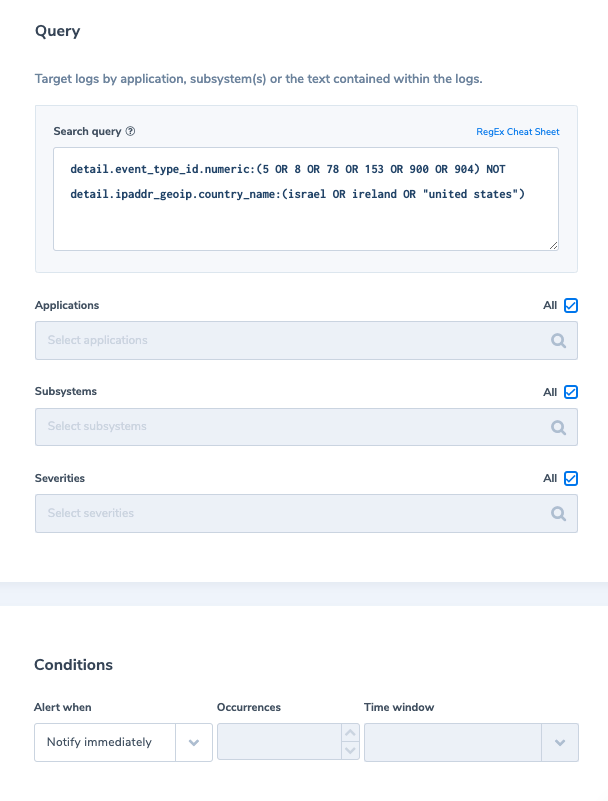
3. Successful login from an unfamiliar country
Alert Filter: detail.event_type_id.numeric:(5 OR 8 OR 78 OR 153 OR 900 OR 904) NOT detail.ipaddr_geoip.country_name:(israel OR ireland OR “united states”)
Alert Condition: ‘Notify immediately’
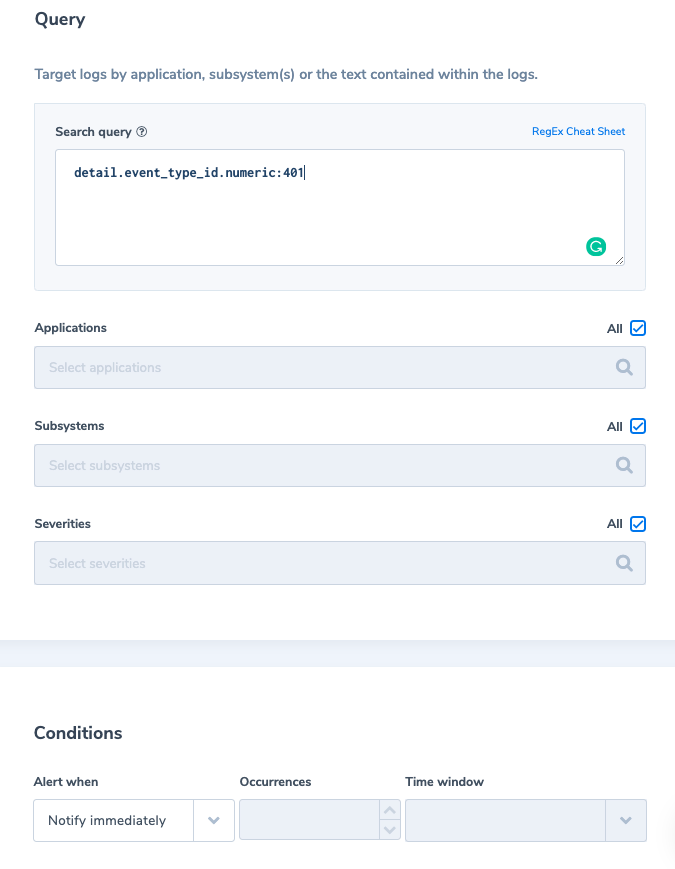
4. Unauthorized API event
Alert Filter: detail.event_type_id.numeric:401
Alert Condition: ‘Notify immediately’
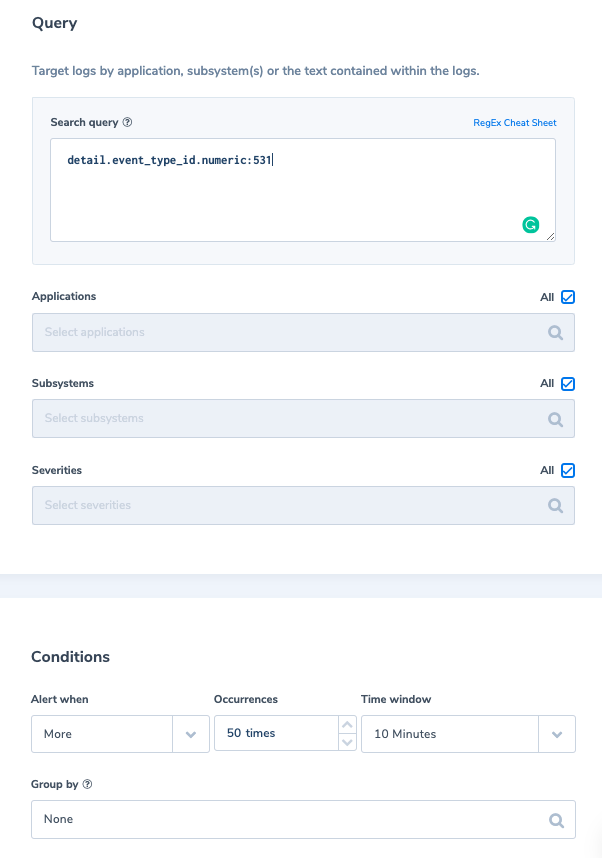
5. More than 50 API lock user event in 10 min
Alert Filter: detail.event_type_id.numeric:531
Alert Condition: ‘More than 50 times, within 10 min’
Need More Help with Auth0 or any other log data? Click on the chat icon on the bottom right corner for quick advice from our logging experts.