Using Synthetic Endpoints to Quality Check your Platform

Quality control and observability of your platform are critical for any customer-facing application. Businesses need to understand their user’s experience in every step of the app or webpage. User engagement can often depend on how well your platform functions, and responding quickly to problems can make a big difference in your application’s success.
AWS monitoring tools can help companies simulate and understand the user experience. It will help alert businesses to issues before they become problems for customers.
The Functionality of AWS Canaries
AWS Canaries are an instantiation of Amazon’s CloudWatch Synthetics. They are configurable scripts that automatically execute to monitor endpoints and APIs. They will follow the flow and perform the actions as real users. The results from the Canary mimic what a real user would see at any given time, allowing teams to validate their customer’s experience.
Tracked metrics using AWS Canaries include availability and latency of your platform’s endpoints and APIs, load time data, and user interface screenshots. They can also monitor linked URLs and website content. AWS Canaries can also check for changes to your endpoint resulting from authorized code changes, phishing, and DDoS attacks.
How AWS Canaries Work
AWS Canaries are scripts that monitor your endpoints and APIs. The scripts follow the same flows that real customers would follow to hit your endpoints. Developers can write Canary scripts using either Node.js or Python, and the scripts run on a headless Google Chrome Browser using Puppeteer for Node.js scripts or Selenium for Python scripts. Canaries run scripts against your platform and log results in one of AWS’s observability tools, such as CloudWatch or XRay. From here, developers can export the data to other tools like Coralogix’s metrics platform for analysis.
AWS Canaries and Observability
AWS Canaries and X-Ray
Developers can set AWS Canaries to use X-Ray for specific runtimes. When X-Ray is enabled, traces indicate latency requests, and the Canaries send failures to X-Ray. These data are explicitly grouped for canary calls, making separating actual calls from AWS Canary calls against your endpoints easier.
Enabling traces can increase the canary’s runtime by up to 7%. Also, set IAM permissions that allow the canary to write to X-Ray.
AWS Canaries and EventBridge
AWS EventBridge can notify various AWS Canary events, including status changes or complete runs. AWS does not guarantee delivery of all Canary events to EventBridge, instead of sending on a best effort basis. Cases where data does not arrive in EventBridge, are expected to be rare.
Canary events can trigger different EventBridge rules and, therefore, different subsequent functions or data transfers to third-party analytics tools. Functions can be written that allow teams to troubleshoot when a canary fails, investigate error states, or monitor workflows.
AWS Canaries and CloudWatch Metrics
AWS Canaries will automatically create Cloudwatch metrics. Metrics published include the percentage of entirely successful and failed canary runs, duration of canary tuns, and the number of responses in the 200, 400, and 500 ranges.
Metrics can be viewed on the CloudWatch Metrics page. They will be present under the CloudWatchSynthetics namespace.
AWS Canaries and Third-Party Analytics
Since AWS Canaries automatically write CloudWatch metrics, metrics streams can be used to deliver data to third-party tools like Coralogix’s scaling metrics platform. CloudWatch metrics streams allow users to send only specific namespaces or all namespaces to third parties. After the stream is created, new metrics will be sent automatically to the third party without limit. AWS does charge based on the number of metrics updates sent.
Creating a Canary
When creating a Canary, developers choose whether to use an AWS-provided blueprint, the inline editor, or import a script from S3. Blueprints provide a simple way to get started with this tool. Developers can create Canaries using several tools such as the Serverless framework, the AWS CLI, or the AWS console. Here we will focus on creating a Canary using a Blueprint with the AWS console.
Create a Canary from the AWS Console
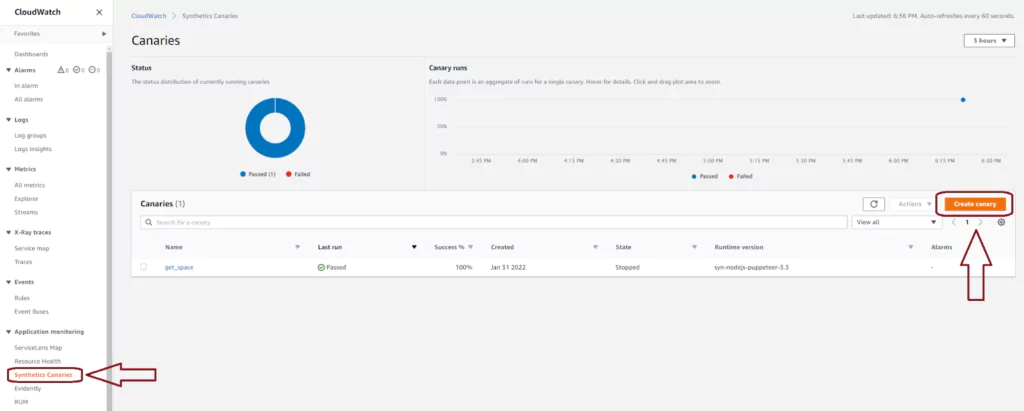
Navigate to the AWS CloudWatch console. You will find Synthetics Canaries in the right-hand menu under the Application monitoring section. This page loads to show you any existing Canaries you have. You can see, at a glance, how many of the most recent runs have passed or failed across all your canaries. You can also select Create canary from this page to make a new AWS Canary and test one of your endpoints.
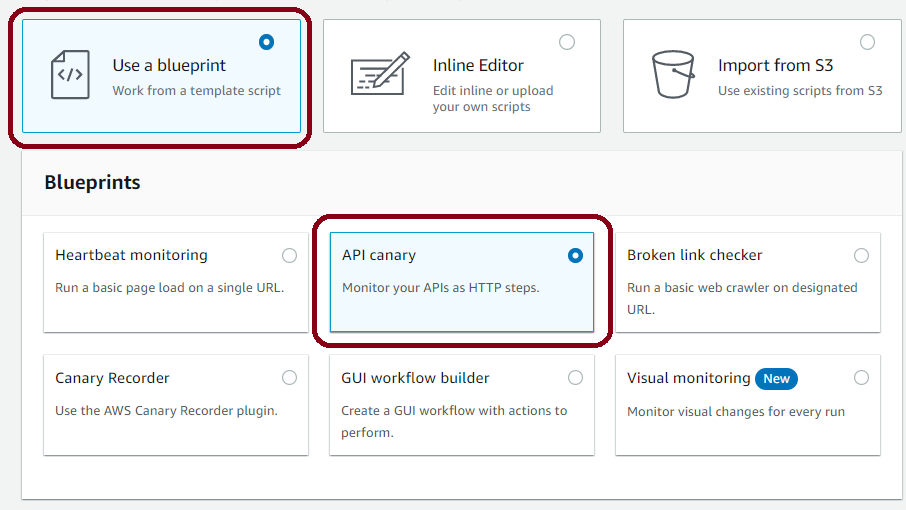
Use a Blueprint to create a Canary quickly
In the first section, you select how to create your new Canary. Here we will choose to use an AWS blueprint, but the inline editor and importing from S3 are also options. There are six blueprints currently available. Each is designed to get developers started on a different common problem. We will use the API canary, which will attempt to call the AWS-deployed API periodically. This option is useful when you want to test an API you own in AWS API Gateway or some other hosted service.
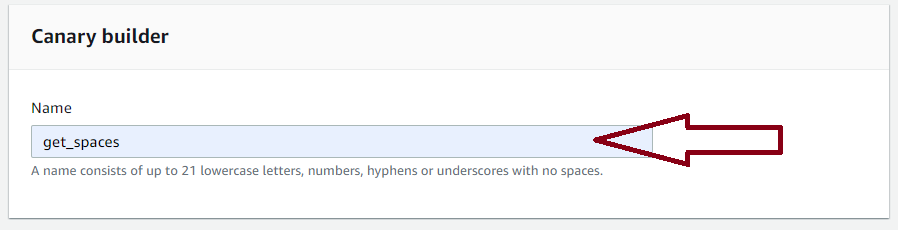
Name your Canary
Next, choose a name for your canary. It does not need to match the name of the API, but this will make it easier to analyze the results if you are testing a large number of endpoints.
Link your Canary to an AWS API Gateway
Next, AWS gives the option to load data directly from API Gateway. If you select the checkbox, the page expands, allowing you to choose your API Gateway, stage, and Hostname. Options are loaded from what is deployed in the same AWS environment. Developers are not required to select an AWS API Gateway and can still test other endpoints with the Canaries; the information is simply loaded manually.
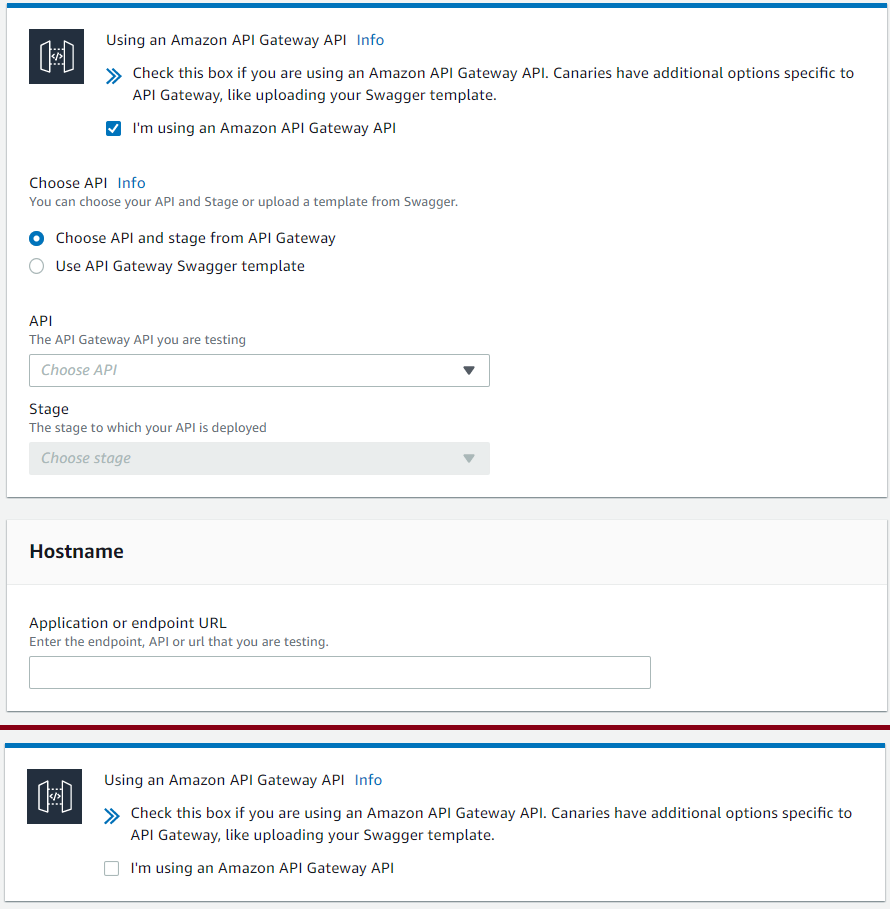
Setup your HTTP request
Next, add an HTTP request to your canary. If you have loaded from AWS API Gateway, a dropdown list is provided with resources attached to the endpoint. Choose the resource, method, and add any query strings or headers. If there is any authorization for your endpoint, it should be added here.
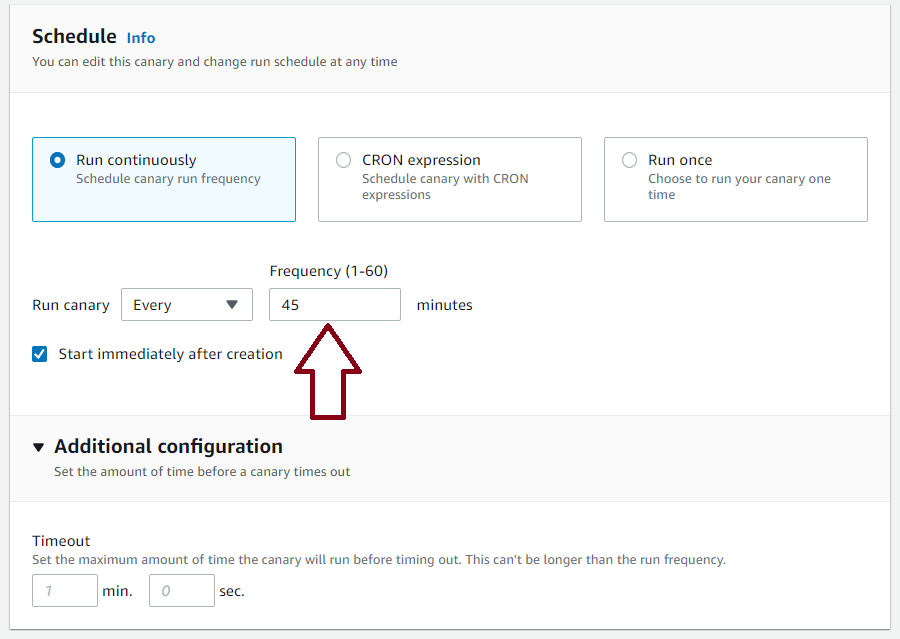
Schedule your Canary
After the HTTP setup is complete, choose the schedule for the AWS Canary. It determines how often the Canary function will hit your endpoint. You can choose between running periodically indefinitely, using a custom CRON expression, or just running the canary once. When selecting this, remember that this is adding traffic to your endpoint. This could incur costs depending on your setup.
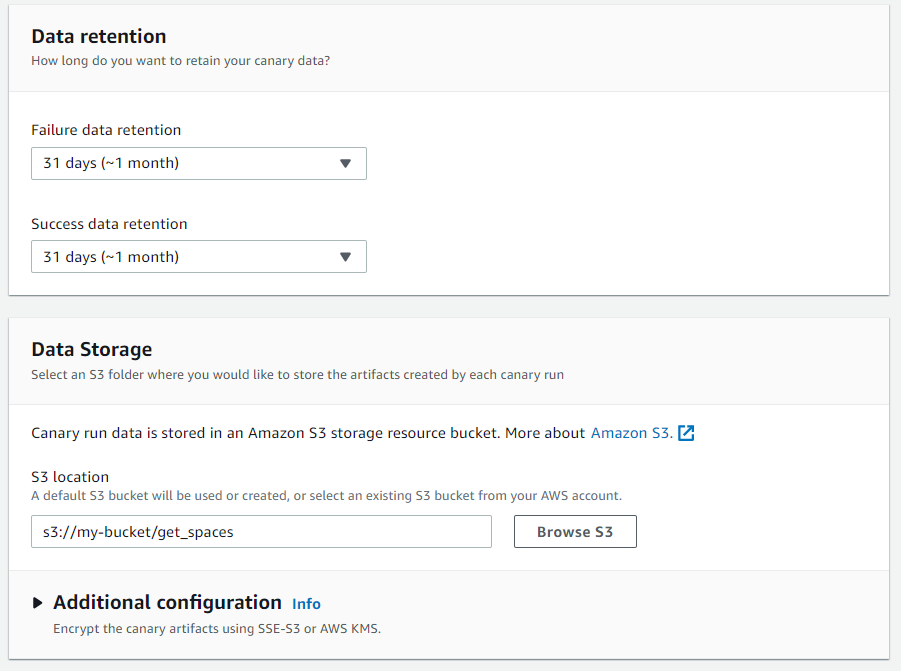
Configure log retention in AWS S3
AWS next allows developers to configure where Canary event logs are stored. They will automatically be placed into S3. From the console, developers can choose which S3 bucket should store the data and how long it should be kept. Developers can also choose to encrypt data in the S3 bucket. For exporting data to third-party tools, developers can set up a stream on the S3 bucket. This can trigger a third-party tool directly, send data via AWS Kinesis, or trigger AWS EventBridge to filter the data before sending it for analysis.
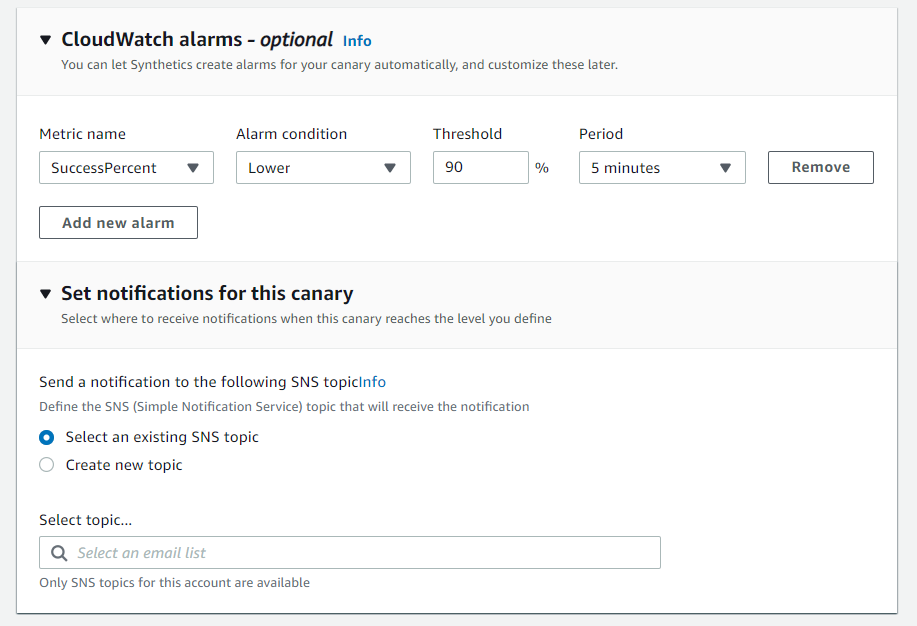
Setup an alarm
Developers can choose to set up a CloudWatch alarm on the Canary results. This is especially useful in production environments to ensure your endpoints are healthy and limit outages. The same results may also be obtained through third-party tools that enable machine learning not only to see when your endpoint has crossed a pre-set threshold but can also detect irregular or insecure events.
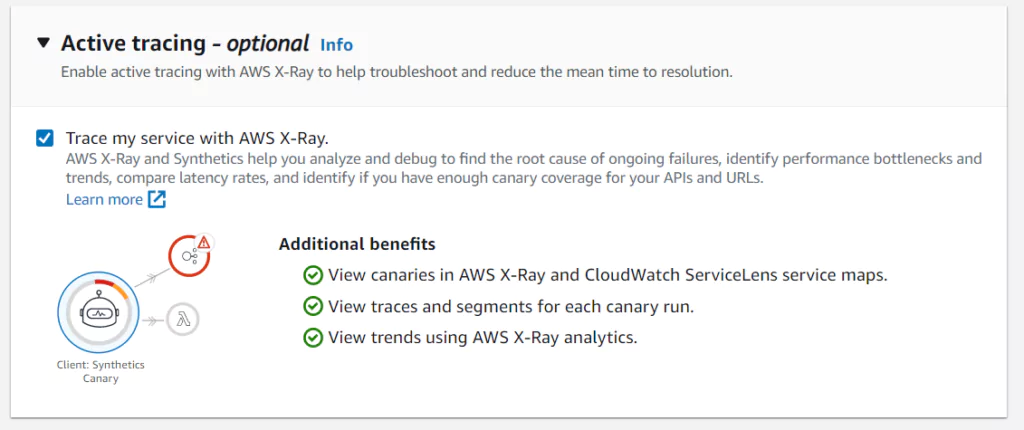
Enable AWS XRay
Developers can choose to send results of Canaries to AWS XRay. To send this data, check the box in the last section of the console screen. Enabling XRay will incur costs on your AWS account. It will also allow you another mode of observing your metrics and another path to third-party tools that can help analyze the health of your platform.
Summary
Canaries are an observability tool in AWS. Canaries give a method of analyzing API Endpoint behavior by periodically testing them and recording the results. Measured values include ensuring the endpoints are available, that returned data is expected, and that the delay in the response is within required limits.
AWS Canaries can log results to several AWS tools, including AWS Cloudwatch, AWS XRay, and AWS EventBridge. Developers can also send Canary results to third-party tools like the Coralogix platform to enable further analysis and alert DevOps teams when there are problems.