A Complete Guide to Tracking CDN Logs

The Content Delivery Network (CDN) market is projected to grow from 17.70 billion USD to 81.86 billion USD by 2026, according to a recent study. As more businesses adopt CDNs for their content distribution, CDN log tracking is becoming essential to achieve full-stack observability

That being said, the widespread distribution of the CDN servers can also make it challenging when you want visibility into your visitors’ behavior, optimize performance, and identify distribution issues. Thankfully, CDN logging provides a solution to these issues. 

In this article, we’ll dive into what CDN logs are, how to track them and the kind of data you should be extracting from them.

Understanding CDN logs

CDNs speed up content delivery and improve user experience by caching assets like images and videos on edge servers distributed across the globe. And CDN logs curate data on all requests accessing your website or app through the CDN.

These include data like request URLs, response codes and time, client IP addresses, request times, caching information and the geolocation of requests. CDN log data can also help you determine who is accessing your app or website, where they are accessing it from and the type of data they access.

CDN logs typically follow a common log format, with some variation between providers. Here is a general outline of the information you’ll typically find in a CDN log:

  • Client IP address: The IP address of the user or device accessing your content through the CDN. 
  • Request time: The date and time the request was made, in UTC. 
  • Request URL: The full URL that was requested. 
  • Response code: The HTTP response code returned for the request, such as 200 (OK), 404 (Not Found), etc.
  • Cache status: Whether the requested resource was served from cache or fetched from the origin. 
  • Request method: The HTTP method used, typically GET but sometimes POST.
  • Server IP: The IP address of the specific CDN server or POP that served the request.
  • Object size: The size of the requested object, in bytes. 
  • Geolocation: The location of the requesting client, such as country and sometimes city or region. 

Most major CDN providers offer logging and analytics dashboards as part of their service, often for an additional fee. You can configure some CDNs to send their logs to a third-party analytics or logging system for further CDN log analysis.

What is CDN tracking exactly?

CDN tracking typically involves CDN monitoring tools and software that collect data on user interactions with CDN-delivered content. This data can include the user’s geographic location, device type, browser type, and the specific content items accessed. Analyzing this data helps you to identify patterns and trends in user behavior, and make informed decisions about how to optimize content delivery for different user segments.

CDN monitoring tools integrate with the CDN provider’s APIs to access real-time metrics and log data those APIs expose. They also allow you to analyze and report on that data within a central dashboard or interface.

CDN monitoring tools simplify the process of tracking your CDN logs by providing;

  • centralized monitoring of multiple CDNs in one place
  • standardized reporting and dashboards across CDNs and
  • advanced analytics capabilities not available in the CDN provider’s native tools

With the advanced tracking capabilities provided by CDN monitoring tools, you can extract all kinds of useful data from your CDN logs with ease. Let’s look at some data types you can extract from your CDN logs and how to use them.

What to extract from CDN logs?

Collecting CDN log data allows you to monitor the usage and performance of your CDN. By analyzing this data with a tool like Coralogix, you can identify performance bottlenecks, troubleshoot errors, and optimize CDN configurations to ensure fast and reliable content delivery.

CDN logs can be categorized based on the type of data they provide in 6 different types, as outlined below: 

1. Access logs

These logs provide information about every request made to the CDN, including the time of the request, the IP address of the requester, the HTTP status code, the requested URL, and the size of the response.

Use access logs to identify resources that are being accessed most frequently, which helps you with optimizing caching, CDN configurations, and resource allocation. Access logs also allow you to  identify and troubleshoot issues with specific URLs or origin servers. For example, if a particular URL is returning a 404 or 500 error code, access logs can be used to identify and investigate the root cause of the error.

2. Error logs 

Error logs only capture information about errors that occur while processing requests, such as 404 errors or 500 errors. They help you find and troubleshoot issues with specific requests, such as missing resources or incorrect server configurations.

Error logs can also be used to monitor and investigate errors in real-time, and take corrective actions to ensure uninterrupted service.

3. Performance logs

Performance logs contain real-time information about the performance of the CDN, including the response time, the number of requests served, and the number of requests that were cached.

They also let you optimize the CDN configuration by adjusting cache expiration times or configuring load balancing. Use performance logs to monitor and analyze the performance of the CDN infrastructure, and identify performance bottlenecks that could impact user experience.

4. Security logs

Security logs detail information about security-related events, such as failed login attempts or attacks on the CDN infrastructure. These logs can be used to monitor and detect suspicious activity, such as brute-force attacks or DDoS attacks.

You can also use security logs to identify and mitigate security threats, such as by blocking IP addresses or implementing rate limiting.

5. Analytics logs 

Analytics logs provide information about user behavior, such as the geographic location of users, the devices they are using, and the pages they are accessing. These types of logs help you understand user behavior and optimize the user experience, such as by optimizing page load times or improving content delivery.

They can be used to monitor and analyze user behavior, and identify patterns and trends that could impact the performance of the CDN infrastructure.

6. Real-time logs 

Real-time logs are generated in real-time and they provide information about the requests being processed by the CDN, enabling administrators to monitor and respond to issues as they occur.

These logs can be used to troubleshoot issues in real-time and ensure uninterrupted service. For instance, when you make changes to your CDN configuration, use real-time log analysis to validate the new settings are working as expected and alert you to any unintended consequences.

CDN log monitoring with Coralogix

Coralogix’s full-stack observability platform comes equipped with in-stream data analytics that allows you to collect and centralize CDN logs from various CDN services. Analyze these massive CDN logs in real-time without indexing using their Streama© streaming analytics engine.

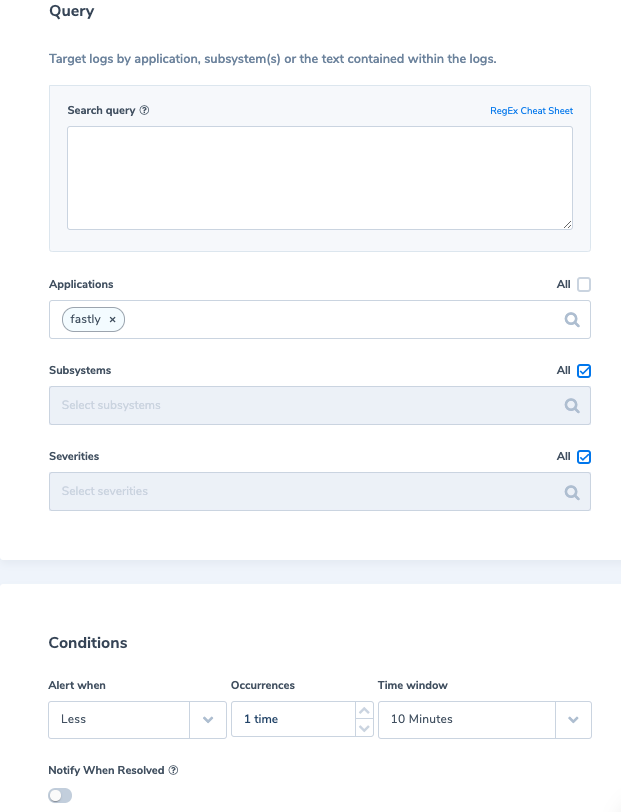
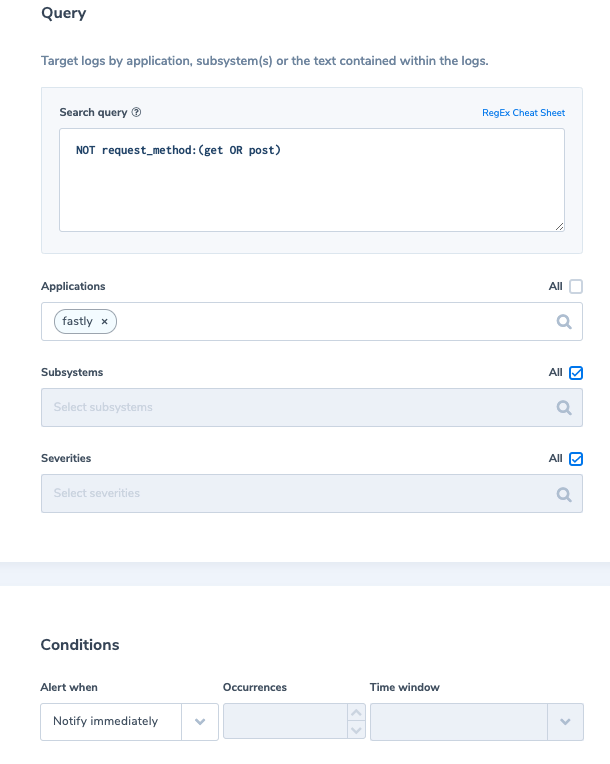
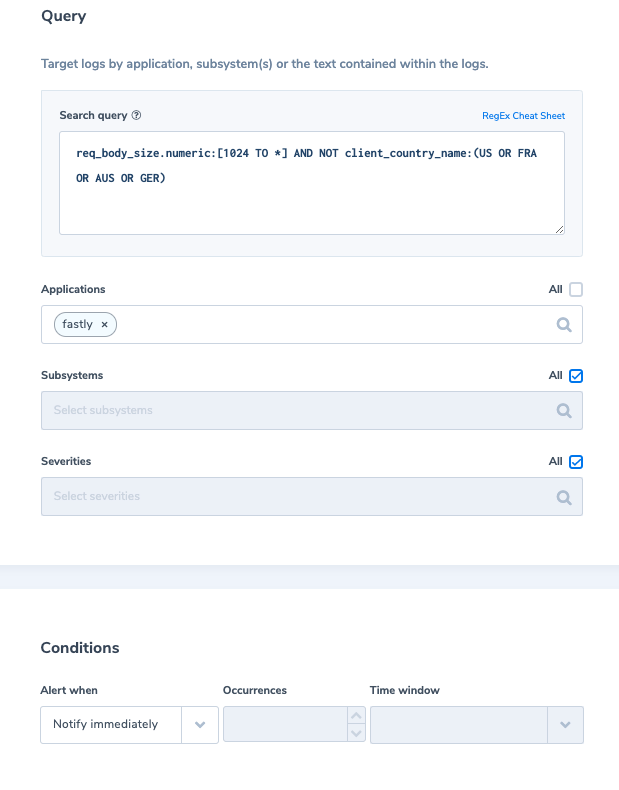
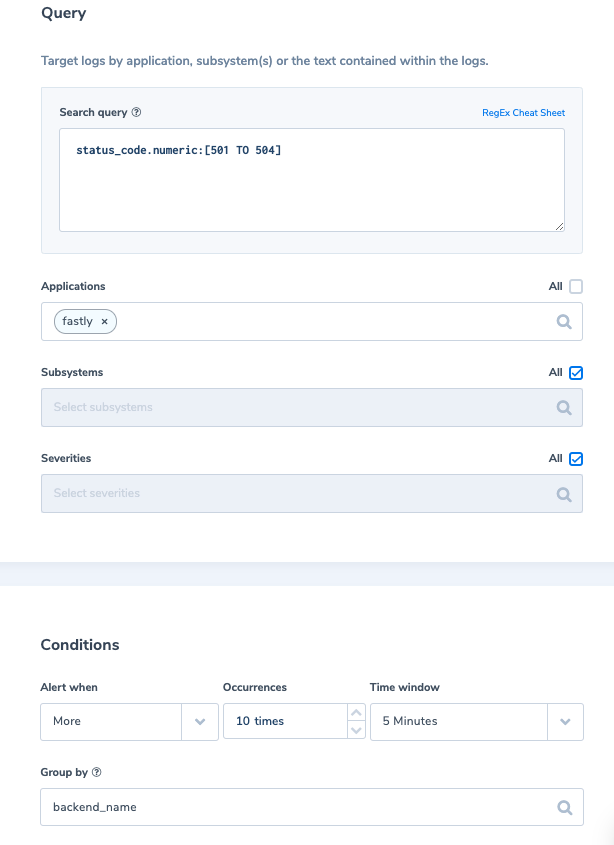
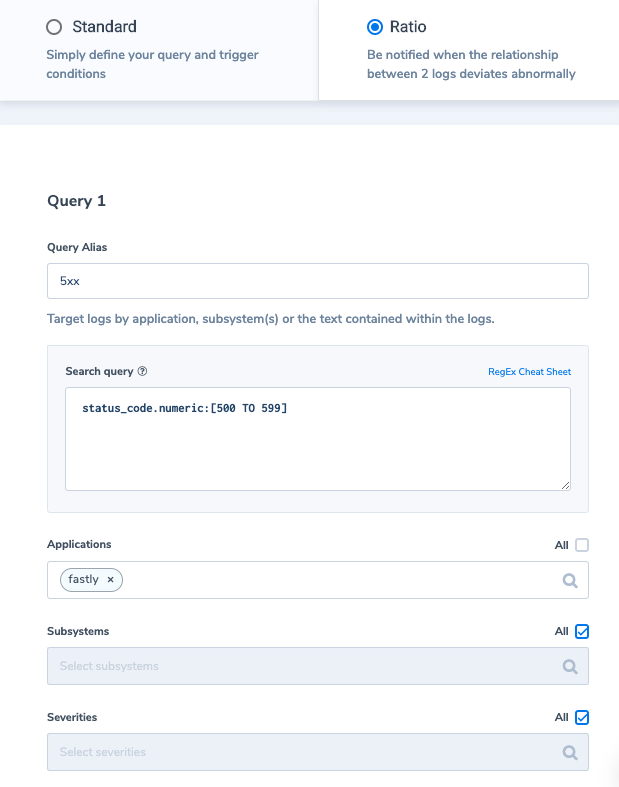
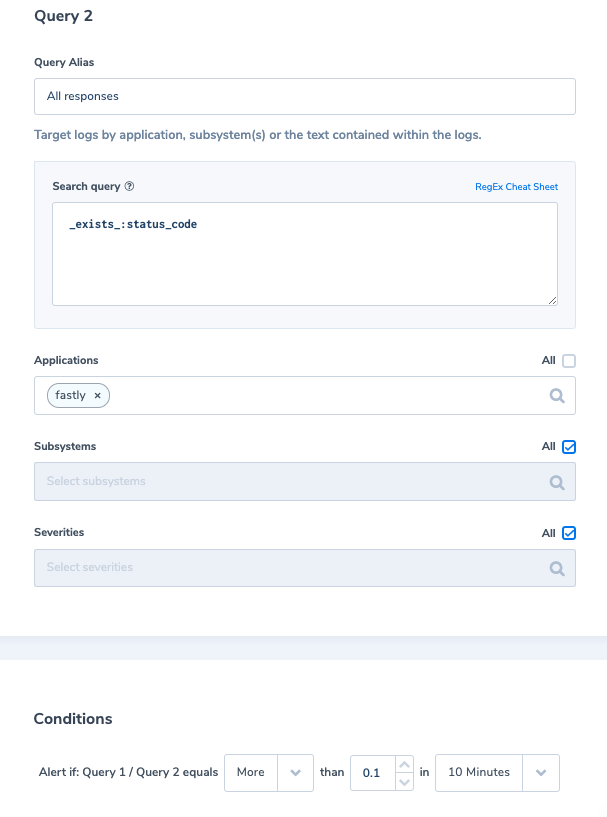
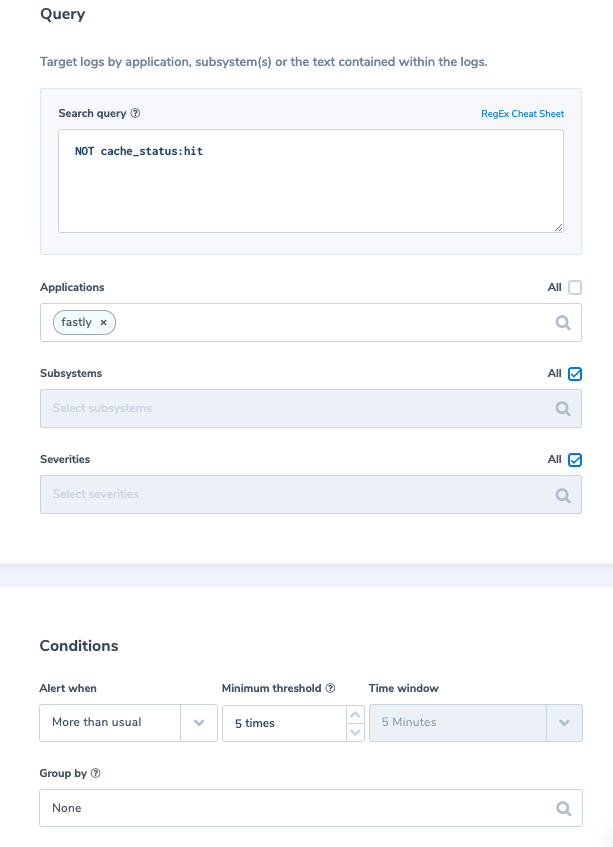
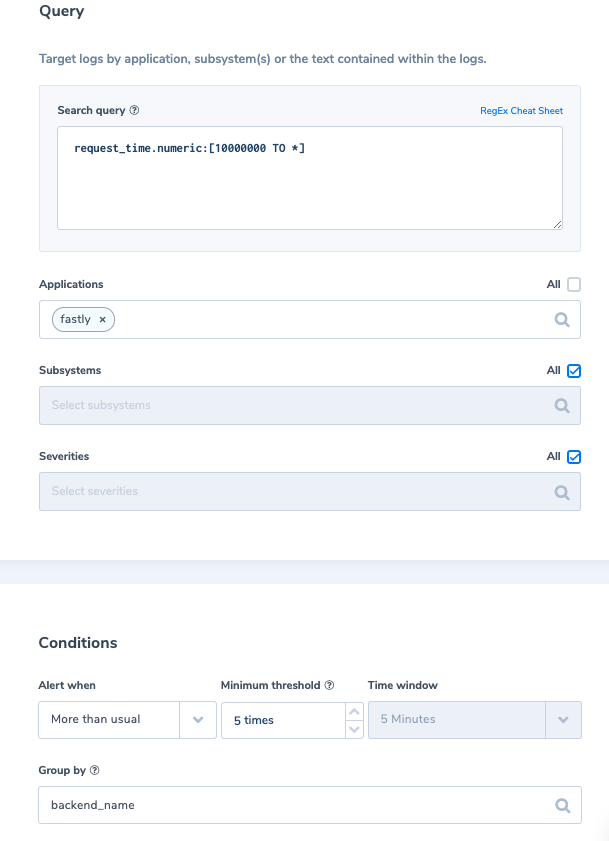
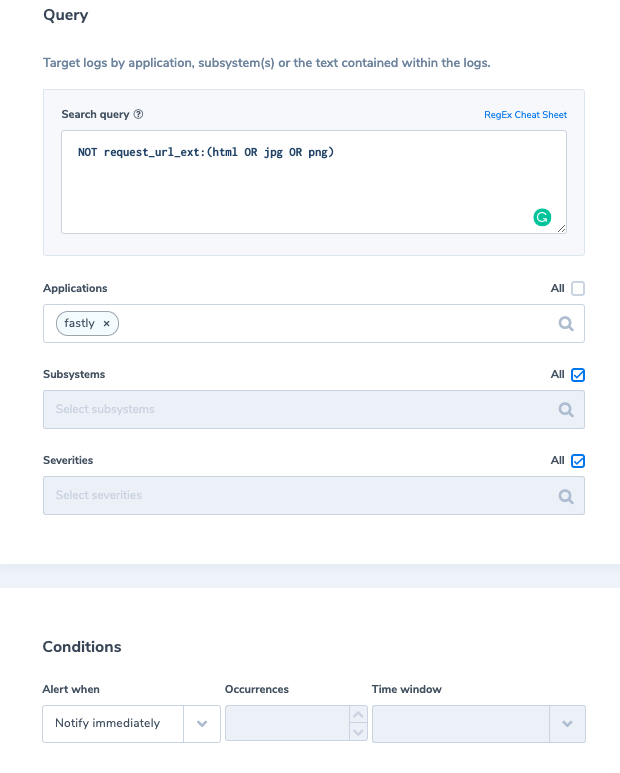
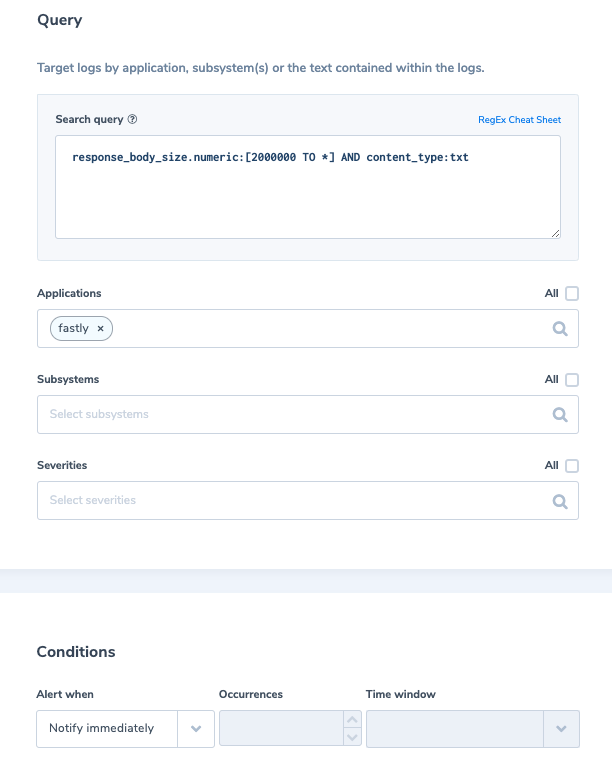
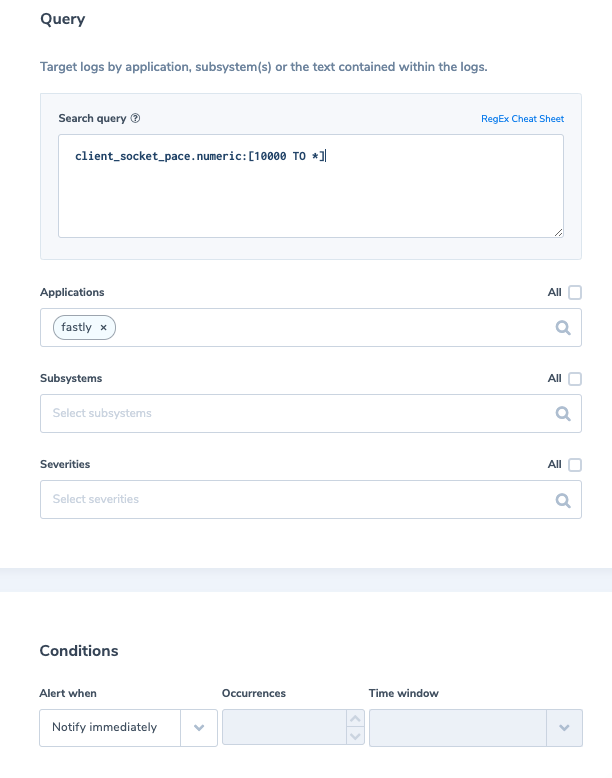
The platform lets you set up real-time alerts on CDN logs to detect issues, outliers, and anomalies, while their in-stream alerting feature correlates events across log, metric, and trace data. CDN tracking with Coralogix is a seamless process. 

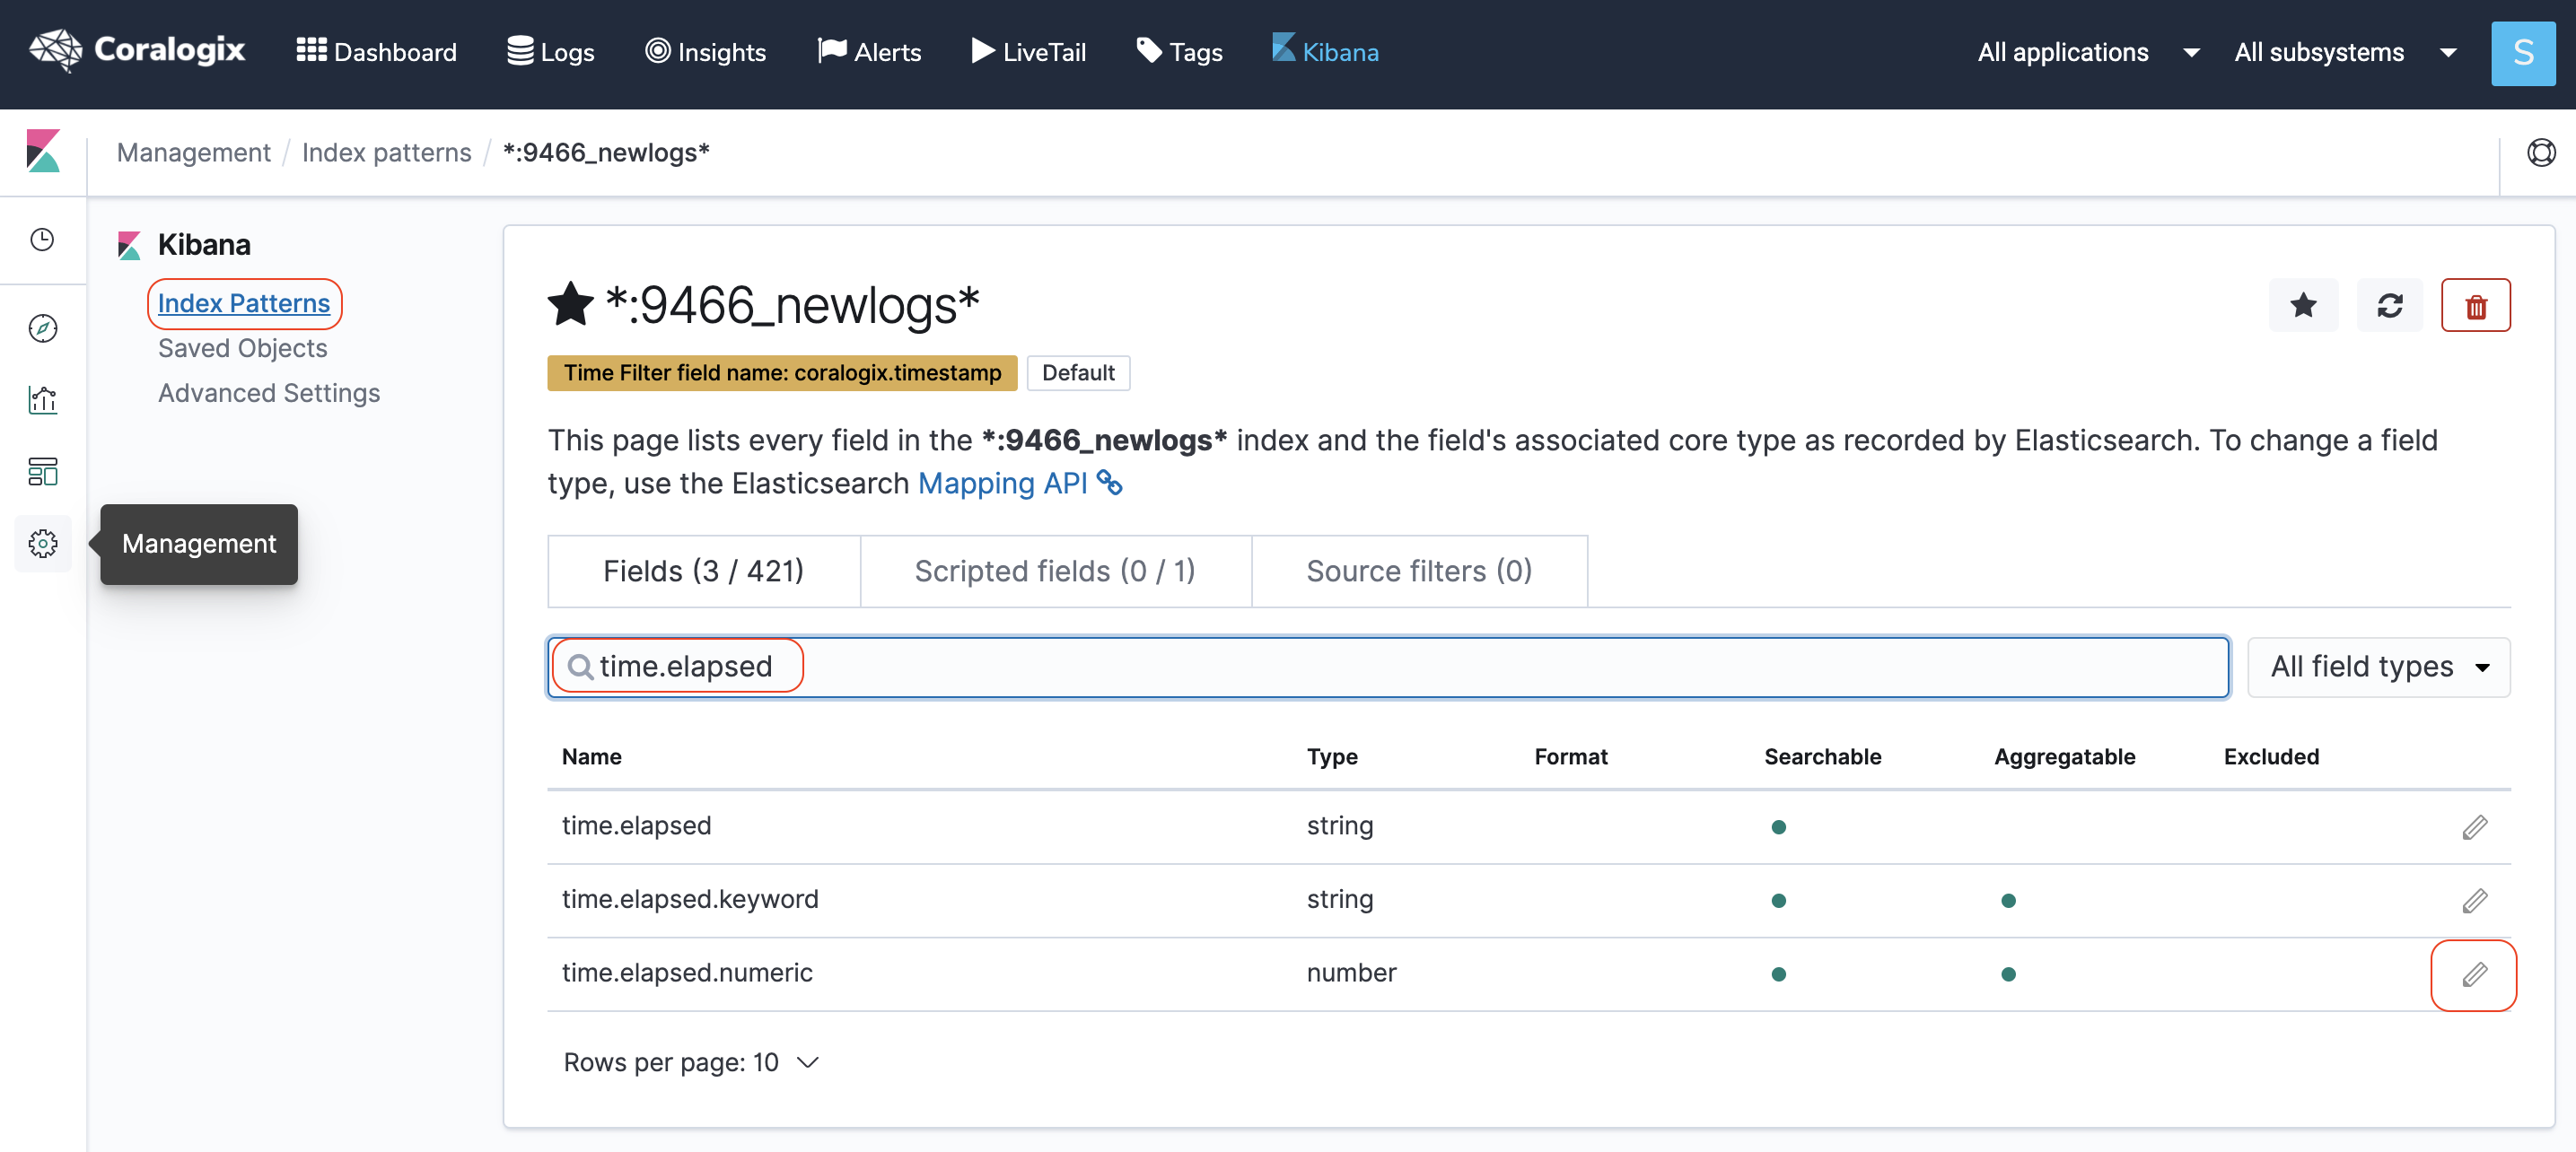
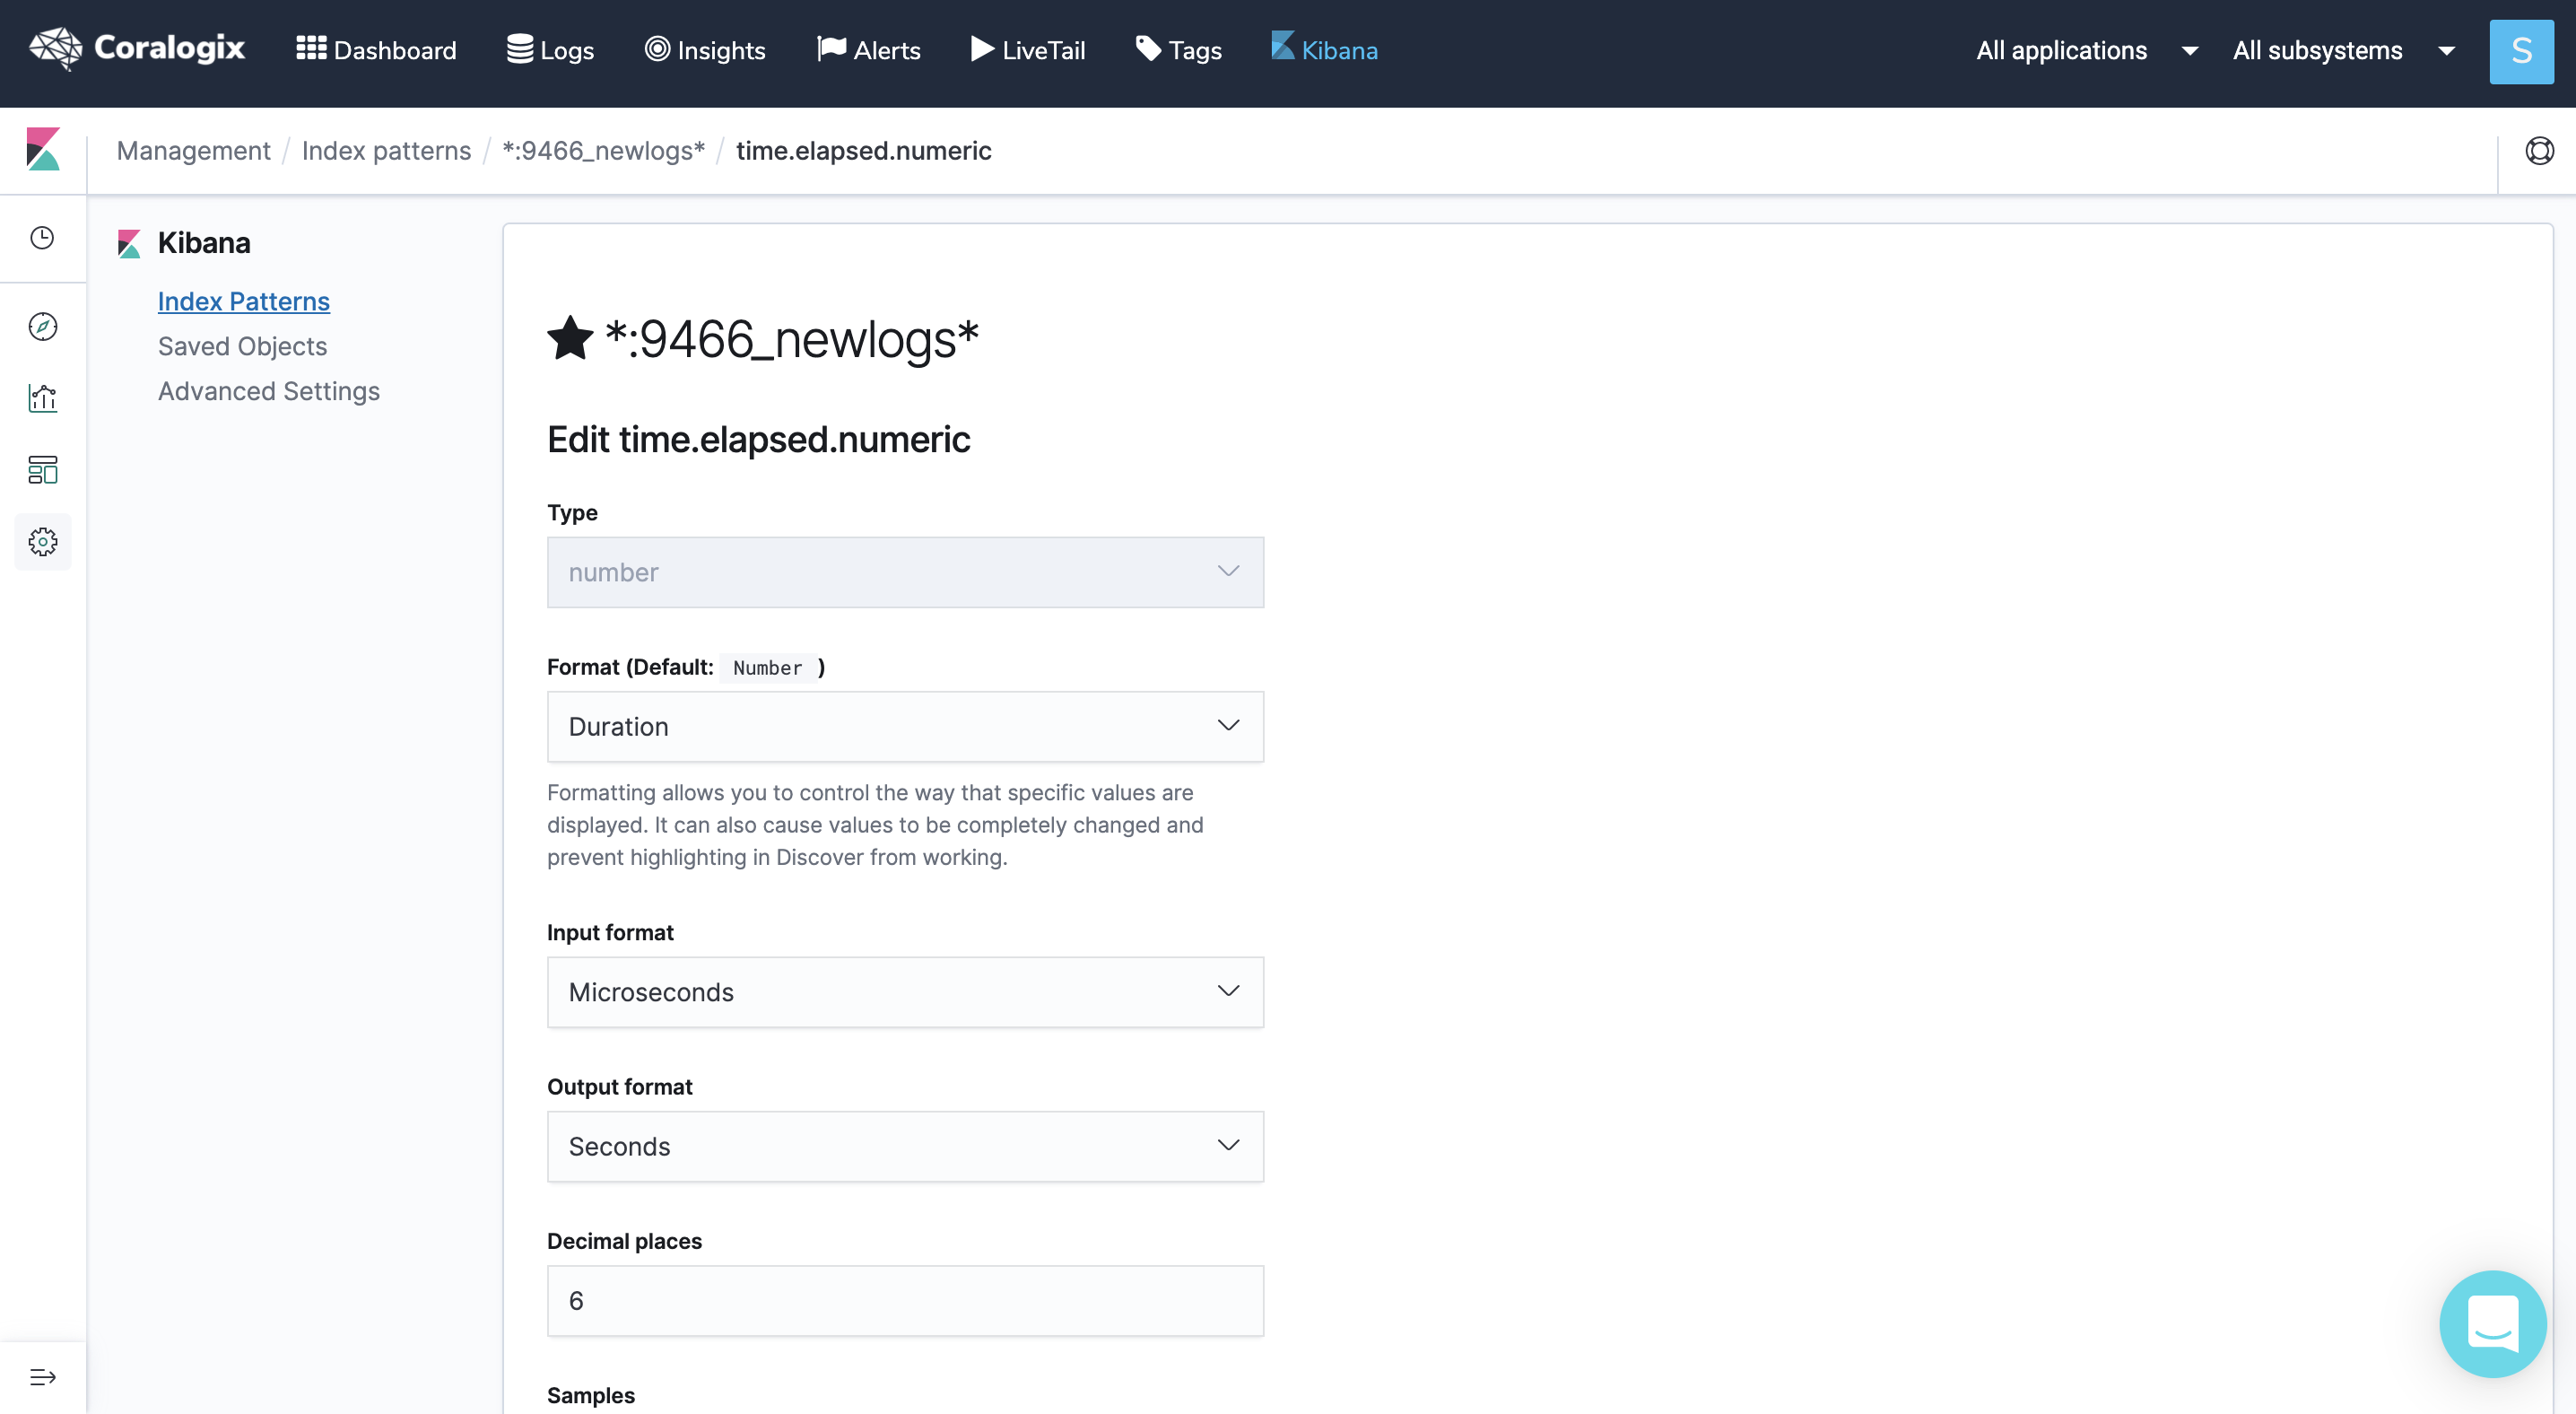
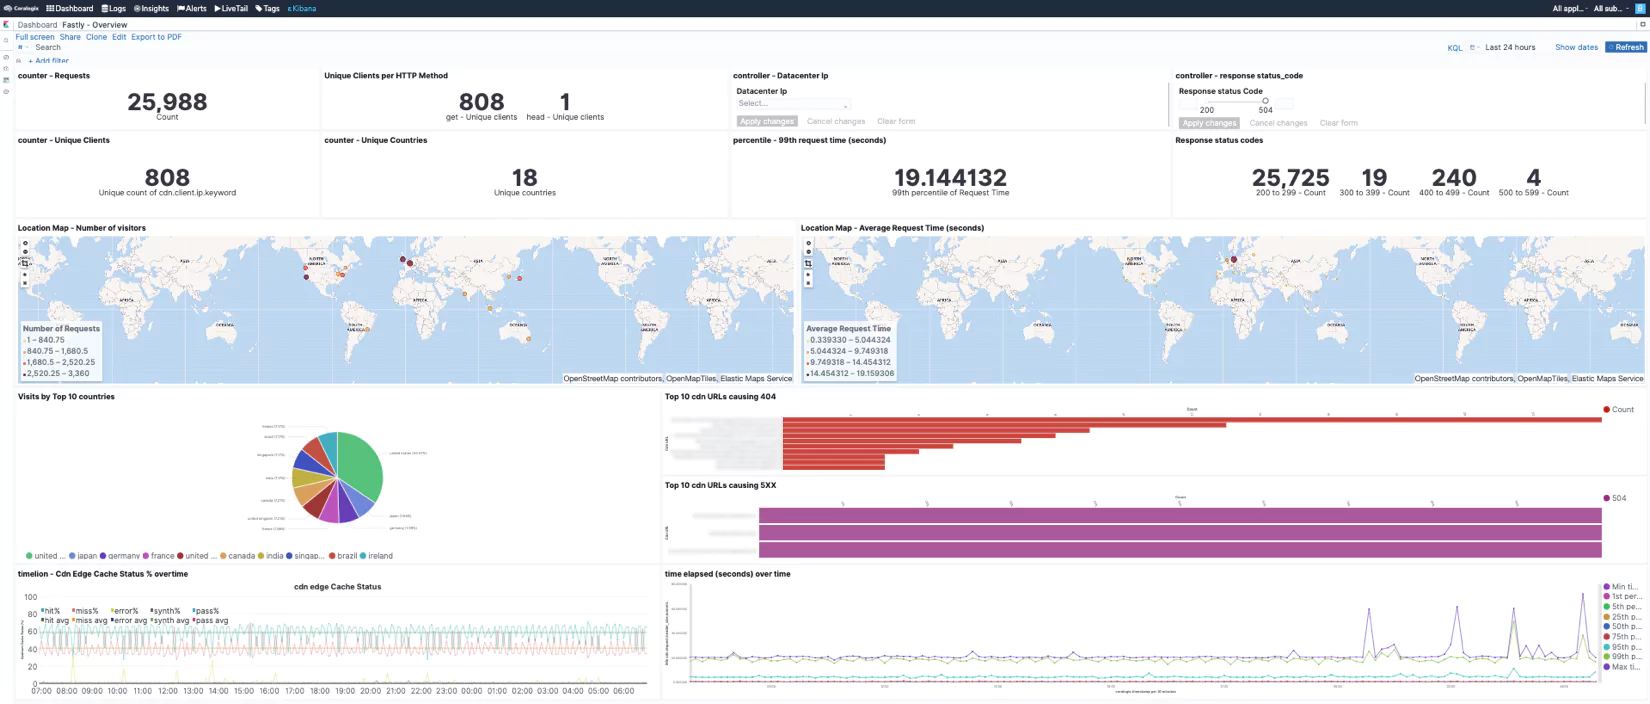
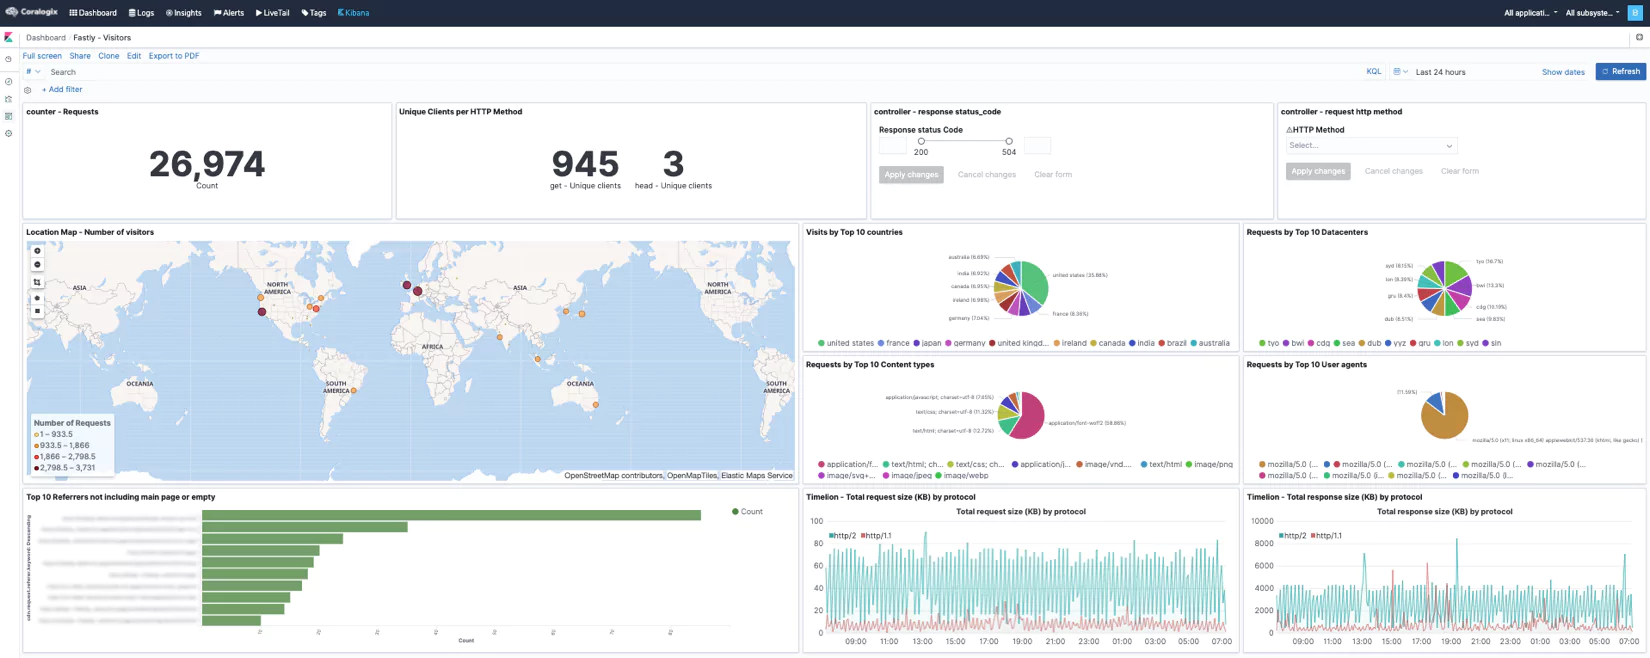
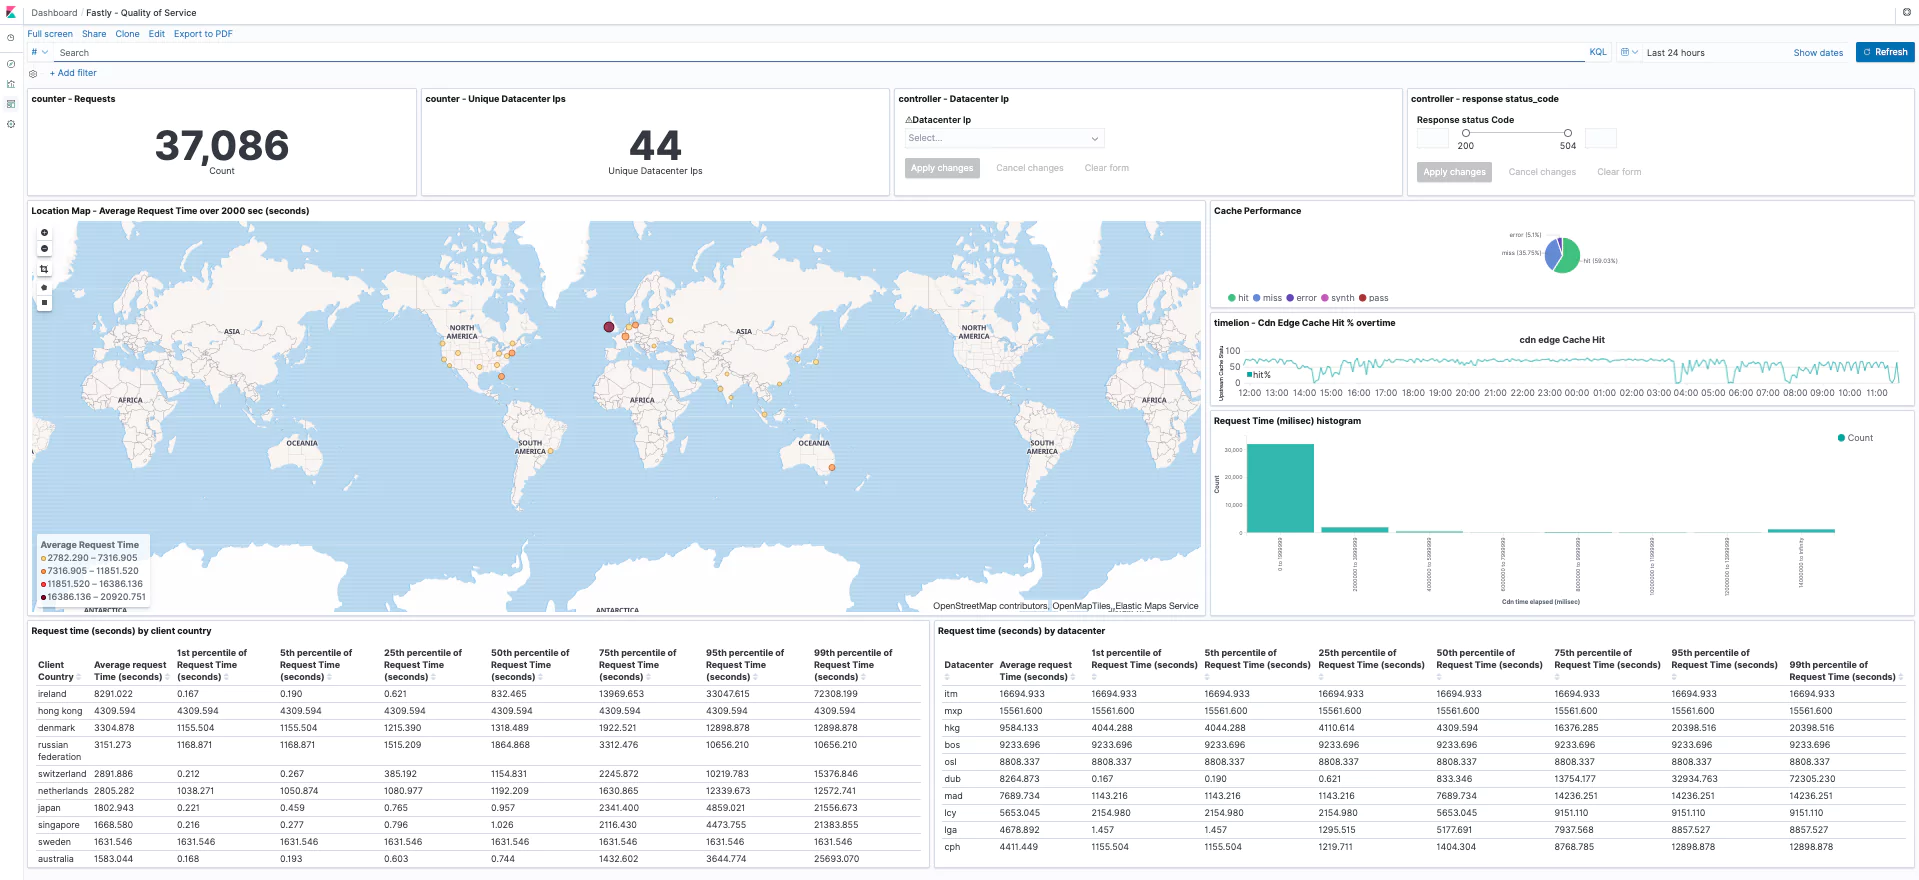
First, use Coralogix’s integrations with CDNs, such as Akamai or Amazon CloudFront, to collect and stream CDN logs directly to the dashboard. Once logs are collected, Coralogix’s search and filtering capabilities help you query and analyze the logs, create real-time alerts and dashboards to monitor CDN performance metrics and detect issues.Then, try integrating CDN log data with other contextual data, such as application logs, metrics, and traces, to gain a comprehensive view of issues impacting CDN performance.

Furthermore, with the help of CDN monitoring tools, gain valuable insights into how your CDN is performing and identify any issues affecting your content distribution. Investing in a robust CDN monitoring solution will improve the efficiency of your content delivery networks. CDN monitoring tools will work effectively to serve users the content they want, when and where they want it.

How to Choose the Best CDN Monitoring Tool for Your Needs

Rich content like videos and graphics used to cause network congestion and long load times when all the content was stored on a centrally located server. Fortunately, Content Delivery Networks (CDNs) monitoring tools came to the rescue in the late 1990s, letting users load rich content from a location geographically closer to them and reducing load times by distributing a cached version of content across servers worldwide. 

And since rich content is so widely used, CDNs have also become a critical component of IT architecture. Provided by third-party companies like Fastly, CloudFlare, and Akamai, CDNs allow logs to be sent to and monitored, with the help of strong full-stack observability platforms like Coralgoix, ensuring high performance standards and minimizing outages. 

This article will discuss what to look for in a CDN monitoring tool based on attributes users need to be monitoring.

What your CDN monitoring tool needs to measure

Before choosing a CDN monitoring tool, users should determine what they need to measure. Find a monitoring tool to both analyze your CDN logs and follow your specific performance indicators. Consider tracking the following metrics:

  1. CDN latency monitoring

Latency measures how long website pages take to load. Page speed is a critical measurement since latency directly impacts performance metrics like conversion rate. The higher the latency, the more likely a website with low performance could see a drop in conversion rate. 

CDNs are meant to reduce latency but should also meet service level agreements (SLAs). Further, monitoring both your source and edge servers for latency will help isolate any problems and help you identify whether the issue is with your CDN or software?

You can measure latency across your website by graphing latency metrics. For example, Coralogix can ingest CDN logs from various providers and convert logs to metrics for visualization. Coralogix also ingests logs from various sources and immediately analyzes them using its proprietary Streama technology. So IT teams can know at a glance when the latency is higher than usual and also spot where the cause is.

  1. Security monitoring

CDN logs come complete with entries for every request issued to your website. Log observability tools can either analyze these logs directly or convert these logs to metrics that can be analyzed for security issues. These logs help IT teams find what nefarious actors did and where they are located.

Due to the high volume of logs used to monitor CDNs, most monitoring tools take significant time to index and assess the data. Analysis of multiple log events is needed to detect anomalies like security breaches. Time is of the essence when detecting and handling threats. Reducing the time it takes to produce the analysis and signal an alert is crucial for limiting the scope of security breaches. With Coralogix’s Streama technology, contextual alerting in real-time occurs in the stream without indexing latency or mapping dependencies. This allows your IT teams to neutralize threats faster.

  1. Performance monitoring

CDN monitoring tools should determine performance changes quickly. The right monitoring tool allows you to look back at archived logs and analyze improvements in performance over time. Coralogix’s Archive Query feature allows you to query your logs directly from your S3 archive seamlessly, helping you store information on performance issues and more. CDNs will also export logs to third-party observability services to be converted to metrics for analysis.

Providing your own performance monitoring, independently of the CDN itself, allows IT teams to hold CDN providers accountable, including when there’s a service-level agreement (SLA) breach. Performance metrics can be leveraged to ensure your website gets the best possible service.

Furthermore, most full-stack observability tools are cost-prohibitive since they charge for the amount of stored data. Storing the logs necessary for performance monitoring would greatly increase the cost. With Coralogix, the pricing model is based on analysis, not size. We are able to provide performance monitoring within your budget and business needs.

How to identify the problem

If a website becomes unavailable or faces a security breach, IT teams should be notified immediately in order to effectively handle the issue. Tools used for CDN monitoring should include an alerting system when metrics do not meet standards. 

Alerts are typically split into two categories: static and dynamic. Static alerts are helpful if a threshold is known and unchanging. For example, you may use a static alert to notify IT teams if the latency of a webpage is higher than some number of seconds. Dynamic alerts are helpful when alerts need to be set up comparing changing values. For example, when users want to alert when the latency is higher than usual, a dynamic alert should be used. 

Your monitoring solution will ideally have both types of alerting so IT teams can make the most of CDN logs and quickly respond to errors and user experience changes. Coralogix provides both dynamic and static alerting that are customizable for your needs. Choose from a variety of dynamic alerts that are built in and easy to set up. These include time-relative alerts that are especially useful for detecting abnormal behaviors like an increase in errors from your CDN.

Beware of hidden CDN costs

CDN logs are notoriously large since every request generates a log. Most observability solutions will charge based on the volume of logs ingested. Since CDN logs tend to have large volumes, choose a full stack observability solution that is unique in their pricing model. Coralogix will not charge you for the amount of logs you store, allowing for a complete observability solution for your CDN logs.

Wrapping up

CDNs allow high-performance websites to deliver rich content to users by placing cached content across multiple servers worldwide. Monitoring these servers is critical to understanding whether your website is performing as it should. 

Choose a monitoring tool that identifies specific issues such as latency, load-balancing and availability and security, as well as analyze archived logs, alert IT when an issue arises, and keep costs low despite extensive volume log data.

Fastly Logs Insights with Coralogix

This tutorial will show you how can Coralogix provide analytics and insights for the Fastly logs you ship to Coralogix, both performance, and security. To get all the Coralogix dashboards and alerts, contact our support on our website/in-app chat. We reply in under 2 minutes!

Content Delivery Networks allow enterprises to distribute web content through data centers around the world without exhausting enterprise resources. Fastly, one of the leading CDNs in the world enables a great real-time logging feature that gives enterprises granular visibility into their apps and services. You can leverage your rich Fastly log data through Coralogix’s User define Alerts and Data Dashboards to instantly discover trends and patterns within any given metric of your application-clients ecosystem, spot potential security threats, and get a real-time notification on any event that you might want to observe. Eventually, getting better monitoring experience and capabilities from your data, with minimum effort.

Fastly Alerts & Dashboards

What data should you send with your Fastly logs? The answer would be, any data you like. You may include in your logs any available Fastly variable, view VCL variables supported by Fastly and Fastly custom log formats documentation for more info. Once you choose your desired log template and set your Coralogix integration with your Fastly account, your apps and services logs will start streaming into Coralogix, data will be indexed and JSON fields will be mapped. Now, you are ready to create alerts and data dashboards.

Note

  • To download the following Dashboards click here. In order for the Dashboards to work properly, it is important to use the suggested log format we provide in our integration tutorial (see link at the beginning of this post) since the dashboard visualizations depend on it. If you choose to change the log format you will need to change alerts and visualizations definitions accordingly. Reach out to us in chat if you need any help importing them to your account.
  • In our log format, we chose the microsecond option for the time.elapsed parameter in order to have better precision for the request duration. We suggest setting its numeric option, time.elapsed.numeric, with format duration and output format seconds so it will reflect in the predefined dashboards. To do that, go to Kibana management–>index pattern and search for time.elapsed field.

    coralogix fastly insights blog kibana index pattern
    Click on the pencil icon on the right and set time.elapsed.numeric properties as suggested.
    coralogix fastly insights blog request time field definition

Dashboards

Here are a few examples of data dashboards we created using Fastly data. Using fields like client-IP, client-country, datacenter, status-code, request-time, cache-status, content-type, etc.. and the advanced Kibana & Timelion visualizations and aggregations types, we were able to create these Overview, Visitors and Quality of Service dashboards. The options are practically limitless and you may create any visualization you can think of as long as your logs contain that data you want to visualize. For more information please visit our Kibana tutorial.

  • Overview

    overview - fastly logs kibana coralogix
  • Visitors

    Visitors - fastly logs kibana - Coralogix
  • Quality of Service

    Fastly quality of service logs kibana

Alerts

Coralogix User-defined alerts enable you to easily create any alert you have in mind, using complex queries and various conditions heuristics, thus being more proactive with your Fastly data and provide you and your team insights you could never gain or anticipate from a traditional log investigation. Here are some examples of alerts we created using traditional Fastly data.

1. No logs from Fastly

When Fastly stops sending logs for some reason, it is important for us to be notified.

Alert Filter: set a filter on the application name that represents your Fastly logs. In my case, we named it fastly.

Alert Condition: less than 1 time in 10min

coralogix fastly blog no logs alert

2. Unusual web request method

Usually, requests to a website are done VIA GET or POST methods. Other requests are commonly used by malicious actors.

Alert Filter: ‘NOT request_method:(get OR post)’

Alert Condition: ‘Notify immediately’

coralogix fastly blog unusual web request alert

3. Website defacement

Website defacement is an attack on a website that changes the visual appearance of a website or a web page. Cases, where the request body size exceeding the expected size (usually with web content sites, the expected size for the request body is ~1024 bytes) and the request origin country is somewhat not expected, might be an indication of malicious activity.

Alert Filter: ‘req_body_size.numeric:[1024 TO *] AND NOT client_country_name:(US OR FRA OR AUS OR GER)’

Alert Condition: ‘Notify immediately’

coralogix fastly blog defacement alert

4. Backend outage

A high frequency of 501-504 errors from any backend can indicate a backend outage.

Alert Filter: ‘status_code.numeric:[501 TO 504]’

Alert Condition: ‘More than 10 times in 5 min’

coralogix fastly blog backend outage alert

5. High error ratio, over 10% (ratio alert)

Alert Filter 1: ‘status_code.numeric:[500 TO 599]’

Alert Filter 2: ‘_exists_:status_code’

Alert Condition (Query1/Query2): ‘More than 0.1 times in 10 min’

coralogix fastly blog high ratio 5xx A alert
coralogix fastly blog high ratio 5xx b alert

6. More than usual cache_status is not ‘Hit’ (dynamic alert)

Alert Filter: ‘NOT cache_status:hit’

Alert Condition: ‘More than usual times in 5 min with an allowed minimum of 5 occurrences’

coralogix fastly blog cache status not hit alert

7. Long requests

A long request time, higher than 10 seconds from any backend can indicate backend issues (request_time unit is micro sec).

Alert Filter: ‘request_time.numeric:[10000000 TO *]’

Alert Condition: ‘More than usual times in 5 min with an allowed minimum of 5 occurrences’

coralogix fastly blog long requests alert

8. Request URL extension is not an expected one

The file extension specified in a URL is expected to be Html, jpg, png.

Alert Filter: ‘NOT request_url_ext:(html OR jpg OR png)’

Alert Condition: ‘Notify immediately’

coralogix fastly blog unexpected url file extension alert

9. Data exfiltration – Response body size for content-type=txt

Data exfiltration occurs when malware and/or a malicious actor carries out an unauthorized data transfer from a computer. When the response body size is exceeding the normal threshold for .txt content request it might indicate an attempt to exfiltrate data.

Alert Filter: ‘response_body_size.numeric:[2000000 TO *] AND content_type:txt’

Alert Condition: ‘Notify immediately’

coralogix fastly blog response body for txt content request exfiltration alert

10.  Data exfiltration – Client socket pace

Client socket pace is the ceiling rate in kilobytes per second for bytes sent to the client. When it is exceeding the normal rate it might indicate an attempt to exfiltrate data.

Alert Filter: ‘client_socket_pace.numeric:[10000 TO *]’

Alert Condition: ‘Notify immediately’

coralogix fastly blog socket pace exfiltration alert

Need help? check our website and in-app chat for quick advice from our product specialists.