Microservices on Kubernetes: 12 Expert Tips for Success

In recent years, microservices have emerged as a popular architectural pattern. Although these self-contained services offer greater flexibility, scalability, and maintainability compared to monolithic applications, they can be difficult to manage without dedicated tools. 

Kubernetes, a scalable platform for orchestrating containerized applications, can help navigate your microservices. In this article, we will explore the relationship between Kubernetes and microservices, key components and benefits of Kubernetes and best practices for deploying microservices on the platform.

Before we dive in, let’s take a moment to understand the concept of microservices and examine some of the challenges they present, such as log management.

What are microservices?

Microservices are an architectural style in software development where an application is built as a collection of small, loosely coupled, and independently deployable services. 

Each service represents a specific business capability and operates as a separate unit, communicating with other services through well-defined APIs. These services are designed to perform a single task or function, following a single responsibility principle.

In contrast to traditional monolithic architectures, where the entire application is tightly integrated and deployed as a single unit, microservices break down the application into smaller, more manageable pieces.

Source: https://aws.amazon.com/compare/the-difference-between-monolithic-and-microservices-architecture/

Benefits of microservices 

Adopting a microservice architecture has several benefits. The decentralized nature of microservices enables them to operate independently, allowing separate development, deployment, and scalability. This autonomy leads to decentralized decision-making, fostering an environment where teams can work autonomously. 

Additionally, it allows developers to use different technologies and frameworks across microservices, as long as they adhere to standardized APIs and communication protocols.

The modular structure of microservices brings flexibility and agility to development, facilitating easy modifications and updates without disrupting the entire application.

This flexibility enables development teams to swiftly respond to changing requirements, accelerating time-to-market. It also means that a failure in one service does not cascade to affect others, resulting in a more robust overall system. 

Lastly, microservices support horizontal scaling. Each service can replicate itself to handle varying workloads, ensuring optimal resource utilization and scalability as the application grows. 

Challenges of microservices 

While microservices offer many advantages, they also introduce complexities in certain areas, such as observability. In a monolithic application, it is relatively easy to understand the system’s behavior and identify issues since everything is tightly coupled. As an application is divided into independent microservices, the complexity naturally rises, requiring a shift in how observability is employed within the system. This is especially true for log observability for microservices, since we now have independent services that generate an important amount of logs when interacting with each other and handling requests. 

Other challenges of microservices include managing inter-service communication, data consistency, and orchestrating deployments across multiple services. Thus Kubernetes can help you by offering a robust and efficient solution to handle these challenges and streamline the management of microservices.

Components of Kubernetes

Before delving into the advantages of using Kubernetes for microservices, let’s take a brief look at its key components. 

A Kubernetes cluster is composed of a Control Plane and Worker Nodes. Each worker node is like a stage where your applications perform. Inside these nodes, you have small units called pods, which are like mini-containers for your applications.

These pods contain your application’s code and everything it needs to run. The control plane is like the mastermind, managing the entire show and keeping track of all the worker nodes and pods, making sure they work together harmoniously. The pods will also orchestrate the deployment, scaling, and health of your applications.

Source: https://kubernetes.io/docs/concepts/overview/components/

Kubernetes also provides other valuable features, including: 

  1. Deployments

With Deployments, you can specify the desired state for pods, ensuring that the correct number of replicas is always running. It simplifies the process of managing updates and rollbacks, making application deployment a smooth process..

  1. Services 

Kubernetes Services facilitate seamless communication and load balancing between pods. They abstract away the complexity of managing individual pod IP addresses and enable stable access to your application services.

  1. ConfigMaps and Secrets

ConfigMaps and Secrets offer a neat way to separate configuration data from container images. This decoupling allows you to modify configurations without altering the container itself and enables secure management of sensitive data.

  1. Horizontal Pod Autoscaling (HPA)

HPA is a powerful feature that automatically adjusts the number of pods based on resource utilization. It ensures that your applications can handle varying workloads efficiently, scaling up or down as needed.

Benefits of using Kubernetes for microservices

Kubernetes provides several advantages when it comes to managing microservices effectively.

  1. Scalability

Kubernetes excels at horizontal scaling, allowing you to scale individual microservices based on demand. This ensures that your applications can handle varying workloads effectively without over-provisioning resources.

  1. High availability

Kubernetes provides built-in self-healing capabilities. If a microservice or a node fails, Kubernetes automatically restarts the failed components or replaces them with new ones, ensuring high availability and minimizing downtime.

  1. Resource management

Kubernetes enables efficient resource allocation and utilization. You can define resource limits and requests for each microservice, ensuring fair distribution of resources and preventing resource starvation.

  1. Rolling updates and rollbacks

With Kubernetes Deployments, you can seamlessly perform rolling updates for your microservices, enabling you to release new versions without service disruption. In case of issues, you can quickly roll back to the previous stable version.

  1. Service discovery and load balancing

Kubernetes provides a built-in service discovery mechanism that allows microservices to find and communicate with each other. Additionally, Kubernetes automatically load-balances incoming traffic across multiple replicas of a service.

  1. Automated deployment

Kubernetes enables the automation of microservices deployment. By integrating CI/CD pipelines with Kubernetes, you can automate the entire deployment process, reducing the risk of human errors and speeding up the delivery cycle.

  1. Declarative configuration

Kubernetes follows a declarative approach, where you specify the desired state of your microservices in YAML manifests. Kubernetes then ensures that the actual state matches the desired state, handling the complexities of deployment and orchestration.

  1. Version compatibility

Kubernetes supports various container runtimes, such as Docker and containerd, allowing you to run containers built with different versions of the runtime. This makes it easier to migrate and manage microservices developed with diverse technology stacks.

  1. Community and ecosystem

Kubernetes has a vibrant and active open-source community, leading to continuous development, innovation, and support. Additionally, an extensive ecosystem of tools, plugins, and add-ons complements Kubernetes, enriching the overall user experience.

  1. Observability and monitoring

Kubernetes integrates well with various monitoring and observability tools, providing insights into the performance and health of microservices.

12 tips for using microservices on Kubernetes

Creating and deploying microservices on Kubernetes involves several steps, from containerizing your microservices to defining Kubernetes resources for their deployment. Here’s a step-by-step guide, featuring our Kubernetes tips, to help you get started:

1. Containerize your microservices

Containerize each microservice and Include all dependencies and configurations required for the service to run.

2. Set up Kubernetes cluster

Install and set up Kubernetes. Depending on your requirements, you can use a managed Kubernetes service (e.g., GKE, AKS, EKS) or set up your own Kubernetes cluster using tools like kubeadm, kops, or k3s.

3. Create Kubernetes deployment manifest

Write a Kubernetes Deployment YAML manifest for each microservice: Define the desired state of the microservice, including the container image, resource limits, number of replicas, and any environment variables or ConfigMaps needed.

4. Create Kubernetes service manifest 

If your microservices require external access or communication between services, define a Service resource to expose the microservice internally or externally with a Kubernetes Service YAML manifest. 

5. Apply the manifests

Use the kubectl apply command to apply the Deployment and Service manifests to your Kubernetes cluster. This will create the necessary resources and start the microservices.

6. Monitor and scale

Observability is especially important in microservices due to the challenges posed by the distributed and decentralized nature of microservices architecture. To ensure the best user experience, it is essential to have robust tools and observability practices in place. .

Once your observability tools are up and running, consider setting up Horizontal Pod Autoscaler (HPA) to automatically scale the number of replicas based on the metrics you gather on resource utilization.

7. Continuous integration and continuous deployment

Integrate your Kubernetes deployments into your CI/CD pipeline to enable automated testing, building, and deployment of microservices.

8. Service discovery and load balancing

Leverage Kubernetes’ built-in service discovery and load balancing mechanisms to allow communication between microservices. Services abstract the underlying Pods and provide a stable IP address and DNS name for accessing them.

9. Configure ingress controllers

If you need to expose your microservices to the external world, set up an Ingress Controller. This will manage external access and enable features like SSL termination and URL-based routing.

10. Manage configurations and secrets

Use ConfigMaps and Secrets to manage configurations and sensitive data separately from your container images. This allows you to change settings without redeploying the microservices.

11. Rolling updates and rollbacks

Utilize Kubernetes Deployments to perform rolling updates and rollbacks seamlessly. This allows you to release new versions of microservices without service disruption and easily revert to a previous stable version if needed.

12. Security best practices

Implement Kubernetes security best practices, such as Role-Based Access Control (RBAC), Network Policies, and Pod Security Policies, to protect your microservices and the cluster from potential threats.

What to find out more? Check out our introduction to Kubernetes observability for best observability practices with Kubernetes.


Lookup Tables and Log Analysis: Extracting Insight from Logs

Extracting insights from log and security data can be a slow and resource-intensive endeavor, which is unfavorable for our data-driven world. 

Fortunately, lookup tables can help accelerate the interpretation of log data, enabling analysts to swiftly make sense of logs and transform them into actionable intelligence. 

This article will examine lookup tables and their relationship with log analysis. We’ll explore how lookup tables, in conjunction with a full-stack observability platform, extracts insights from logs, as well as dive into several practical use cases. 

What are lookup tables? 

A lookup table, or a reference table, is a specific type of data structure used to simplify data lookup operations. Lookup tables contain a set of values or information that can be used to quickly find corresponding values in another dataset.

They are especially useful for mapping one value to another, such as converting a code to a meaningful description. When it comes to log analysis, lookup tables can add relevant context to your logs, enhancing the efficiency, accuracy, and consistency of log analysis. This is particularly valuable when dealing with obscure or unclear log data that requires contextual information for users to understand any given situation and to take appropriate action.

Here’s several use cases where lookup tables can be applied for greater business efficiency and compliance.

Error code interpretation for faster root cause analysis and time to resolution

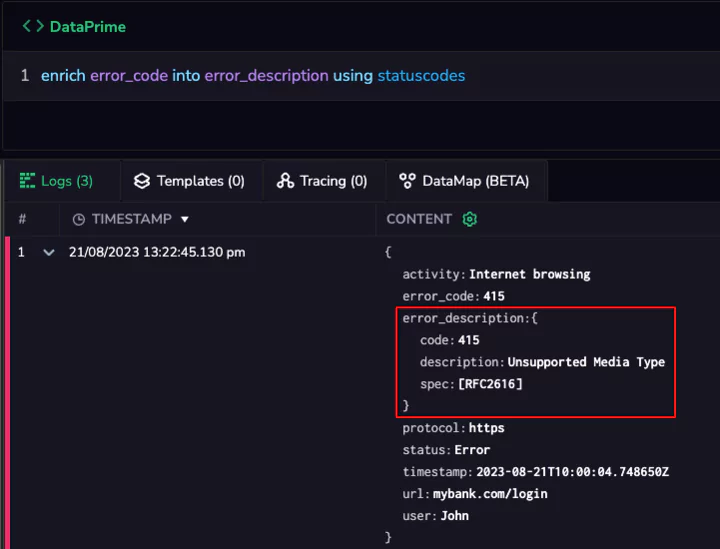
Logs often contain error codes or status indicators that need interpretation. With lookup tables, you can translate these codes into meaningful explanations to boost your observability, such as 

enhanced troubleshooting, reduced downtime and improved system reliability.

Lookup tables also reduce the time and effort required for manual code interpretation. Furthermore, clear error code translations enable quicker time to resolution, leading to lower operational costs and enhanced customer experience.

See example below. For more details and syntax, see our documentation.

Detecting unauthorized access to cloud resources 

In cloud environments, multiple users, teams, and applications interact with a diverse range of resources. These resources can include databases, VMs, storage buckets, and more.

Ensuring that only authorized users access specific resources is crucial for maintaining data integrity and security. Detecting unauthorized access quickly is paramount, as it can prevent potential data breaches, financial losses, and reputational damage.

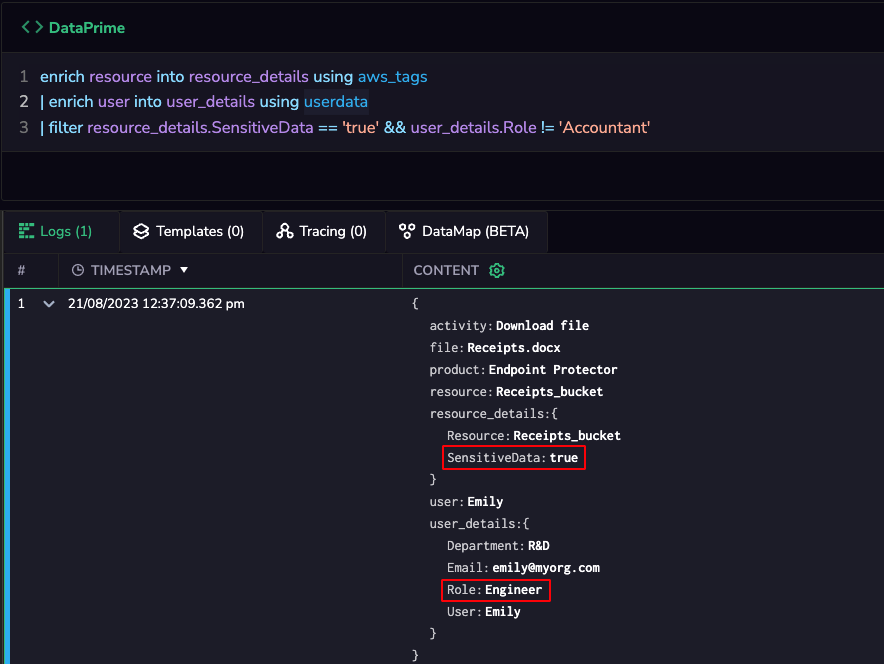
By incorporating information from lookup tables directly into log entries, you can provide analysts with more context, making it easier for them to identify and respond to unauthorized access attempts. For instance, if an analyst is reviewing log entries related to user interactions with cloud resources, the lookup table can bring context on the user role (e.g. based on identity store) and the sensitivity level of the cloud resource (e.g. based on AWS resource tags). 

You’ll be able to quickly identify unauthorized access to sensitive data, improve your organization’s security posture and adhere to compliance requirements.  

See example below. For more details and syntax, see our documentation.

User behavior profiling for better product development and targeted marketing

Analyzing user behavior through logs can reveal patterns and preferences that guide product development and marketing efforts. Lookup tables can match user IDs with customer profiles, enabling deeper analysis and personalization – without wasting any time searching through extensive databases for each log entry. 

By enhancing user behavior understanding, you can develop targeted and cost-effective campaigns while improving customer satisfaction.

Product SKU mapping for better inventory management and increased sales

E-commerce businesses can analyze log data to track product popularity, availability and customer buying patterns. Lookup tables that map SKU codes to product names enable efficient product performance analysis. 

With instant access to product names based on SKUs, you can eliminate the need to query product databases repeatedly. As a result, you’ll be able to optimize inventory management, pricing strategies, and marketing campaigns, which can help increase revenue and reduce inventory costs.

Enhanced log analysis with Coralogix Lookup Tables

Coralogix’s next-generation query language, DataPrime provides users with a unique way to describe event transformations and aggregations.

Using DataPrime, map your logs dynamically to the relevant lookup table for any on-the-fly query. The lookup and enrichment can be done as part of your query even on logs that have already been ingested and stored. 

The added fields can be used to further filter within the DataPrime query. For example, say you added a “Department” key. You can then filter the results by a specific value of “Department,” e.g. Finance.

Furthermore, with Coralogix Lookup Tables, the on-demand enrichment is available while viewing the specific query results or visualization without affecting the original log size. This helps optimize your overall observability costs.

Coralogix also offers log enrichment where during ingestion, the logs are automatically looked up, enriched and stored, for easy consumption anytime and anywhere (by any query and by third-party products that read the logs from the S3 bucket). 

Visit our documentation for more details

A Complete Guide to Tracking CDN Logs

The Content Delivery Network (CDN) market is projected to grow from 17.70 billion USD to 81.86 billion USD by 2026, according to a recent study. As more businesses adopt CDNs for their content distribution, CDN log tracking is becoming essential to achieve full-stack observability

That being said, the widespread distribution of the CDN servers can also make it challenging when you want visibility into your visitors’ behavior, optimize performance, and identify distribution issues. Thankfully, CDN logging provides a solution to these issues. 

In this article, we’ll dive into what CDN logs are, how to track them and the kind of data you should be extracting from them.

Understanding CDN logs

CDNs speed up content delivery and improve user experience by caching assets like images and videos on edge servers distributed across the globe. And CDN logs curate data on all requests accessing your website or app through the CDN.

These include data like request URLs, response codes and time, client IP addresses, request times, caching information and the geolocation of requests. CDN log data can also help you determine who is accessing your app or website, where they are accessing it from and the type of data they access.

CDN logs typically follow a common log format, with some variation between providers. Here is a general outline of the information you’ll typically find in a CDN log:

  • Client IP address: The IP address of the user or device accessing your content through the CDN. 
  • Request time: The date and time the request was made, in UTC. 
  • Request URL: The full URL that was requested. 
  • Response code: The HTTP response code returned for the request, such as 200 (OK), 404 (Not Found), etc.
  • Cache status: Whether the requested resource was served from cache or fetched from the origin. 
  • Request method: The HTTP method used, typically GET but sometimes POST.
  • Server IP: The IP address of the specific CDN server or POP that served the request.
  • Object size: The size of the requested object, in bytes. 
  • Geolocation: The location of the requesting client, such as country and sometimes city or region. 

Most major CDN providers offer logging and analytics dashboards as part of their service, often for an additional fee. You can configure some CDNs to send their logs to a third-party analytics or logging system for further CDN log analysis.

What is CDN tracking exactly?

CDN tracking typically involves CDN monitoring tools and software that collect data on user interactions with CDN-delivered content. This data can include the user’s geographic location, device type, browser type, and the specific content items accessed. Analyzing this data helps you to identify patterns and trends in user behavior, and make informed decisions about how to optimize content delivery for different user segments.

CDN monitoring tools integrate with the CDN provider’s APIs to access real-time metrics and log data those APIs expose. They also allow you to analyze and report on that data within a central dashboard or interface.

CDN monitoring tools simplify the process of tracking your CDN logs by providing;

  • centralized monitoring of multiple CDNs in one place
  • standardized reporting and dashboards across CDNs and
  • advanced analytics capabilities not available in the CDN provider’s native tools

With the advanced tracking capabilities provided by CDN monitoring tools, you can extract all kinds of useful data from your CDN logs with ease. Let’s look at some data types you can extract from your CDN logs and how to use them.

What to extract from CDN logs?

Collecting CDN log data allows you to monitor the usage and performance of your CDN. By analyzing this data with a tool like Coralogix, you can identify performance bottlenecks, troubleshoot errors, and optimize CDN configurations to ensure fast and reliable content delivery.

CDN logs can be categorized based on the type of data they provide in 6 different types, as outlined below: 

1. Access logs

These logs provide information about every request made to the CDN, including the time of the request, the IP address of the requester, the HTTP status code, the requested URL, and the size of the response.

Use access logs to identify resources that are being accessed most frequently, which helps you with optimizing caching, CDN configurations, and resource allocation. Access logs also allow you to  identify and troubleshoot issues with specific URLs or origin servers. For example, if a particular URL is returning a 404 or 500 error code, access logs can be used to identify and investigate the root cause of the error.

2. Error logs 

Error logs only capture information about errors that occur while processing requests, such as 404 errors or 500 errors. They help you find and troubleshoot issues with specific requests, such as missing resources or incorrect server configurations.

Error logs can also be used to monitor and investigate errors in real-time, and take corrective actions to ensure uninterrupted service.

3. Performance logs

Performance logs contain real-time information about the performance of the CDN, including the response time, the number of requests served, and the number of requests that were cached.

They also let you optimize the CDN configuration by adjusting cache expiration times or configuring load balancing. Use performance logs to monitor and analyze the performance of the CDN infrastructure, and identify performance bottlenecks that could impact user experience.

4. Security logs

Security logs detail information about security-related events, such as failed login attempts or attacks on the CDN infrastructure. These logs can be used to monitor and detect suspicious activity, such as brute-force attacks or DDoS attacks.

You can also use security logs to identify and mitigate security threats, such as by blocking IP addresses or implementing rate limiting.

5. Analytics logs 

Analytics logs provide information about user behavior, such as the geographic location of users, the devices they are using, and the pages they are accessing. These types of logs help you understand user behavior and optimize the user experience, such as by optimizing page load times or improving content delivery.

They can be used to monitor and analyze user behavior, and identify patterns and trends that could impact the performance of the CDN infrastructure.

6. Real-time logs 

Real-time logs are generated in real-time and they provide information about the requests being processed by the CDN, enabling administrators to monitor and respond to issues as they occur.

These logs can be used to troubleshoot issues in real-time and ensure uninterrupted service. For instance, when you make changes to your CDN configuration, use real-time log analysis to validate the new settings are working as expected and alert you to any unintended consequences.

CDN log monitoring with Coralogix

Coralogix’s full-stack observability platform comes equipped with in-stream data analytics that allows you to collect and centralize CDN logs from various CDN services. Analyze these massive CDN logs in real-time without indexing using their Streama© streaming analytics engine.

The platform lets you set up real-time alerts on CDN logs to detect issues, outliers, and anomalies, while their in-stream alerting feature correlates events across log, metric, and trace data. CDN tracking with Coralogix is a seamless process. 

First, use Coralogix’s integrations with CDNs, such as Akamai or Amazon CloudFront, to collect and stream CDN logs directly to the dashboard. Once logs are collected, Coralogix’s search and filtering capabilities help you query and analyze the logs, create real-time alerts and dashboards to monitor CDN performance metrics and detect issues.Then, try integrating CDN log data with other contextual data, such as application logs, metrics, and traces, to gain a comprehensive view of issues impacting CDN performance.

Furthermore, with the help of CDN monitoring tools, gain valuable insights into how your CDN is performing and identify any issues affecting your content distribution. Investing in a robust CDN monitoring solution will improve the efficiency of your content delivery networks. CDN monitoring tools will work effectively to serve users the content they want, when and where they want it.