Coralogix and New Relic both cover the full observability surface, but they charge for it and store it in different ways. One prices purely on data ingested and writes telemetry to a bucket you own, while the other combines ingest pricing with per-user licensing and retains data in its own backend.
This guide covers how the two platforms compare on core features, pricing structure, AI observability, archiving and retention, security coverage, and support, then shows when each one is the stronger choice.
What Is Coralogix?
Coralogix is a full-stack observability platform whose architecture targets the two line items that grow fastest on a New Relic bill: user licensing and vendor-side retention.
Its Streama© engine parses, enriches, and alerts on logs, metrics, traces, and security data before anything reaches storage, and the destination is an Amazon Simple Storage Service (S3) bucket you own, written in open Parquet format. Pricing is per gigabyte ingested; user count, host count, and query volume never appear on the invoice.
What Is New Relic?
New Relic is a full-stack observability platform that runs on a usage-based model combining per-gigabyte ingest with per-user fees. It treats OpenTelemetry (OTel) as a first-class ingestion path alongside its own agents, with application performance monitoring (APM) as its historical core strength. As of June 2026, a free tier covers 100 gigabytes of ingest per month with core platform features included.
Coralogix vs. New Relic: What Are the Key Differences?
For high-volume, cloud-native teams, the most important differences involve data volume, user count, and compliance requirements. Each dimension reflects how the platform is built, not a feature checkbox.
| Dimension | Coralogix | New Relic |
| Pricing model | Ingestion-based, with no per-host, per-query, or per-feature charges | Per-gigabyte ingest ($0.40/GB, or $0.60/GB with Data Plus, beyond 100 GB/month free) plus per-user fees |
| Starting price | Logs $0.42/GB, traces $0.16/GB, metrics $0.05/GB ingested | Free up to 100 GB/month, then $0.40/GB plus user fees |
| Per-user fees | None; unlimited users included | Basic users free; Core $49/user/month; Full Platform priced by edition |
| Data retention | Indefinite; data stored in customer-owned S3 | Defaults vary by data type (logs 30 days); extensions via Data Plus and live archives |
| Archive and remote query | Free queries on all archived data; no rehydration | Live archives extend log storage up to seven years |
| OpenTelemetry support | OpenTelemetry-native architecture; no proprietary agents | OpenTelemetry Protocol (OTLP) accepted as a first-class path alongside proprietary agents |
| AI observability | AI Center with built-in Evaluation Engine, AI Guardrails, and session tracing | AI monitoring extends APM agents to track tokens, latency, errors, and cost per model |
| Security Information and Event Management (SIEM) | Cloud SIEM included | Security capabilities center on vulnerability management |
| Support | 24/7 support included for all customers; 17-second median response | Varies by edition; ticketed support on Standard, faster critical-response commitments on Pro and Enterprise |
Coralogix prices and stores data on your side of the account boundary, while New Relic prices access to its platform. Each section below shows what the difference costs in practice.
Core Features: Logs, Metrics, Traces, and Alerting
Coralogix and New Relic support core observability workflows across logs, metrics, distributed traces, APM, real user monitoring (RUM), and infrastructure monitoring. Feature parity at this level means the comparison turns on how each platform handles the work around the signals: correlating them during an investigation and alerting them without noise.
Coralogix covers that baseline with an OpenTelemetry-native architecture and no proprietary agents, including Kubernetes observability and a service catalog with service level objective (SLO) tracking.
Data Correlation and Usability
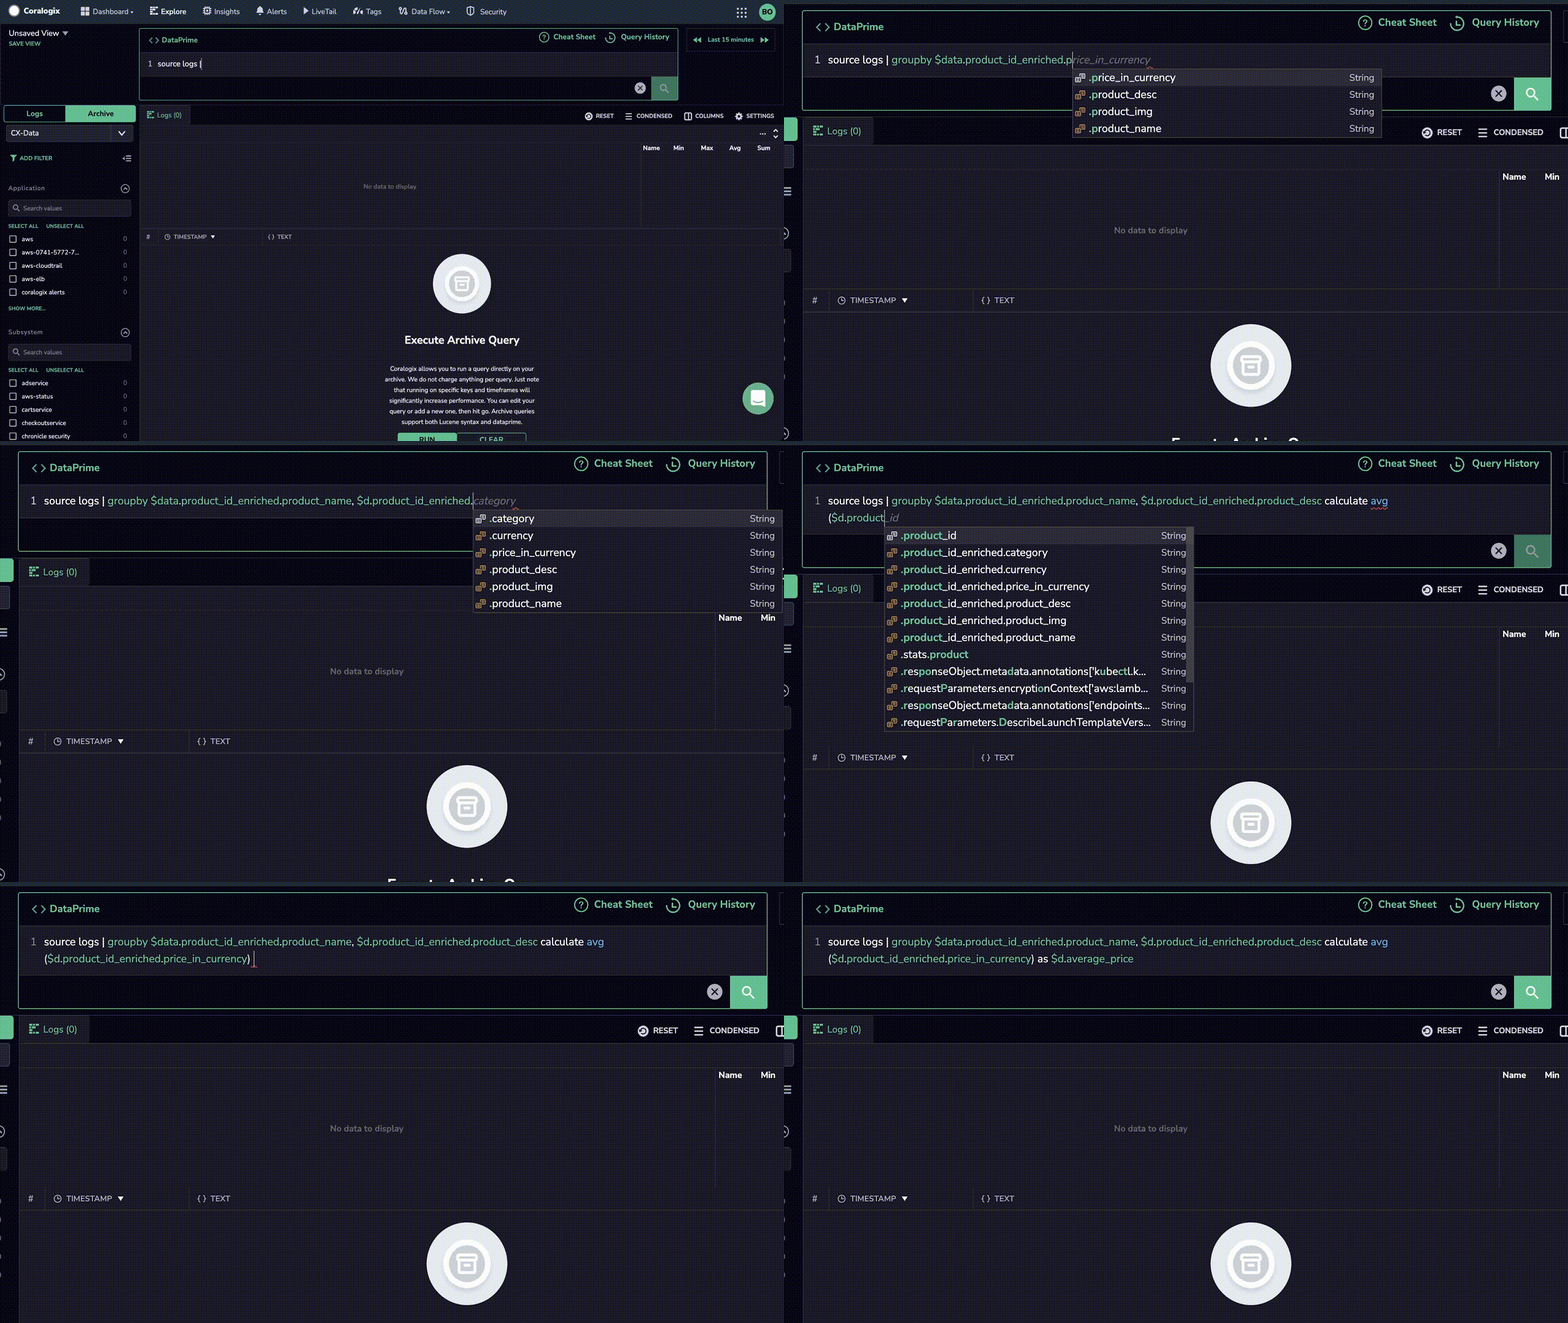
Investigations stall when each telemetry type lives behind its own query tool, because every context switch resets an engineer’s train of thought mid-incident. Coralogix supports querying logs, metrics, and traces across its platform, using the piped DataPrime query language, with Lucene available for hybrid queries and PromQL supported separately for metrics dashboards.
New Relic Query Language (NRQL) covers similar cross-telemetry ground, so the separation shows up when the query language itself becomes the obstacle.
Olly, Coralogix’s autonomous observability agent, takes a plain-English question, runs the investigation itself, and returns the root cause with the affected code path, no DataPrime required.
Alerting Across Logs, Metrics, Traces, and Security Events
Multi-signal incidents produce alert noise when each signal fires its own notification: a latency spike, an error-rate alarm, and a security event arrive as three pages instead of one diagnosis. Flow Alerts treat the sequence itself as the alert condition across logs, metrics, traces, and security data: condition A followed by condition B inside a set window fires one priority-one (P1) notification, and an incomplete pattern fires nothing.
AI Capabilities: Coralogix vs. New Relic
Both vendors instrument large language model (LLM) workloads, but they answer different questions. New Relic tracks the operational metrics of artificial intelligence (AI) calls, while Coralogix also evaluates the outputs those calls produce, with built-in guardrail enforcement on top. That difference in scope is where the two platforms separate.
How Coralogix AI Center Evaluates LLM Outputs
A passing health check says nothing about whether the model hallucinated, drifted off topic, or leaked personally identifiable information (PII) in a response. AI Center, launched following the December 2024 acquisition of Aporia, answers that question directly: its Evaluation Engine runs evaluators, small evaluator models with optional custom rules, that score every prompt and response for faithfulness, relevance, toxicity, and PII leakage.
Past detection, AI Guardrails block, rewrite, or flag unsafe prompts and responses inline before they reach the user. Instrumentation runs through LLM TraceKit, an OpenTelemetry-based software development kit (SDK), while code agent observability covers tools like Claude Code, Codex CLI, and Gemini CLI through their built-in OpenTelemetry Protocol telemetry.
New Relic AI Monitoring on Existing APM Agents
New Relic AI monitoring extends the APM instrumentation teams already run. Running on an existing agent, it traces agentic workflows, pinpoints latency per agent and tool, identifies which step in a chain failed, and tracks token consumption per model as a cost driver.
Applied Intelligence handles anomaly detection and incident correlation across the wider platform, and New Relic AI answers natural-language queries. The difference in this comparison sits at output quality: New Relic reports what an LLM call cost and how long it took, while Coralogix also scores what the model said and can act on it.
Security: SIEM and CSPM on the Same Pipeline
Running observability and security monitoring as two separate vendors fragments the data layer: the same logs get shipped twice, paid for twice, and queried in two different languages. Security packaging decides how much of that duplication a platform removes.
| Capability | What it covers | Coralogix | New Relic |
| SIEM | Detecting threats across your logs and security telemetry | Cloud SIEM included, with out-of-the-box threat detections on the same in-stream pipeline as the rest of the platform | Not offered; teams that need SIEM coverage pair New Relic with a separate security vendor |
| CSPM | Finding risky configurations in cloud infrastructure | Included across Amazon Web Services (AWS), Azure, and Google Cloud Platform (GCP) | Not offered; as of June 2026, security capabilities center on vulnerability management |
Teams that want SOC coverage without staffing one get a managed option on the Coralogix side: Snowbit, Coralogix’s managed security arm, provides managed detection and response inside your Coralogix tenant, working from the same telemetry the engineering team already ships.
Pricing: Ingestion-Based vs. Ingest Plus Per-User Fees
Coralogix charges only for data volume, while New Relic adds user licensing on top of ingest. That difference compounds as teams grow and shapes how predictable your observability budget will be year over year. For buyers focused on controlling spend, the pricing model carries as much weight as feature depth.
Ingest-Only Billing on Coralogix
Every charge on a Coralogix invoice maps to ingested data: [unit-based ingestion pricing] converts units to gigabytes at rates set per pipeline, and unlimited users and hosts come with every plan.
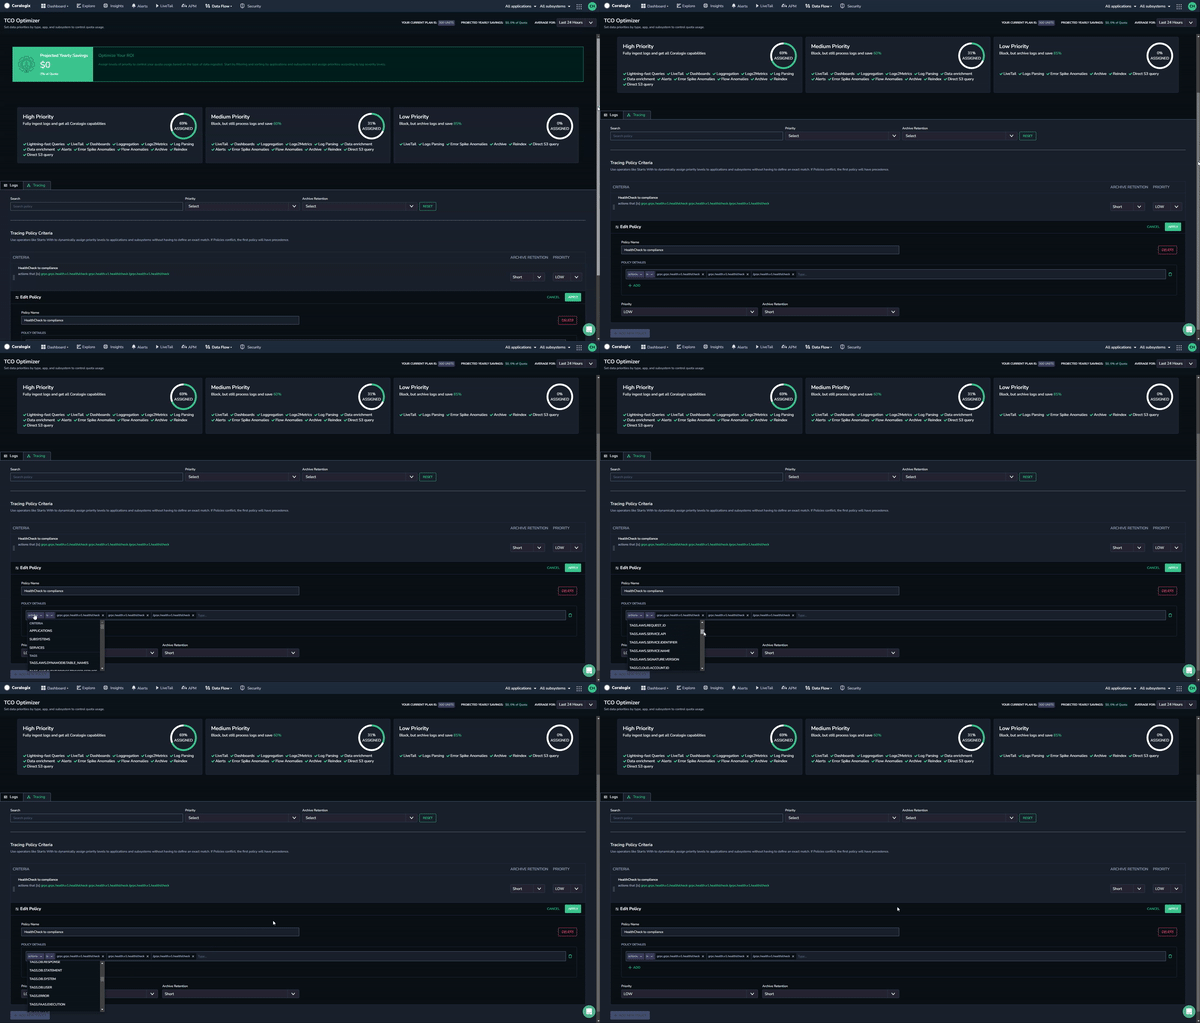
Per-user, per-host, per-query, and per-feature charges do not exist in the model. The TCO (total cost of ownership) Optimizer assigns each data stream to the Frequent Search, Monitoring, Compliance, or Blocked pipeline based on how the data is used, so a debug stream bound for the archive never bills at the rate of data your team searches daily.
New Relic’s Ingest and Per-User Pricing
New Relic’s per-user pricing splits across Basic (free), Core ($49 per user per month), and Full Platform tiers, with Full Platform rates set by edition. Ingest beyond the free 100 gigabytes per month bills at $0.40 per gigabyte on the original data option, or $0.60 per gigabyte with Data Plus. For teams with dozens of full-platform users, user fees become a major part of total platform cost.
What a Typical Workload Costs on Each Platform
For a team ingesting a high volume of logs per day with multiple full-platform users, the annual cost profile differs because Coralogix doesn’t add user-based charges on top of ingest. Twenty full-platform users on New Relic’s Pro edition add $6,980 per month in user fees before any data charges, while the same twenty users cost $0 on Coralogix. Archive storage also follows a different pattern because Coralogix stores data in the customer’s own S3 bucket instead of a vendor-owned store.
Archiving and Archive Query
Long-term retention usually forces a choice between vendor storage fees and losing searchability. Coralogix writes all telemetry data to your own cloud object storage, including Amazon S3 or Google Cloud Storage, in open Parquet format after in-stream processing. It stays accessible indefinitely at standard object storage costs, with no vendor-side retention limits or rehydration steps. Streama processes the data in flight before it lands, so the archive holds full-fidelity telemetry in a format any Parquet reader can open, with or without Coralogix in the picture.
Data Retention Limits Compared
Default retention on New Relic varies by data type, with logs retained 30 days by default and Data Plus adding up to 90 days of retention for most data types. Live archives extend log storage up to seven years for teams with compliance requirements. Coralogix stores data in your S3 bucket with no retention limit. Logs compress when written to S3, which reduces effective storage cost, and your S3 lifecycle policies control retention.
Remote Queries on Unindexed Data
Coralogix’s remote query capability lets your team search archived data directly from the platform without reindexing or rehydration. Archived queries run from Explore using the same text, Lucene, or DataPrime query syntax as live searches, and archived data stays searchable alongside live data streams.
Your data remains in customer-owned cloud object storage, and there’s no additional charge for archive queries. For compliance logs routed to the Compliance pipeline, ongoing costs after the initial ingest charge drop to the S3 storage fee alone, which supports long-term retention for forensic and audit requirements.
Support and Response Times Compared
Every Coralogix account includes 24/7 support from software engineers at no extra cost, with a 17-second median response time and a one-hour median resolution time across all support requests. Coralogix has no premium support tiers, so the team paging at 3 a.m. gets the same access as the largest account.
New Relic’s support varies by edition, with ticketed support on Standard and faster critical-response commitments on the Pro and Enterprise editions.
Coralogix vs. New Relic: Which One to Choose
The decision comes down to which requirements are driving your evaluation.
Where New Relic Still Fits
If your evaluation turns on mature agent-based APM with deep auto-instrumentation under a single software as a service (SaaS) contract, New Relic meets that requirement today. The free tier and broad language coverage suit smaller teams standardized on proprietary agents. The user-based cost component stays manageable only while full-platform seat counts stay low.
The Coralogix Case: Volume Pricing, Owned Storage, Security Included
Choose Coralogix when your team prioritizes predictable costs at high data volumes, needs to query archived data without rehydration fees, or wants to consolidate observability and security, including SIEM and CSPM, in a single platform. The customer-owned storage model in open Parquet format also reduces long-term vendor lock-in risk.
No User Fees and Data You Own: The Coralogix Approach
The comparison comes down to what you pay for and where your data lives. Coralogix bills only on ingested volume, processes telemetry through Streama before it lands in an S3 bucket you own, and keeps every archived byte searchable without rehydration, while New Relic prices platform access through user licenses on top of ingest and retains data in its own backend. Every difference this guide covered, from per-user fees to retention ceilings to support tiers, follows from that structural choice.
If you want to see what removing per-user fees does to your observability bill, try Coralogix for free on a 14-day trial against your own production traffic. The trial includes full feature access for unlimited users with no credit card required.
Frequently Asked Questions About Coralogix vs. New Relic
Is Coralogix cheaper than New Relic?
For teams with dozens of engineers accessing the platform, Coralogix is often more cost-effective because it prices by data usage with no per-user fees. Full platform user licenses can become the dominant cost driver as your team grows on user-priced products. At high data volumes with few users, the cost comparison depends on how you route data through Coralogix’s TCO Optimizer pipelines.
Does New Relic charge per user?
Yes. As of June 2026, New Relic prices users in three types: Basic (free), Core ($49 per user per month), and Full Platform, which is priced by edition and carries the highest rates. User fees apply on top of data ingest charges.
Can Coralogix replace New Relic for APM?
Coralogix covers distributed tracing, service catalog with SLO tracking, and more, all built on OpenTelemetry. Teams running OpenTelemetry-instrumented services can migrate without changing their instrumentation. Organizations that rely heavily on agent-based auto-discovery should evaluate the OpenTelemetry-native path during a proof of concept.
How long does New Relic retain data by default?
Default retention varies by data type, with logs retained 30 days by default and Data Plus adding up to 90 days for most data types. Coralogix can retain archived data indefinitely in your own S3 bucket, with retention controlled by your S3 lifecycle policies and storage charged through your object storage.
Does Coralogix support OpenTelemetry natively?
Coralogix runs on an OTel-native architecture with no proprietary agents required. The platform accepts OTLP for logs, metrics, and traces.