Elasticsearch Tutorial: From Deployment to Basic Usage

Elastic is “an index”, “a search engine”, “a big data solution”, an analytics platform with advanced data visualizations and incredibly fast search capabilities. In short, it’s a solution for many problems.

The Elasticsearch platform provides a distributed search cluster that enables large amounts of data to be indexed and searched at scale. It has quickly become the perfect solution for e-commerce applications, dating apps, log collection, weather analysis, government planning, Cyber Security, IoT, and much much more.

The key features of Elasticsearch provide distributed advanced search and aggregation of data, whilst providing high availability, security, and other data management features. 

In this intro to Elasticsearch tutorial, we are going to explore the power of Elasticsearch and cover the basics of how to use it.

Note: This tutorial will help you get started using Elasticsearch. It assumes that you’ve already weighed the pros and cons of using Elasticsearch in your particular instance, especially considering Elastic’s new SSPL license change.

Getting Started

Elastic hides the complex search and distribution infrastructure from beginners, allowing you to start with a basic understanding and gradually increase your knowledge to unlock additional benefits along the way. 

This post will cover everything you need to know to get started, including:

  • Deploying Elastic with Docker
  • Creating and deleting indices
  • Editing documents
  • And more! 

How does Elasticsearch work?

Elasticsearch operates by retrieving and managing semi-structured data and document-oriented objects. The internal workings of Elasticsearch use the “shared nothing” architecture. Elasticsearch uses Apache Lucene’s under the hood which is an inverted index as its primary data structure.

How is information stored in Elasticsearch?

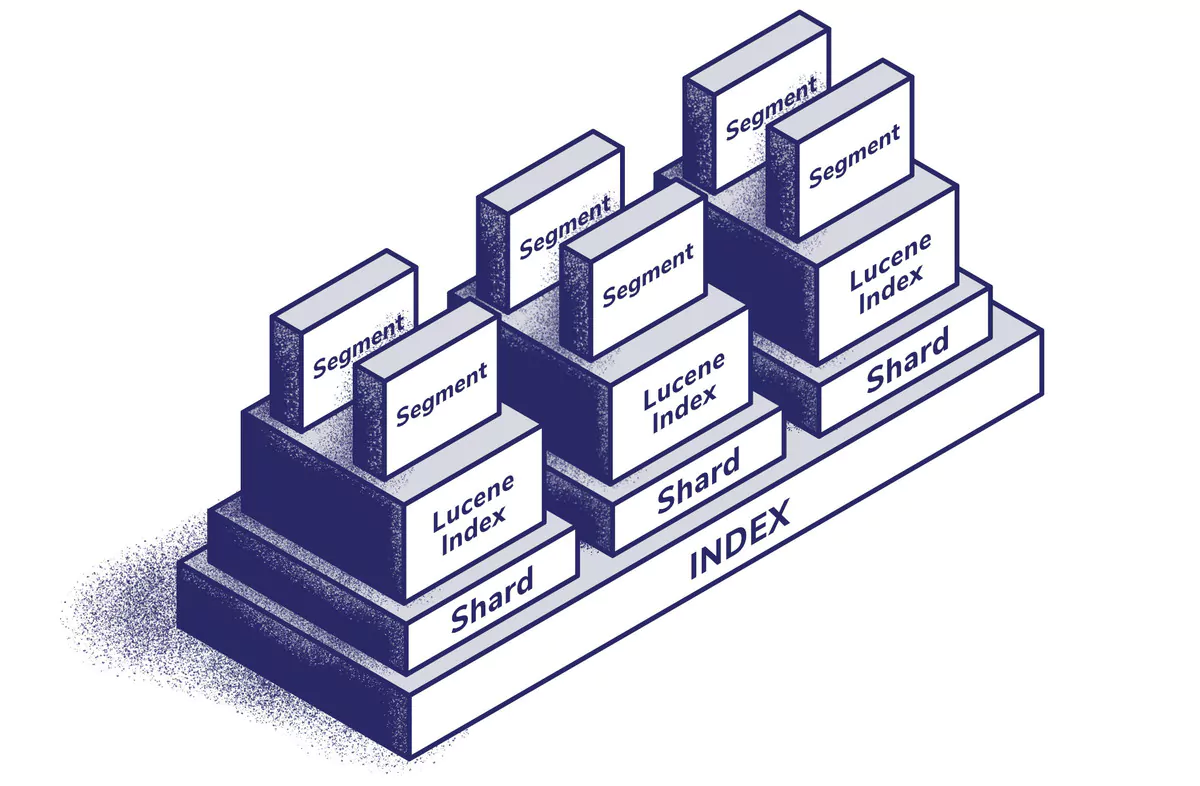
In its rawest form, Lucene is a text search engine. It stores text in a custom binary format which is optimized for retrieval purposes. Lucene’s architecture is that of “indices containing documents”. Each index consists of several segments and these segments are saved in several files inside the Elasticsearch platform. Documents are split up into several lookup structures, which reside in the files. 

If you browse the data folder on an elastic node you will see the above Lucene index and segment structure. Instead of storing JSON formatted data on the filesystem, the files contain optimized binary data which is accessed via the Elasticsearch API. This API provides the data as JSON. 

elasticsearch

How does Elasticsearch find information?

When it comes to searching the data in Elasticsearch, Elastic uses an inverted index. This in its most basic form provides a mapping of each unique ‘word’ to the list of documents containing that word. This process is what enables Elastic to locate documents with given keywords so quickly.

Can Elasticsearch work across multiple nodes?

Elastic is a distributed platform, meaning it’s designed to run across multiple nodes. Multiple nodes form a cluster. Each of the nodes in a cluster has Index information stored in one or more partitions, these are referred to as shards. The Elasticsearch platform is capable of dynamically distributing and allocating shards to nodes in the cluster. Elasticsearch also provides the capabilities to replicate shards to nodes for resilience. 

This process and capability enable the platform to be highly flexible with data distribution, which provides great capabilities to protect data stored within an Elastic cluster.

Deploying Elasticsearch

For this post, we’ll set up and run a single node instance however in production the Elastic Stack can be deployed on-premises, in the cloud, in docker, and a number of other ways. The requirements for the base infrastructure remain mostly the same. Firstly, and most importantly, you are going to want a minimum of three nodes (Virtual Machines or Containers).

TIP – You should ideally design this to span multiple zones to build a fully resilient cluster. For example, in the Cloud, you want to ensure you have nodes sitting in different zones to mitigate risks of outages. 

Prerequisites

For this tutorial, you will need to meet the following prerequisites:

  • Docker
  • 1 GB of Storage
  • Knowledge of CURL
  • Knowledge of Terminal

We will use Docker to quickly get an Elasticsearch instance up and running. If you haven’t used Docker before, you can jump over to their website to get yourself familiar. 

There are a number of ways to deploy Elasticsearch. The goal of this article is to get you up and working in the shortest possible time. We are going to build a single node cluster to demonstrate the power of Elastic, but this should only be used for development and testing environments.

TIP –  Never run an Elastic cluster on a single node for production.  

Deploying to Docker

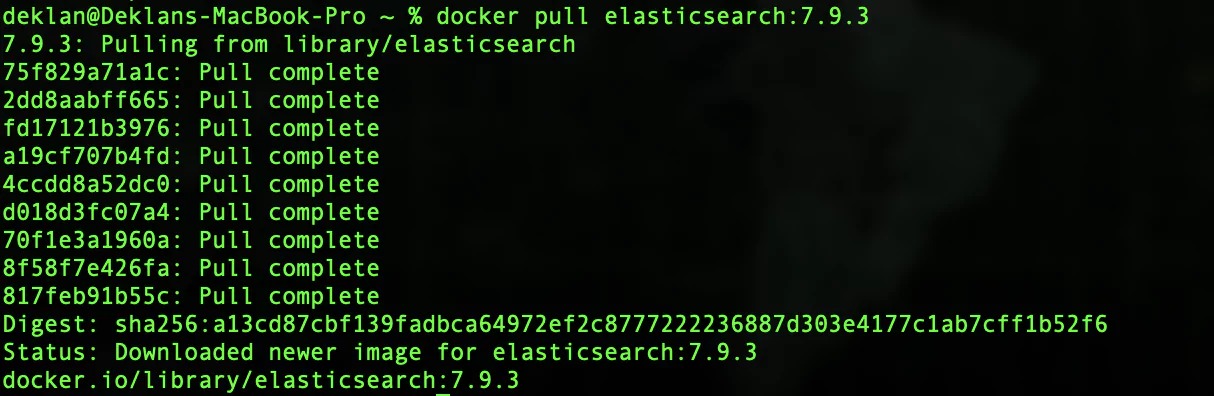
Let’s get Elasticsearch deployed. As we are going to run this in docker jump into a terminal session and pull the Elastic image. In this tutorial, we are going to use version 7.9.3. To pull the images to your machine run the below:

docker pull elasticsearch:7.9.3

Pulling the image should look like this:

pull images to machine

Now that you have the image it’s time to run the image in a container. Elasticsearch will need a few ports to be forwarded to our localhost so we can access the Elasticsearch services. We will forward port 9200 which is the Elasticsearch API. We also add the configuration for a single development node ‘-e discovery.type=single-node’

docker run -d --name elasticsearch -p 9200:9200 -e "discovery.type=single-node" elasticsearch:7.9.3

Running the container should look like this:

running container

The returned string is the docker container id. This now means that the image is running. We can verify that this is the case by running docker ps.

docker ps

This will now list all running docker containers:

all running containers

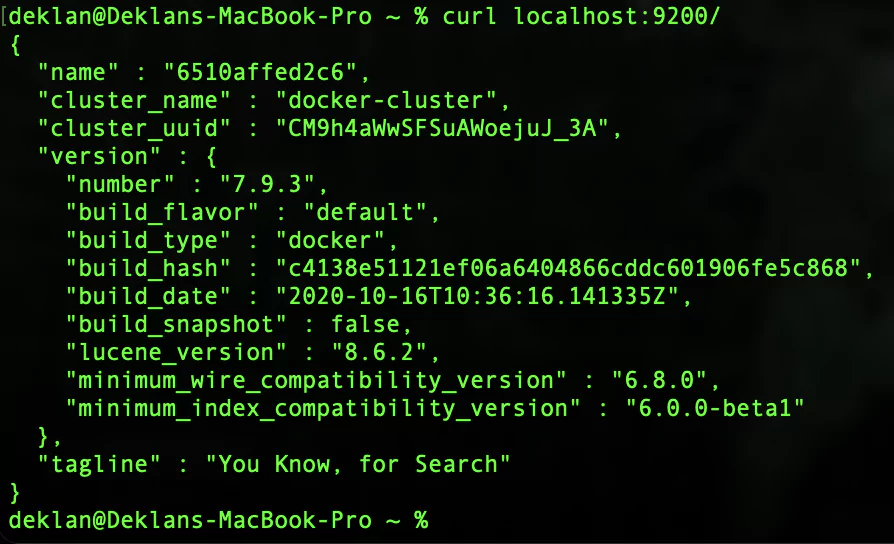
Great, so the image is now running as a container on your local machine. Let see if we can access the Elasticsearch API. A simple GET request to our localhost should connect to the Elasticsearch container when we use port 9200. Using curl lets see if our container is working:

curl localhost:9200/

You should receive the below from your GET request:

connect with GET request

Nice! You now have a local container running Elasticsearch. You can now start and stop your Elastic container with the following:

To stop the container:

docker stop elasticsearch

To start the container:

docker start elasticsearch

Creating an Index

Now that we have a working Elasticsearch container it’s time to add some data to it. Adding data to Elasticsearch streams the data into an Apache Lucene Index under the hood. Elasticsearch then uses the Lucene indexes to search and retrieve data. Whilst it is not a requirement to know a lot about the working of Lucene, it most certainly helps when you start to get serious with Elasticsearch!

Elasticsearch is presented as a REST API. This means that you can either use POST or PUT methods to add data to the platform. The PUT method is used when you want to specify the id of the data item and POST is used when you want Elasticsearch to generate an id for the data item. You use the GET method to pull data back out of Elasticsearch. But more on that later!

Let’s add some data to Elasticsearch: 

curl -XPOST 'localhost:9200/logs/test' -H 'Content-Type: application/json' -d'

{

        "timestamp": "2020-12-05 12:24:00",

        "message": "Adding data to Elasticsearch",

        "reason_code": "01",

        "username": "Deklan"

}

'

In this test example, we are using JSON to format our input. We are creating a record containing a timestamp, a message, a reason code, and a username. You can of course structure the data as required for your use case. Running the command results in the below:

create record elasticsearch

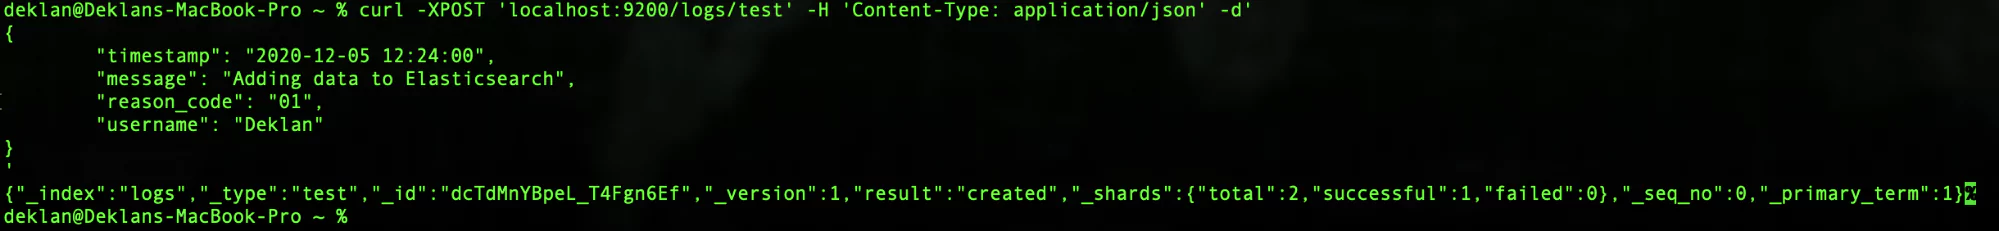
We can see that the request was accepted and Elasticsearch returns information about the request that was processed. 

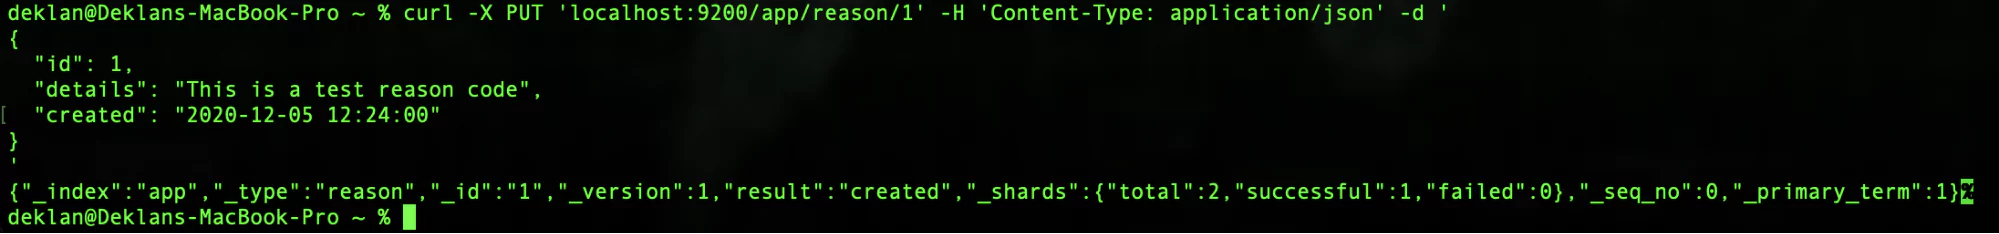
Let’s take a look at using the PUT method to create a record with a specific ID. In this example, we are creating a reason code that will be used in our first record.

curl -X PUT 'localhost:9200/app/reason/1' -H 'Content-Type: application/json' -d '

{

  "id": 1,

  "details": "This is a test reason code",

  "created": "2020-12-05 12:24:00"

}

'

If all has gone well your response should look something like this:

create a record with PUT

So now we know how to put data into Elasticsearch. At this point, you might be asking yourself, how can we index the data if we didn’t define a data structure? Well, this is the magic of Elasticsearch, you don’t need to. Elasticsearch will pull everything together for you, but it is possible to tweak your indexes when you are looking to get the best possible performance out of Elasticsearch. 

Let’s see what indices have been created in our Elasticsearch instance:

curl -XGET 'localhost:9200/_cat/indices?v&pretty'

Your response should look like this:

view indices

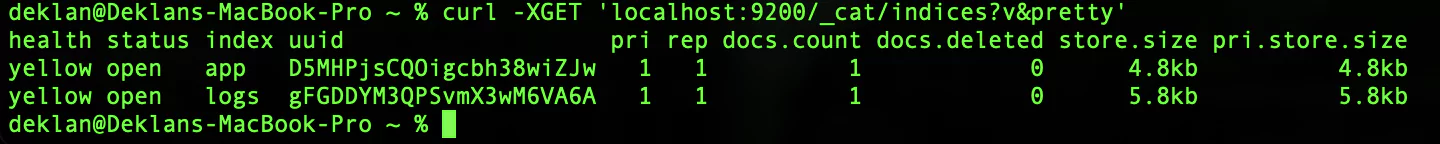
Great, so we can see that we have created one index called ‘app’ & one called ‘logs’. We can also see data relating to the indexes such as the number of documents and the store size.

Querying Elasticsearch

Things are starting to get exciting in this Elasticsearch tutorial now! We have data in our Elasticsearch instance and we are now going to explore how we can search and analyze it. The first method you should know is to fetch a single item. As discussed above we will now use the GET method to request data from the Elasticsearch API.

To request a single record we use the below. 

Tip – The ‘?pretty’ at the end of the request will return the data in a more human understandable format.

curl -XGET 'localhost:9200/app/reason/1?pretty'

Your response should look like this:

request a single record

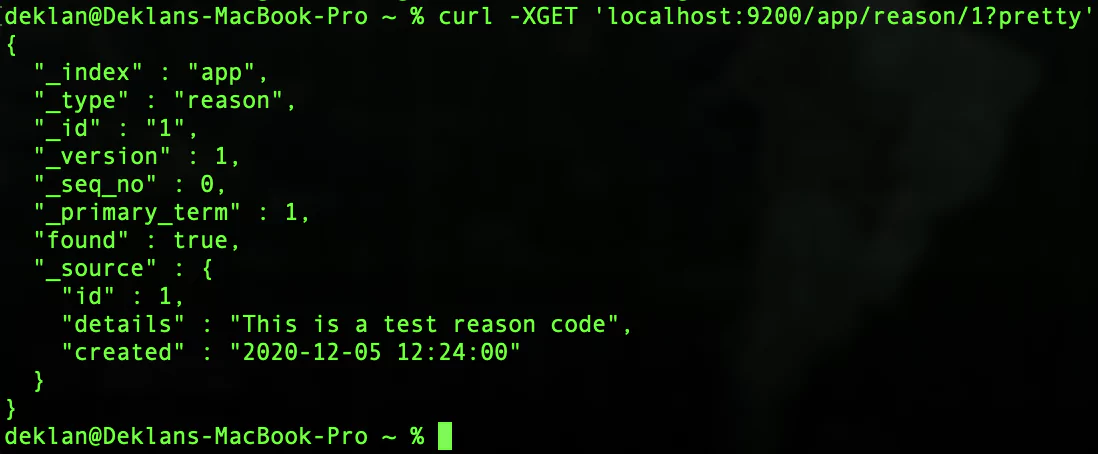
Cool! So now we are able to get data back out of our Elasticsearch instance. The metadata of the item is presented in fields that start with an underscore. The _source field will contain the objects that we have created. Building on what we have learned, we can now explore how to use Elasticsearch for searching. 

To search your Elasticsearch instance send the following request. In this search we are looking for any record containing ‘Deklan’:

curl -XGET 'localhost:9200/_search?q=Deklan'

Your response should look like this:

elasticsearch record

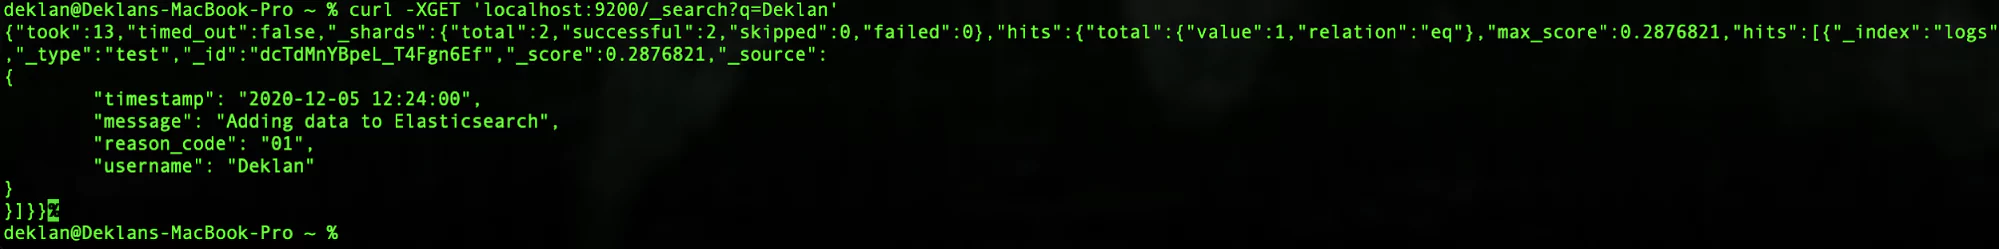
Let explore some of the extra metadata we got in the response from Elasticsearch. This can be found at the beginning of the response. 

[table id=54 /]

Lucene queries

The searches we have just completed are called URI searches and they are the most basic way to query your Elasticsearch instances. Let’s build on this and look at how we can structure more advanced searches. For this, we need to use Lucene queries. Let’s take a look at some examples:

[table id=55 /]

Building on this, there are a number of ways to include boolean logic, the boosting of terms, and the use of fuzzy & proximity searches. It is also possible to use regular expressions.

Advanced Queries: DSL Queries in Elasticsearch

Expanding further into querying our Elasticsearch instance we are now going to explore how we can request a body search with a Query DSL for much more granular searches. There are a vast array of options that can be used to define the level of granularity provided by a search. Moreover, you can mix and match different options to create highly specialized searches. 

A DSL query is built out of two kinds of clauses. The first is a leaf query clause that looks for a value in a specific field and the second is a compound query clause (This can contain one or multiple leaf query clauses).

Elasticsearch Query Types

There is a number of query types available in Elasticsearch including:

  • Geo queries
  • “More like this” queries
  • Scripted queries
  • Full-text queries
  • Shape queries
  • Span queries
  • Term-level queries
  • Specialized queries

Clauses in a filter context test documents in a boolean fashion: Does the document match the filter, “yes” or “no?” Filters are also generally faster than queries, but queries can also calculate a relevance score according to how closely a document matches the query. Filters do not use a relevance score. This determines the ordering and inclusion of documents:

Filters and Queries

Recently Elasticsearch has merged Elasticsearch queries and Elasticsearch filters, but these are still differentiated by context. The DSL is able to detect the difference between a filter and query context for query clauses. Filters are looped through in a boolean fashion. Elasticsearch will effectively filter based on Yes or No answers to the queries requested. Elasticsearch will then calculate the relevance score according to how closely the results match the query. 

N.B – Filters do not use query scores.

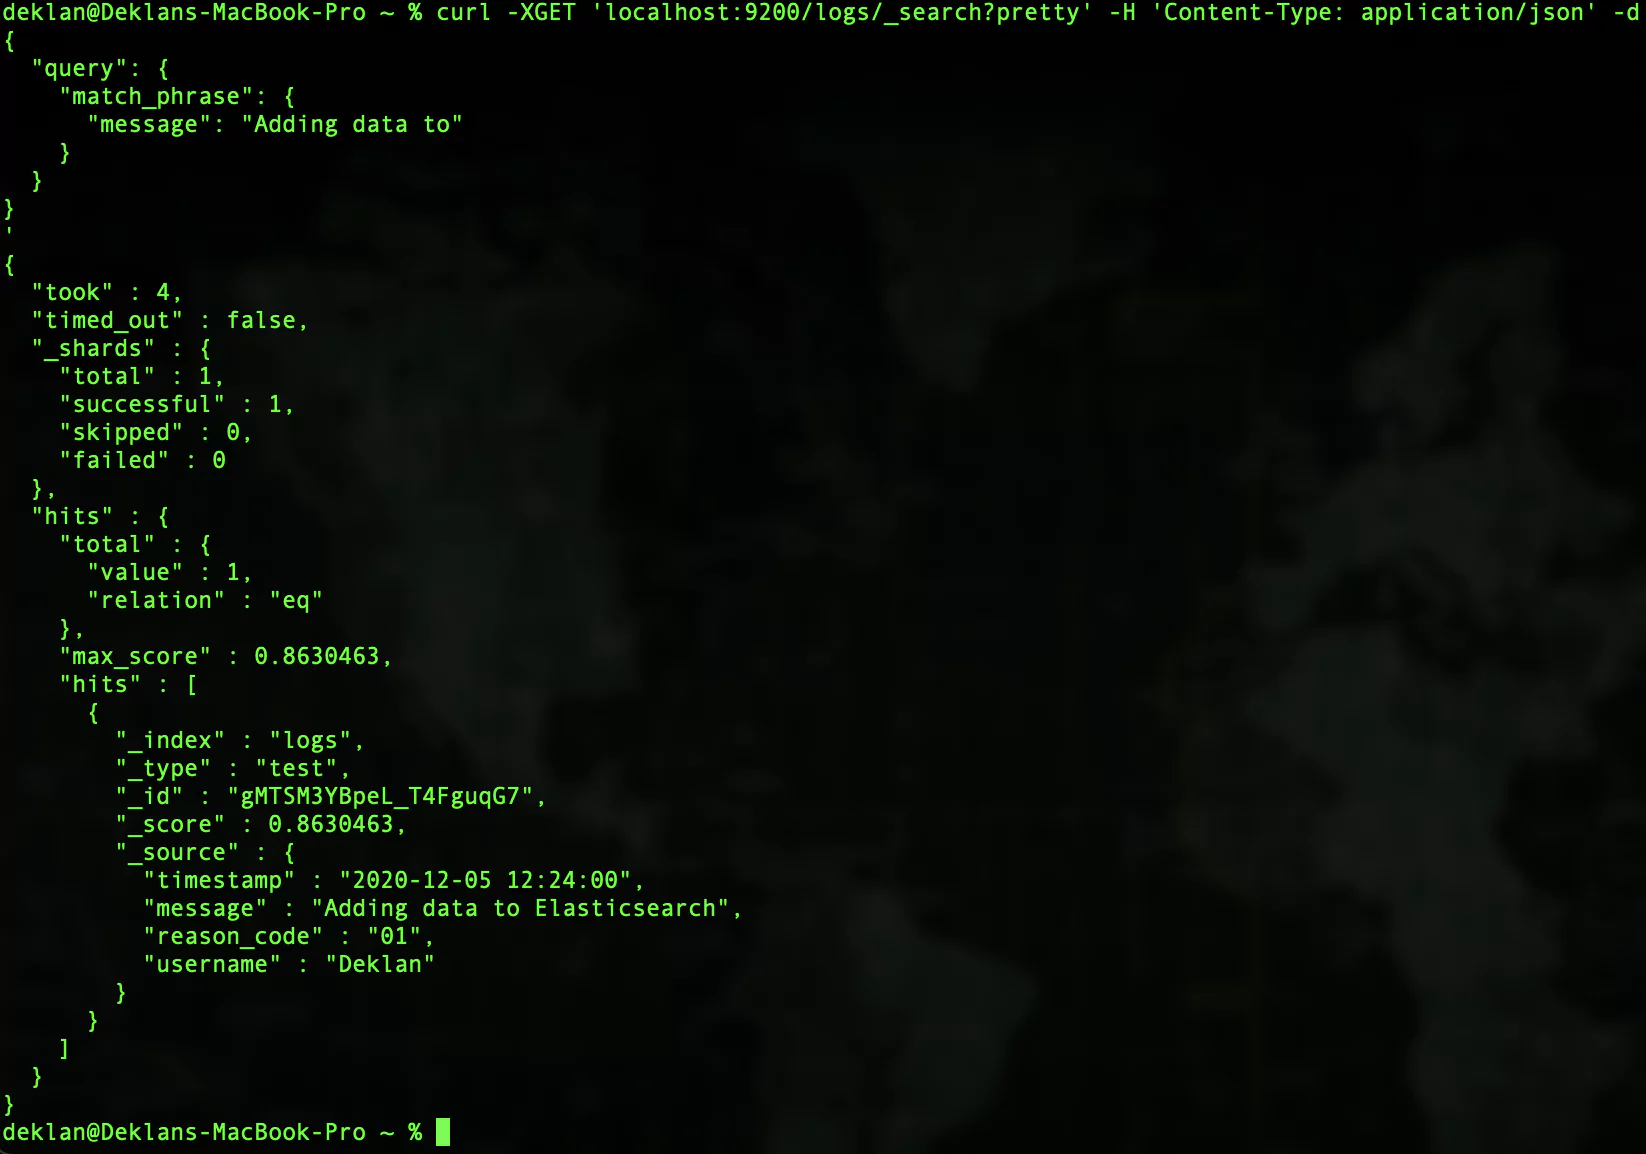
Let’s take a look at a DSL query:

curl -XGET 'localhost:9200/logs/_search?pretty' -H 'Content-Type: application/json' -d'

{

  "query": {

    "match_phrase": {

      "message": "Adding data to"

    }

  }

}

'

''

You should get a result that looks like this:

DSL query results

Deleting Data

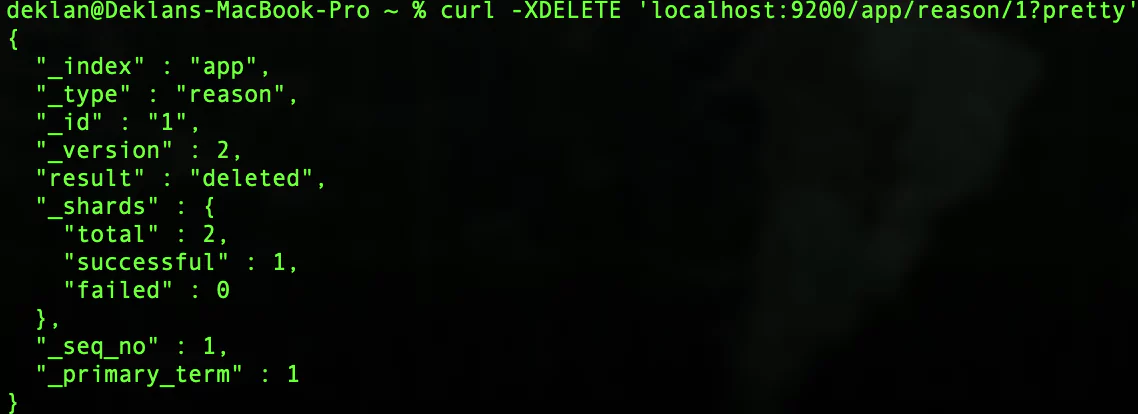
Deleting data is as simple as using the DELETE method on your HTTP requests. To try this out, let’s delete the reason code which we created at the beginning of this tutorial. 

To delete the reason code we use the following request: 

curl -XDELETE 'localhost:9200/app/reason/1?pretty'

If all has gone well you should get a response like this:

delete elasticsearch entry

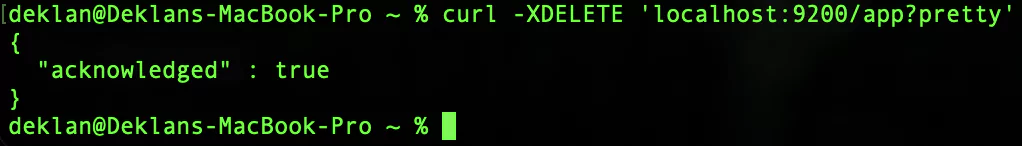
Should you wish to delete an index you would use the following request:

curl -XDELETE 'localhost:9200/app?pretty'

Your response should look like this:

delete index

If you are looking to delete all of the indices you would issue the following request:

TIP – Use this with caution as it will remove all data.

curl -XDELETE 'localhost:9200/_all?pretty'

A successful request will respond with the same as deleting an index as above. 

Finally, to delete a single document you would send the following request:

curl -XDELETE 'localhost:9200/index/type/document'

Conclusion

In this Elasticsearch tutorial, we have run through getting yourself up and working in Elasticsearch. You have learned how to spin up a Docker Elasticsearch instance, the basic steps of CRUD operations in Elasticsearch.

Our goal was to give you a solid foundation in which to expand your understanding of Elasticsearch. Elasticsearch is such a dynamic platform that has so many use cases. Hopefully, this will set you up so you can now start to explore just how powerful Elasticsearch is.

Elasticsearch Configurations and 9 Common Mistakes You Should Avoid

The default Elasticsearch setup is pretty good. You can get running from scratch to use as a simple log storage solution. However, as soon as you begin to rely on your default cluster, problems will inevitably appear.

Configuring elasticsearch is complex, so we’ve compiled useful configurations and the most common mistakes. Armed with these key tips, you’ll be able to take control of your Elasticsearch cluster and ship your logs with confidence.

Key Elasticsearch Configurations To Apply To Your Cluster

Get your naming right

Make sure your nodes are in the same cluster!

Nodes in the same cluster share the same cluster.name. Out of the box, your nodes will have the name “elasticsearch”. The cluster name is configured in the elasticsearch.yml file specific to each environment. 

cluster.name: my-custom-cluster-name

TIP: Be careful with sharing cluster names across environments. You may end up with nodes in the wrong cluster!

Wait, which node is ‘ec2-100.64.0.0-xhdtd’ again? 

When you spin up a new EC2 instance in your cloud provider, it often has a long and unmemorable name. Naming your nodes allows you to give them a meaningful identifier. 

By default, the node name will be the hostname of the machine. You can configure the elasticsearch.yml to set the node name to an environment variable.

node.name: my-node-123

Write to a safe location!

By default, Elasticsearch will write data to folders within $ES_HOME. The risk here is, during an upgrade, these paths may be overwritten.

In a production environment, it is strongly recommended you set the path.data and path.logs in elasticsearch.yml to locations outside of $ES_HOME.

TIP: The path.data setting can be set to multiple paths. 

Make sure your network configurations are rock solid

The network.host property sets both the bind host and the publish host. For those of you who aren’t familiar with these terms, they’re quite straightforward. The bind host is what Elasticsearch listens to for requests. The publish host, or IP address, is what Elasticsearch will use to communicate with other nodes.

TIP: You can put in some special values into this field, such as  _local_, _site_ and modifiers like :ip4.

Be prepared for some start up issues!

As soon as you set a value for network.host, you’re signaling to Elasticsearch that you’re now ready for a production setup. A number of system startup checks graduate from warnings to exceptions. This may introduce some teething issues as you get started.

Tell your nodes who is who with discovery settings

Elasticsearch nodes need to be able to find out about other nodes in the cluster. They also need to be able to determine who will be the master node. We can do this with a few discovery settings.

‘discovery.seed_hosts’ declares who can be a master node

The discovery.seed_hosts provides a list of nodes that can become a master node.

TIP: Each item should be formatted as host:port or host on its own. If you don’t specify a port, it will default to the value of transport.profiles.default.port

What if you’re starting a brand new cluster?

When starting an Elasticsearch cluster for the very first time, use the cluster.initial_master_nodes setting. When starting a new cluster in production mode, you must explicitly list the nodes that can become master nodes.  Under the hood, you’re telling Elasticsearch that these nodes are permitted to vote for a leader.

Check your JVM Configuration

Elasticsearch is underpinned by the Java Virtual Machine (JVM). It is easy to forget about this critical component, but when you’re running a production Elasticsearch cluster, you need to have a working understanding of the JVM.

Allocating Heap Space

The size of your JVM heap determines how much memory your JVM has to work with.

Give your JVM Heap some padding, beyond what you’re expecting to use, but not too much. A large JVM Heap can run into problems with long garbage collection pauses, which can dramatically impact your cluster performance.

At most, your Xms and Xmx values should be 50% of your RAM. Elasticsearch requires memory for purposes other than the JVM heap and it is important to leave space for this. On top of this, don’t set your heap to greater than 32 GB, otherwise you lose the benefit of compressed object pointers.

The 9 Most Common Elasticsearch Configuration Mistakes

To follow are nine of the most common Elasticsearch configuration mistakes when setting up and running an Elasticsearch instance and how you can avoid making them.

1. Elasticsearch Bootstrap Checks Preventing Startup

Bootstrap checks inspect various settings and configurations before Elasticsearch starts to make sure it will operate safely. If bootstrap checks fail, they can prevent Elasticsearch from starting in production mode or issue warning logs in development mode. It is recommended to familiarize yourself with the settings enforced by bootstrap checks, noting that they are different in development and production modes. 

By setting the system property of ‘enforce bootstrap checks’ to true, you can avoid bootstrap checks altogether.

2. Oversized Templating

Large templates are directly related to large mappings. Large mappings create syncing issues in your cluster.

One solution is dynamic templates. Dynamic templates can automatically add field mappings based on your predefined mappings for specific types and names. However, you should always try to keep your templates small in size. 

3. Elasticsearch Configuration for Capacity Provisioning

Provisioning can help to equip and optimize Elasticsearch for operational performance. The question that needs to be asked is ‘How much space do you need?’ You should first simulate your use-case. This can be done by booting up your nodes, filling them with real documents, and pushing them until the shard breaks. You can then start defining a shard’s capacity and apply it throughout your entire index. 

It’s important to understand resource utilization during the testing process. This allows you to reserve the proper amount of RAM for nodes, configure your JVM heap space, configure your CPU capacity, provision through scaling larger instances with potentially more nodes, and optimize your overall testing process. 

4. Not Defining Elasticsearch Mappings

Elasticsearch relies on mapping, also known as schema definitions, to handle data properly according to its correct data type. In Elasticsearch, mapping defines the fields in a document and specifies their corresponding data types, such as date, long, and string. 

In cases where an indexed document contains a new field without a defined data type, Elasticsearch uses dynamic mapping to estimate the field’s type, converting it from one type to another when necessary. 

You should define mappings, especially in production-based environments. It’s a best practice to index several documents, let Elasticsearch guess the field, and then grab the mapping it creates. You can then make any appropriate changes that you see fit without leaving anything up to chance.

5. Combinable Data ‘Explosions’

Combinable Data Explosions are computing problems that can cause an exponential growth in bucket generation for certain aggregations and can lead to uncontrolled memory usage. Elasticsearch’s ‘terms’ field builds buckets according to your data, but it cannot predict how many buckets will be created in advance. This can be problematic for parent aggregations that are made up of more than one child aggregation.

To overcome this, collection modes can be used to help to control how child aggregations perform. By default, Elasticsearch uses ‘depth-first’ aggregation, however you can also use the breadth-first collection mode.

6. Search Timeout Errors

Search timeouts are common and can occur for many reasons, such as large datasets or memory-intensive queries.

To eliminate search timeouts, you can increase the Elasticsearch Request Timeout configuration, reduce the number of documents returned per request, reduce the time range, tweak your memory settings, and optimize your query, indices, and shards. You can also enable slow search logs to monitor search run time and scan for heavy searches.

7. Process Memory Locking Failure

To ensure nodes remain healthy in the cluster, you must ensure that none of the JVM memory is ever swapped out to disk. You can do this by setting the bootstrap memory lock to true. You should also ensure that you’ve set up memory locking correctly by consulting the Elasticsearch configuration documentation. 

8. Shards are Failing

When searching in Elasticsearch, you may encounter ‘shards failure’ error messages. This happens when a read request fails to get a response from a shard. This can happen if the data is not yet searchable because the cluster or node is still in an initial start process, or when the shard is missing, or in recovery mode and the cluster is red.

To ensure better management of shards, especially when dealing with future growth, you are better off reindexing the data and specifying more primary shards in newly created indexes. To optimize your use case for indexing, make sure you designate enough primary shards so that you can spread the indexing load evenly across all of your nodes. You can also factor disabling merge throttling, increasing the size of the indexing buffer, and refresh less frequently by increasing the refresh interval.

9. Production Fine Tuning

By default, the first cluster that Elasticsearch starts is called ‘elasticsearch’. If you are unsure about how to change an Elasticsearch configuration, it’s best to stick to the default. However, it’s good practice to rename your production cluster to prevent unwanted nodes from joining your cluster.

Any applied changes result in recovery settings affecting how nodes recover when clusters restart. Elasticsearch allows nodes that belong to the same cluster to join that cluster automatically whenever a recovery occurs. Some nodes within a cluster boot up quickly after recovery. However, others may take a bit longer at times.

It is important to configure the number of nodes that will be in each cluster, as well as the amount of time that it will take for them to boot up in Elasticsearch.

5 Common Elasticsearch Mistakes That Lead to Data Breaches

Avon and Family Tree aren’t companies you would normally associate with cybersecurity, but this year, all three were on the wrong side of it when they suffered massive data breaches. At Avon 19 million records were leaked, and Family Tree had 25GB of data compromised. What do they have in common? All of them were using Elasticsearch databases.

These are just the latest in a string of high profile breaches that have made Elasticsearch notorious in cybersecurity.  Bob Diachenko is a cybersecurity researcher. Since 2015, he’s been investigating vulnerabilities in NoSQL databases. 

He’s uncovered several high profile cybersec lapses including 250 million exposed Microsoft records. Diachenko’s research suggests that 60% of NoSQL data breaches are with Elasticsearch databases. In this article, I’ll go through five common causes for data breaches and show how the latest Elastic Stack releases can actually help you avoid them.

1. Always Secure Your Default Configuration Before Deploying

According to Bob Diachenko, many data breaches are caused by developers forgetting to add security to the default config settings before the database goes into production. To make things easier for beginner devs, Elasticsearch traditionally doesn’t include security features like authentication in its default configuration. This means that when you set up a database for development, it’s accessible to anyone who knows the IP address.

Avoid Sitting Ducks

The trouble starts as soon as a developer pushes an Elasticsearch database to the internet. Without proper security implementation, the database is a sitting duck for cyberattacks and data leaks. Cybersecurity professionals can use search engines like Shodan to scan for open IP ports indicating the presence of unsecured Elasticsearch databases. As can hackers. Once a hacker finds such a database, they can freely access and modify all the data it contains.

Developers who set up Elasticsearch databases are responsible for implementing a secure configuration before the database goes into production. Elasticsearch’s official website has plenty of documentation for how to secure your configuration and developers need to read it thoroughly.

Elasticsearch to the Rescue

That being said, let’s not put all the blame on lazy programmers! Elasticsearch acknowledges that the fast-changing cybersecurity landscape means devs need to take their documentation with a pinch of salt. Users are warned not to read old blogs as their advice is now considered dangerous. In addition, Elasticsearch security can be difficult to implement. Developers under pressure to cut times to market won’t necessarily be incentivised to spend an extra few days double checking security.

To combat the threat of unsecured databases, Elasticsearch have taken steps to encourage secure implementation as a first choice. Elastic Stack 6.8 and 7.1 releases come with features such as TLS encryption and Authentication baked into the free tier. This should hopefully encourage “community” users to start focussing on security without worrying about bills. 

2. Always Authenticate

In 2018, security expert Sebastien Kaul found an Elasticsearch database containing tens of millions of text messages, along with password information. In 2019, Bob Diachenko found an Elasticsearch database with over 24 million sensitive financial documents. Shockingly, neither database was password protected.

So why are so many devs spinning up unauthenticated Elasticsearch databases? On the internet! In the past, the default configuration didn’t include authentication. Devs used the default configuration because it was convenient and free.

To rub salt on the wound, Elasticsearch told users to implement authentication by placing a Nginx server between the client and the cluster. This approach had the downside that many programmers found setting up the correct configuration much too difficult for them.

Recognising the previous difficulties, Elasticsearch has recently upgraded the free configuration. It now includes native and file authentication. The authentication takes the form of role based access control. 

Elasticsearch developers can use Kibana to create users with custom roles demarcating their access rights.  This tutorial illustrates how role based access control can be used to create users with different access rights.

3. Don’t Store Data as Plain Text

In his research, Bob Dianchenko found that Microsoft had left 250 million tech support logs exposed to the internet. He discovered personal information such as emails had been stored in plain text.  

In 2018, Sebastien Kaul found an exposed database containing millions of text messages containing plain text passwords.

Both of these are comparatively benign compared to Dianchenko’s most recent find, a leaked database containing 1 billion plain text passwords. With no authentication protecting it, this data was ripe for hackers to plunder. Access to passwords would allow them to commit all kinds of fraud, including identity theft.

Even though storing passwords in plain text is seriously bad practice, many companies have been caught doing it red handed. This article explains the reasons why.

Cybersecurity is No Laughing Matter

In a shocking 2018 twitter exchange, a well-known mobile company admitted to storing customer passwords in plain text. They justified this by claiming that their customer service reps needed to see the first few letters of a password for confirmation purposes.

When challenged on the security risks of this practice, the company rep gave a response shocking for its flippancy.

“What if this doesn’t happen because our security is amazingly good?”

Yes, in a fit of poetic justice, this company later experienced a major data breach.  Thankfully, such a cavalier attitude to cybersecurity risks is on the wane.  Companies are becoming more security conscious and making an honest attempt to implement security best practice early in the development process. 

Legacy Practices

A well-known internet search engine stored some of it’s account passwords in plain text. When found out, they claimed the practice was a remnant from their early days. Their domain admins had the ability to recover passwords and for this to work, needed to see them in plain text.

Although company culture can be slow to change, many companies are undertaking the task of bringing their cybersecurity practices into the 21st century.

Logging Sensitive Data

Some companies have found themselves guilty of storing plain text passwords by accident. A well-known social media platform hit this problem when it admitted it had been storing plain text passwords. The platform’s investigation concluded:

“…we discovered additional logs of [the platform’s] passwords being stored in a readable format.”

They had inadvertently let their logging system record and store usernames and passwords as users were typing the information. Logs are stored in plain text, and typically accessible to anyone in the development team authorised to access them. Plain text user information in logs invited malicious actors to cause havoc.

On this point, make sure to use a logging system with strong security features. Solutions such as Coralogix are designed to conform to the most up to date security standards, guaranteeing the least risk to your company.

Hashing and Salting Passwords

In daily life we’re warned to take dodgy claims “with a pinch of salt” and told to avoid “making a hash of” something. Passwords on the other hand, need to be taken with more than a pinch of salt and made as much of a hash of as humanly possible.

Salting is the process of adding extra letters and numbers to your password to make it harder to decode. For example, imagine you have the password “Password”. You might add salt to this password to make it “Password123” (these are both terrible passwords by the way!)

Once your password has been salted, it then needs to be hashed. Hashing transforms your password to gibberish. A company can check the correctness of a submitted password by salting the password guess, hashing it, and checking the result against the stored hash. However, cybercriminals accessing a hashed password cannot recover the original password from the hash.

4. Don’t Expose Your Elasticsearch Database to the Internet

Bob Diachenko has made it his mission to find unsecured Elasticsearch databases, hopefully before hackers do!  He uses specialised search engines to look for the IP addresses of exposed databases. Once found, these databases can be easily accessed through a common browser.

Diachenko has used this method to uncover several high profile databases containing everything from financial information to tech support logs. In many instances, this data wasn’t password protected, allowing Diachenko to easily read any data contained within. Diachenko’s success dramatically illustrates the dangers of exposing unsecured databases to the internet.

Because once data is on the web, anyone in the world can read it. Cybersecurity researchers like Bob Diachenko and Sebastien Kaul are the good guys. But the same tools used by white-hat researchers can just as easily be used by black-hat hackers.

If the bad guys find an exposed database before the good guys do, a security vulnerability becomes a security disaster. This is starkly illustrated by the shocking recent tale of a hacker who wiped and defaced over 15000 Elasticsearch servers, blaming a legit cybersecurity firm in the process. 

The Elasticsearch documentation specifically warns users not to expose databases directly to the internet. So why would anyone be stupid enough to leave a trove of unsecured data open to the internet?

In the past, Elasticsearch’s tiering system has given programmers the perverse incentive to bake security into their database as late as possible in the development process. With Elastic Stack 6.8 and 7.1, Elasticsearch have included security features in the free tier. Now developers can’t use the price tag as an excuse for not implementing security before publishing, because there isn’t one.

5. Stop Scripting Shenanigans

On April 3 2020, ZDNet reported that an unknown hacker had been attempting to wipe and deface over 15,000 Elasticsearch servers. They did this using an automated script.

Elasticsearch’s official scripting security guide explains that all scripts are allowed to run by default. If a developer left this configuration setting unchanged when pushing a database to the internet, they would be inviting disaster.

Two configuration options control script execution, script types and script contexts. You can prevent unwanted script types from executing with the command script.allowed_types: inline

To prevent risky plugin scripts from running, Elasticsearch recommends modifying the script contexts option using script.allowed_contexts: search, update.  If this isn’t enough you can prevent any scripts from running you can set script.allowed_contexts to “none”.

Elasticsearch takes scripting security issues seriously and they have recently taken their own steps to mitigate the problem by introducing their own scripting language, Painless. 

Previously, Elasticsearch scripts would be written in a language such as JavaScript. This made it easy for a hacker to insert malicious scripts into a database.  Painless brings an end to those sorts of shenanigans, making it much harder to bring down a cluster.

Summary

Elasticsearch is one of the most popular and scalable database solutions on the market. However, it’s notorious for its role in data breaches. Many of these breaches were easily preventable and this article has looked at a few of the most common security lapses that lead to such breaches.

We’ve seen that many cases of unsecured databases result from developers forgetting to change Elasticsearch’s default configuration before making the database live. We also looked at the tandem issue of unsecured databases being live on the web, where anyone with the appropriate tools could find them.  

Recently, Elasticsearch have taken steps to reduce this by including security features in their free tier so programmers are encouraged to consider security early. Hopefully this alone provides developers a powerful incentive to address the above two issues.

Other issues we looked at were the worryingly common habit of storing passwords as plain text instead of salting and hashing them and the risks of not having a secure execution policy for scripts. These two problems aren’t Elasticsearch specific and are solved by common sense and cybersecurity best practice.

In conclusion, while Elasticsearch has taken plenty of recent steps to address security, it’s your responsibility as a developer to maintain database security.