An Introduction to Windows Event Logs

The value of log files goes far beyond their traditional remit of diagnosing and troubleshooting issues reported in production. 

They provide a wealth of information about your systems’ health and behavior, helping you spot issues as they emerge. By aggregating and monitoring log file data in real-time, you can proactively monitor your network, servers, user workstations, and applications for signs of trouble.

In this article, we’re looking specifically at Windows event logs – also known as system logs – from how they are generated to the insights they can offer, particularly in the all-important security realm.

Logging in Windows

If you’re reading this, your organization will likely run Windows on at least some of your machines. Windows event logs come from the length and breadth of your IT estate, whether that’s employee workstations, web servers running IIS, cluster managers enabling highly available services, Active Directory or Exchange servers, or databases running on SQL Server.

Windows has a built-in tool for viewing log files from the operating system and the applications and services running on it. 

Windows Event Viewer is available from the Control Panel’s Administrative Tools section or by running “eventvwr” from the command prompt. From Event Viewer, you can view the log files generated on the current machine and any log files forwarded from other machines on the network.

When you open Event Viewer, choose the log file you want to view (such as application, security, or system). A list of the log entries is displayed together with the log level (critical, error, warning, information, verbose). 

As you might expect, you can sort and filter the list by parameters such as date, source, and severity level. Selecting a particular log entry displays the details of that entry.

When using audit policies, you can control the types of logged events. Suppose you aim to identify and stop cyber-attacks at the earliest opportunity. In that case, it’s essential to apply your chosen policy settings to all machines in your organization, including individual workstations, as hackers often target these. 

Furthermore, if you’re responsible for archiving event logs for audit or regulatory purposes, ensure you check the properties for each log file and configure the log file location, retention period, and overwrite settings.

Working with windows event logs

Although Event Viewer gives you access to your log data, you can only view entries for individual machines, and you need to be logged into the machine in question to do so. 

However, for all but the most minor operations, logging into or connecting to individual machines to view log files regularly is impractical. 

At best, you can use this method to investigate past security incidents or diagnose known issues, but you miss out on the opportunity to use log data to spot early signs of trouble.

If you want to leverage log data for proactive monitoring of your systems and to perform early threat detection, you first need to forward your event logs to a central location and then analyze them in real-time. 

There are various ways to do this, including using Windows Event Forwarding to set up a subscription or installing an agent on devices to ship logs to your chosen destination.

Forwarding your logs to a central server also simplifies the retention and backup of log files. This is particularly helpful if regulatory schemes, like HIPAA, require storing log entries for several years after they were generated.

Monitoring events

When using log data proactively, it pays to cast a wide net. The types of events that can signal something unexpected or indicate a situation that deserves close monitoring include:

  • Any change in the Windows Firewall configuration. As all planned changes to your setup should be documented, anything unexpected should trigger alarm bells.
  • Any change to user groups or accounts, including creating new accounts. Once an attacker has compromised an account, they may try to increase their privileges.
  • Successful or failed login attempts and remote desktop connections, mainly if these are outside business hours or from unexpected IP addresses or locations.
  • Password lockouts. These may indicate a brute force attempt, so it’s always worth identifying the machine in question and further investigating whether it was just an honest mistake.
  • The application allows listing. Keep an eye out for scripts and processes that don’t usually run on your systems, as these may be added to facilitate an attack.
  • Changes to file system permissions. Look for changes to root directories or system files that should not routinely be modified.
  • Changes to the registry. While you can expect some registry keys, such as recently used files, to change regularly, others, such as those controlling the programs that run on startup, could indicate something more sinister. Similarly, any changes to permissions to the password hash store should be investigated.
  • Changes to audit policies. Hackers can ensure future activity stays under the radar by changing what events are logged.
  • Clearing event logs. It’s not uncommon for attackers to cover their tracks. If logs are being deleted locally, it’s worth finding out why (while breathing a sigh of relief, you had the entries forwarded to a central location automatically and haven’t lost any data).

While the above is an exhaustive list, it demonstrates that you should set your Windows audit policies to log more than just failures.

Wrapping up

Windows event log analysis can capture a wide range of activities and provide valuable insights into the health of your system. 

We’ve discussed some events to look out for and which you may want to be alerted to automatically. Still, cybersecurity is a constantly moving target, with new attack vectors emerging. You must continuously be on the lookout for anything unusual to protect your organization.

By collating your Windows event logs in a central location and applying machine learning, you can offload much effort to detect anomalies. Coralogix uses machine learning to detect unusual behavior while filtering out false positives. Learn more about log analytics with Coralogix, or start shipping your Windows Event logs now.

Using Coralogix to Gain Insights From Your FortiGate Logs

FortiGate, a next-generation firewall from IT Cyber Security leaders Fortinet, provides the ultimate threat protection for businesses of all sizes. FortiGate helps you understand what is happening on your network, and informs you about certain network activities, such as the detection of a virus, a visit to an invalid website, an intrusion, a failed login attempt, and myriad others.

This post will show you how Coralogix can provide analytics and insights for your FortiGate logs.

FortiGate Logs

FortiGate log events types are various and are divided into types (Traffic Logs, Event Logs, Security Logs, etc…) and subtypes per each type, you can view full documentation here. You may notice that the FortiGate logs are structured in a Syslog format, with multiple key/value pairs forming textual logs.

First, you will need to parse the data into a JSON log format to enjoy the full extent of the Coralogix capabilities and features and eventually, using Coralogix alerts and dashboards, instantly diagnose problems, spot potential security threats, and get a real-time notification on any event that you might want to observe. Ultimately, this offers a better monitoring experience and more capabilities from your data with minimum effort.

There are two ways to parse the FortiGate logs, either it is done on the integration side or at the 3rd party logging solution you are using if it allows a parsing engine. If you are using Coralogix as your logging solution you can use our advanced parsing engine to create series of rules within the same parsing group to eventually form a JSON object from the key/value pairs text logs. Let us review both options.

Via Logstash

In your logstash.conf add the following KV filter:

    filter {
      kv {
        trim_value => """
        value_split => "="
        allow_duplicate_values => false
      }
    }

Note that the arguments “value_split” and  “allow_duplicate_values” are not mandatory and by default, they are set with the values I am presenting here, I only added them for reference.

Sample log
date=2019-05-10 time=11:37:47 logid="0000000013" type="traffic" subtype="forward" level="notice" vd="vdom1" eventtime=1557513467369913239 srcip=10.1.100.11 srcport=58012 srcintf="port12" srcintfrole="undefined" dstip=23.59.154.35 dstport=80 dstintf="port11" dstintfrole="undefined" srcuuid="ae28f494-5735-51e9-f247-d1d2ce663f4b" dstuuid="ae28f494-5735-51e9-f247-d1d2ce663f4b" poluuid="ccb269e0-5735-51e9-a218-a397dd08b7eb" sessionid=105048 proto=6 action="close" policyid=1 policytype="policy" service="HTTP" dstcountry="Canada" srccountry="Reserved" trandisp="snat" transip=172.16.200.2 transport=58012 appid=34050 app="HTTP.BROWSER_Firefox" appcat="Web.Client" apprisk="elevated" applist="g-default" duration=116 sentbyte=1188 rcvdbyte=1224 sentpkt=17 rcvdpkt=16 utmaction="allow" countapp=1 osname="Ubuntu" mastersrcmac="a2:e9:00:ec:40:01" srcmac="a2:e9:00:ec:40:01" srcserver=0 utmref=65500-742
Output
{
	"date": "2019-05-10",
	"time": "11:37:47",
	"logid": "0000000013",
	"type": "traffic",
	"subtype": "forward",
	"level": "notice",
	"vd": "vdom1",
	"eventtime": "1557513467369913239",
	"srcip": "10.1.100.11",
	"srcport": "58012",
	"srcintf": "port12",
	"srcintfrole": "undefined",
	"dstip": "23.59.154.35",
	"dstport": "80",
	"dstintf": "port11",
	"dstintfrole": "undefined",
	"srcuuid": "ae28f494-5735-51e9-f247-d1d2ce663f4b",
	"dstuuid": "ae28f494-5735-51e9-f247-d1d2ce663f4b",
	"poluuid": "ccb269e0-5735-51e9-a218-a397dd08b7eb",
	"sessionid": "105048",
	"proto": "6",
	"action": "close",
	"policyid": "1",
	"policytype": "policy",
	"service": "HTTP",
	"dstcountry": "Canada",
	"srccountry": "Reserved",
	"trandisp": "snat",
	"transip": "172.16.200.2",
	"transport": "58012",
	"appid": "34050",
	"app": "HTTP.BROWSER_Firefox",
	"appcat": "Web.Client",
	"apprisk": "elevated",
	"applist": "g-default",
	"duration": "116",
	"sentbyte": "1188",
	"rcvdbyte": "1224",
	"sentpkt": "17",
	"rcvdpkt": "16",
	"utmaction": "allow",
	"countapp": "1",
	"osname": "Ubuntu",
	"mastersrcmac": "a2:e9:00:ec:40:01",
	"srcmac": "a2:e9:00:ec:40:01",
	"srcserver": "0",
	"utmref": "65500-742"
}

Via Coralogix

In settings –> Rules (available only for account admins) create a new group of rules with the following 3 REGEX-based replace rules. These rules should be applied consecutively (with an AND between them) on the FortiGate logs in order to format. Don’t forget to add a rule matcher to enable the parsing to take place only on your FortiGate data. Here are the rules:

  1. Regex pattern
    ([a-z0-9_-]+)=(?:")([^"]+)(?:")

    Replace pattern

    "$1":"$2",
  2. Regex pattern
    ([a-z0-9_-]+)=([0-9.-:]+|N/A)(?: |$)

    Replace pattern

    "$1":"$2",
  3. Regex pattern
    (.*),

    Replace pattern

    {$1}

For the same sample log above the result will be similar and the log entry you will have in Coralogix will be parsed as JSON.

FortiGate Dashboards

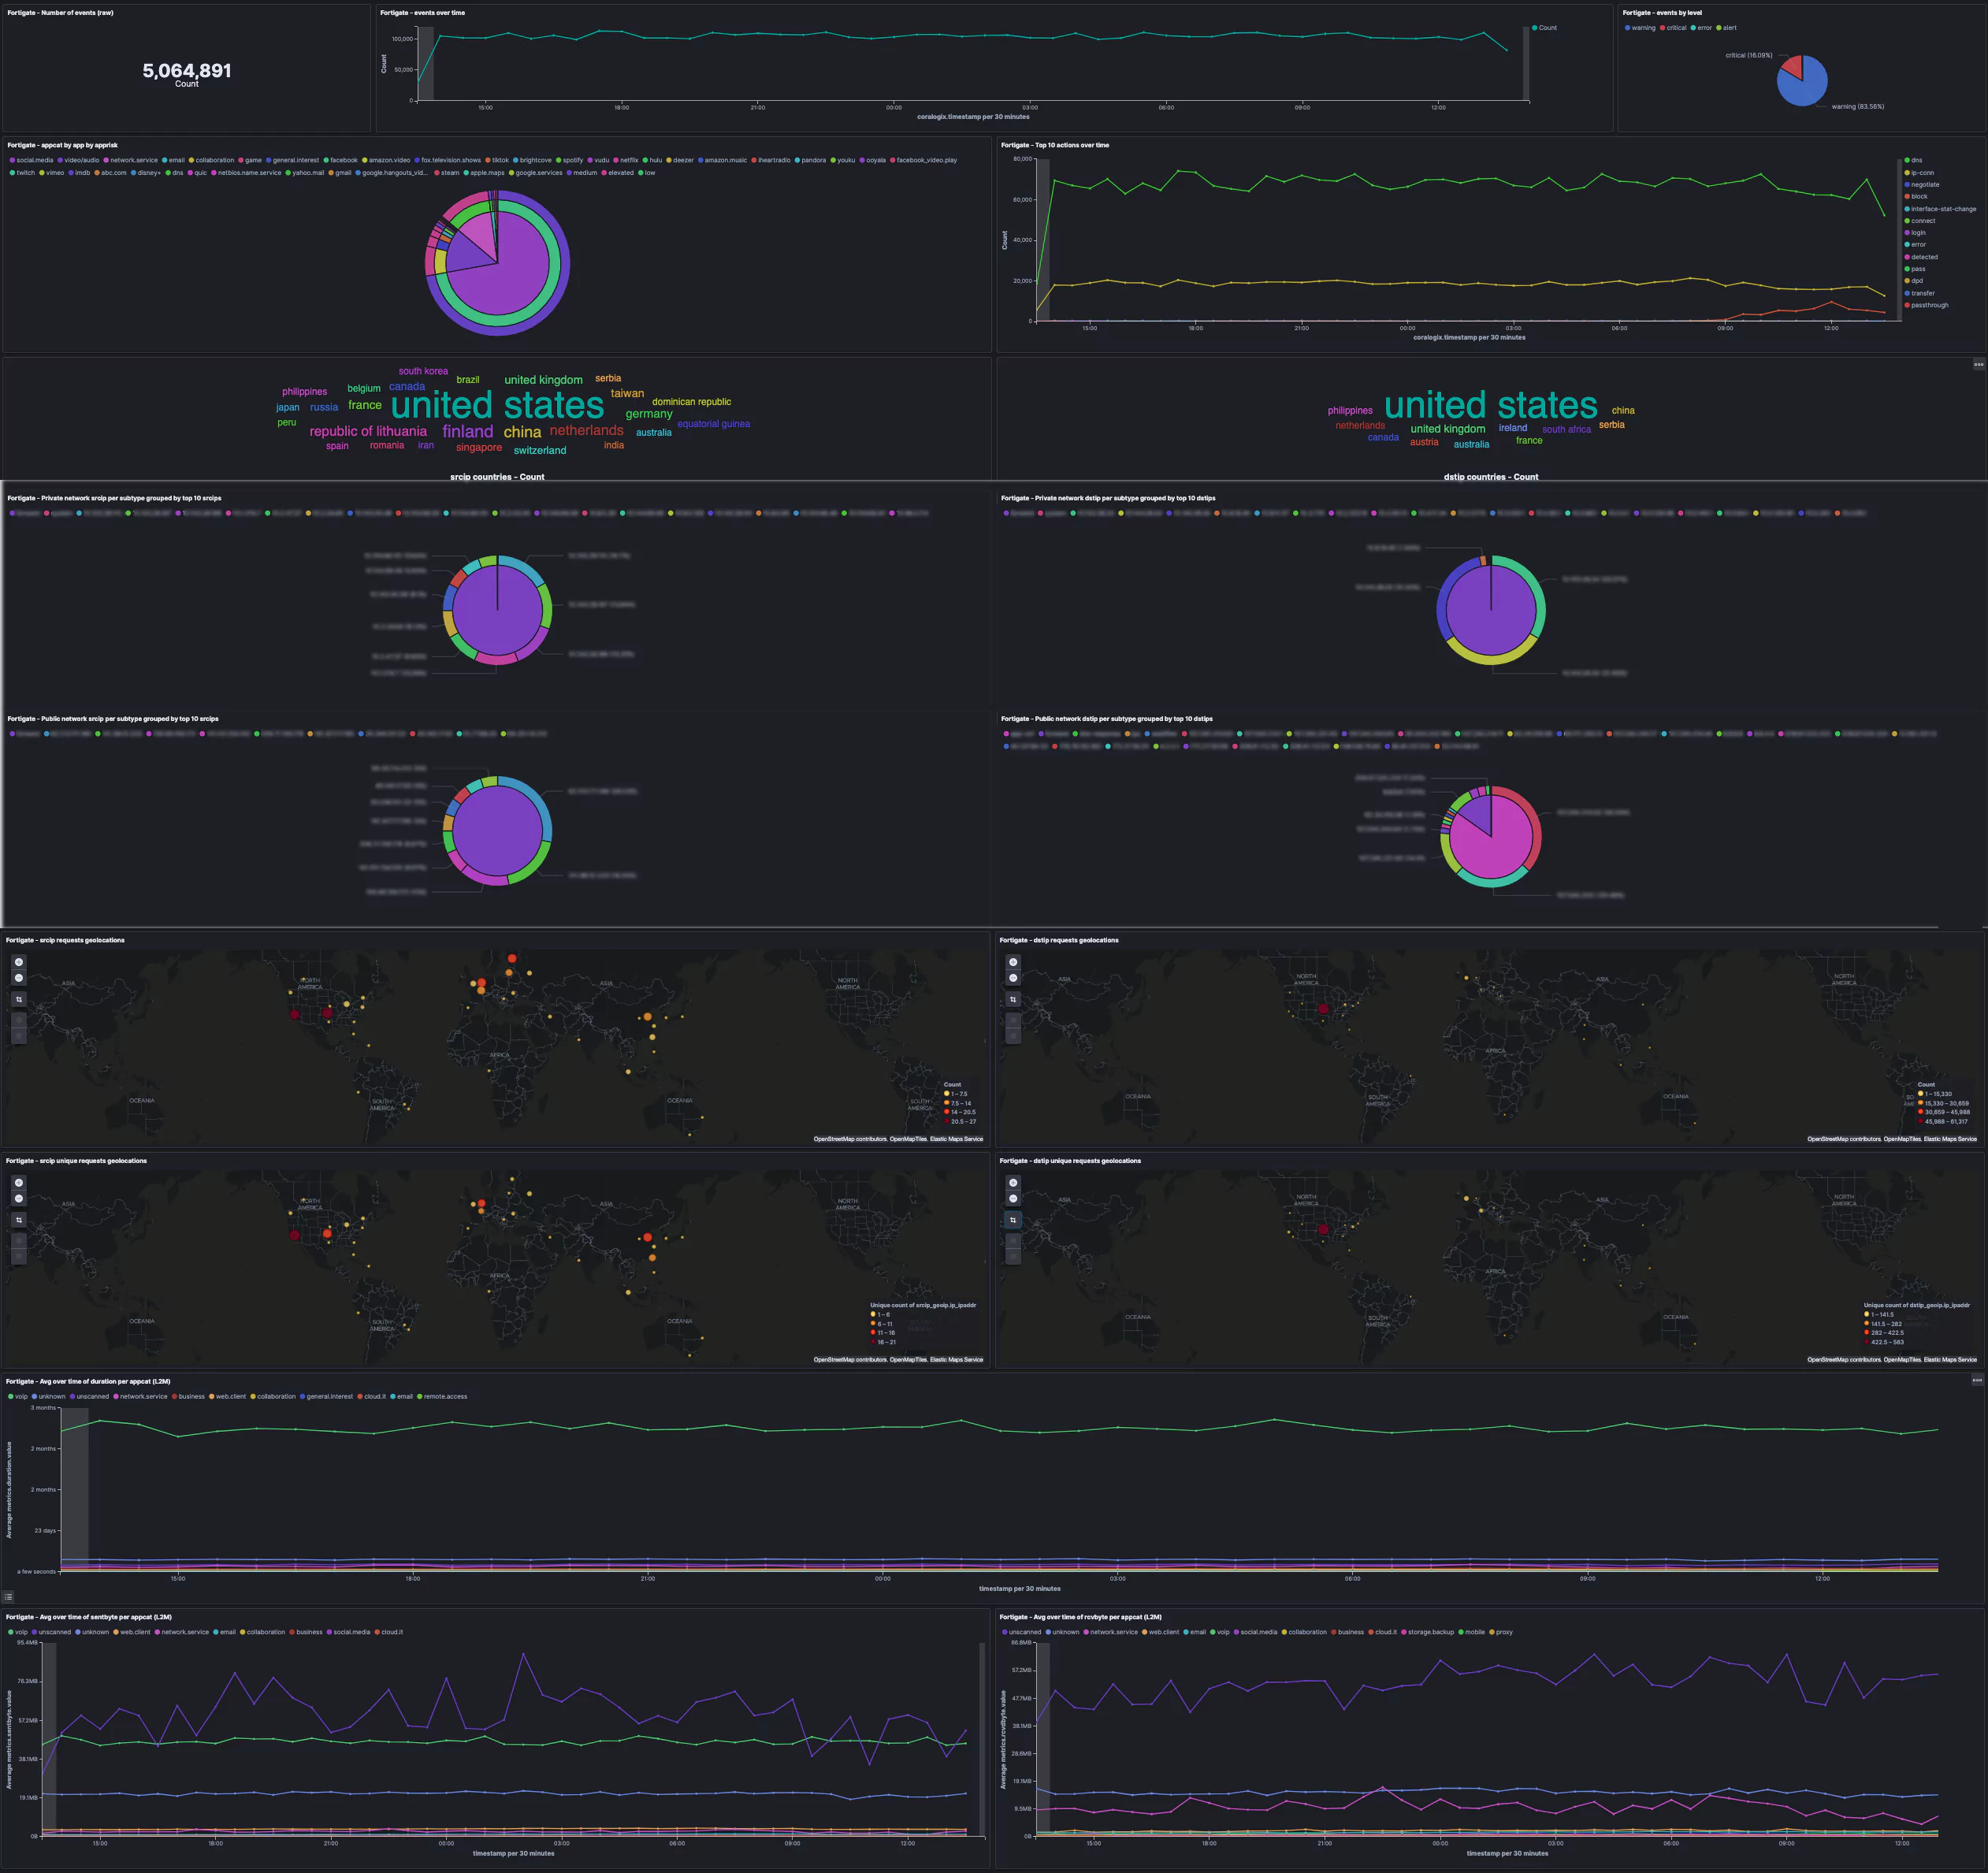
Here is an example FortiGate firewall Overview dashboard we created using FortiGate data. The options are practically limitless and you may create any visualization you can think of as long as your logs contain that data you want to visualize. For more information on using Kibana, please visit our tutorial.

FortiGate firewall Overview

FortiGate Alerts

Coralogix User-defined alerts enable you to easily create any alert you have in mind, using complex queries and various conditions heuristics, thus being more proactive with your FortiGate firewall data and be notified in real-time with potential system threats, issues, etc… Here are some examples of alerts we created using traditional FortiGate data.

The alert Condition can be customized to your pleasing and how it fits or satisfies your needs.

Alert name Description Alert Type Query Alert condition
FortiGate – new country deny action New denied source ip New Value action:deny Notify on new value in the last 12H
FortiGate – more than usual deny action More than usual access attempts with action denied Standard action:deny More than usual
FortiGate – elevated risk ratio more than 30% High apprisk ratio Ratio Q1 – apprisk:(elevated OR critical OR high)
Q2 – _exists_:apprisk
Q1/Q2>0.3 in 30 min
FortiGate – unscanned transactions 2x compared to the previous hour double of unscanned transactions comparing to previous hour Time relative appcat:unscanned current/an hour ago ration greater than 2x
FortiGate – critical risk from multiple countries alert if more than 3 unique destination countries with high/critical risk Unique count apprisk:(high OR critical) Over 3 unique dst countries in last 10 min

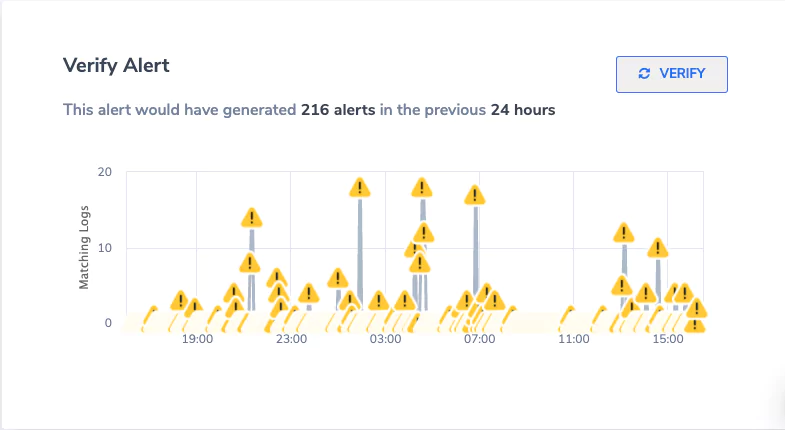
To avoid noise from these Alerts, Coralogix added a utility to allow you to simulate how the alert would behave. At the end of the alert, click verify Alert.

Need More Help with FortiGate or any other log data? Click on the chat icon on the bottom right corner for quick advice from our logging experts.