The new standard of observability is here. Discover Olly, the industry’s first
In this post we will cover some of the main use cases FluentD supports and provides example FluentD configurations for the different cases.
What is Fluentd
Fluentd is an open source data collector, which allows you to unify your data collection and consumption. Fluentd was conceived by Sadayuki “Sada” Furuhashi in 2011. Sada is a co-founder of Treasure Data, Inc., the primary sponsor of the Fluentd and the source of stable Fluentd releases.
Installation
Fluentd installation instructions can be found on the fluentd website.
Here are Coralogix’s Fluentd plugin installation instructions
Coralogix also has a Fluentd plug-in image for k8s. This doc describes Coralogix integration with Kubernetes.
Configuration
Flunetd configuration file consists of the following directives (only source and match are mandatory ones):
- source directives determine the input sources.
- match directives determine the output destinations.
- filter directives determine the event processing pipelines. (optional)
- system directives set system wide configuration. (optional)
- label directives group the output and filter for internal
routing (optional) - @include directives include other files. (optional)
Fluentd configuration is organized by hierarchy. Each of the directives has different plug-ins and each of the plug-ins has its own parameters. There are numerous plug-ins and parameters associated with each of them. In this post I will go over on a few of the commonly used ones and focus on giving examples that worked for us here at Coralogix. I also tried to plug pointers to existing documentation to help you locate directive and plug-ins that are not mentioned here.
Without further ado let’s dive in.
These directives will be present in any Fluentd configuration file:
Source
This is an example of a typical source section in a Fluentd configuration file:
<source>
  @type tail
  path /var/log/msystem.log
  pos_file /var/log/msystem.log.pos
  tag mytag
  <parse>
    @type none
  </parse>
</source>
Let’s examine the different components:
@type tail – This is one of the most common Fluentd input plug-ins. There are built-in input plug-ins and many others that are customized. The ‘tail’ plug-in allows Fluentd to read events from the tail of text files. Its behavior is similar to the tail -F command. The file that is read is indicated by ‘path’. Fluentd starts from the last log in the file on restart or from the last position stored in ‘pos_file’, You can also read the file from the beginning by using the ‘read_from_head true’ option in the source directive. When the log file is rotated Fluentd will start from the beginning. Each input plug-in comes with parameters that control its behavior. These are the tail parameters.
Tags allow Fluentd to route logs from specific sources to different outputs based on conditions. E.g – send logs containing the value “compliance” to a long term storage and logs containing the value “stage” to a short term storage.
The parser directive, <parse>, located within the source directive, , opens a format section. This is mandatory. It can use type none (like in our example) if no parsing is needed. This list includes the built-in parsers. There is an option to add a custom parser.
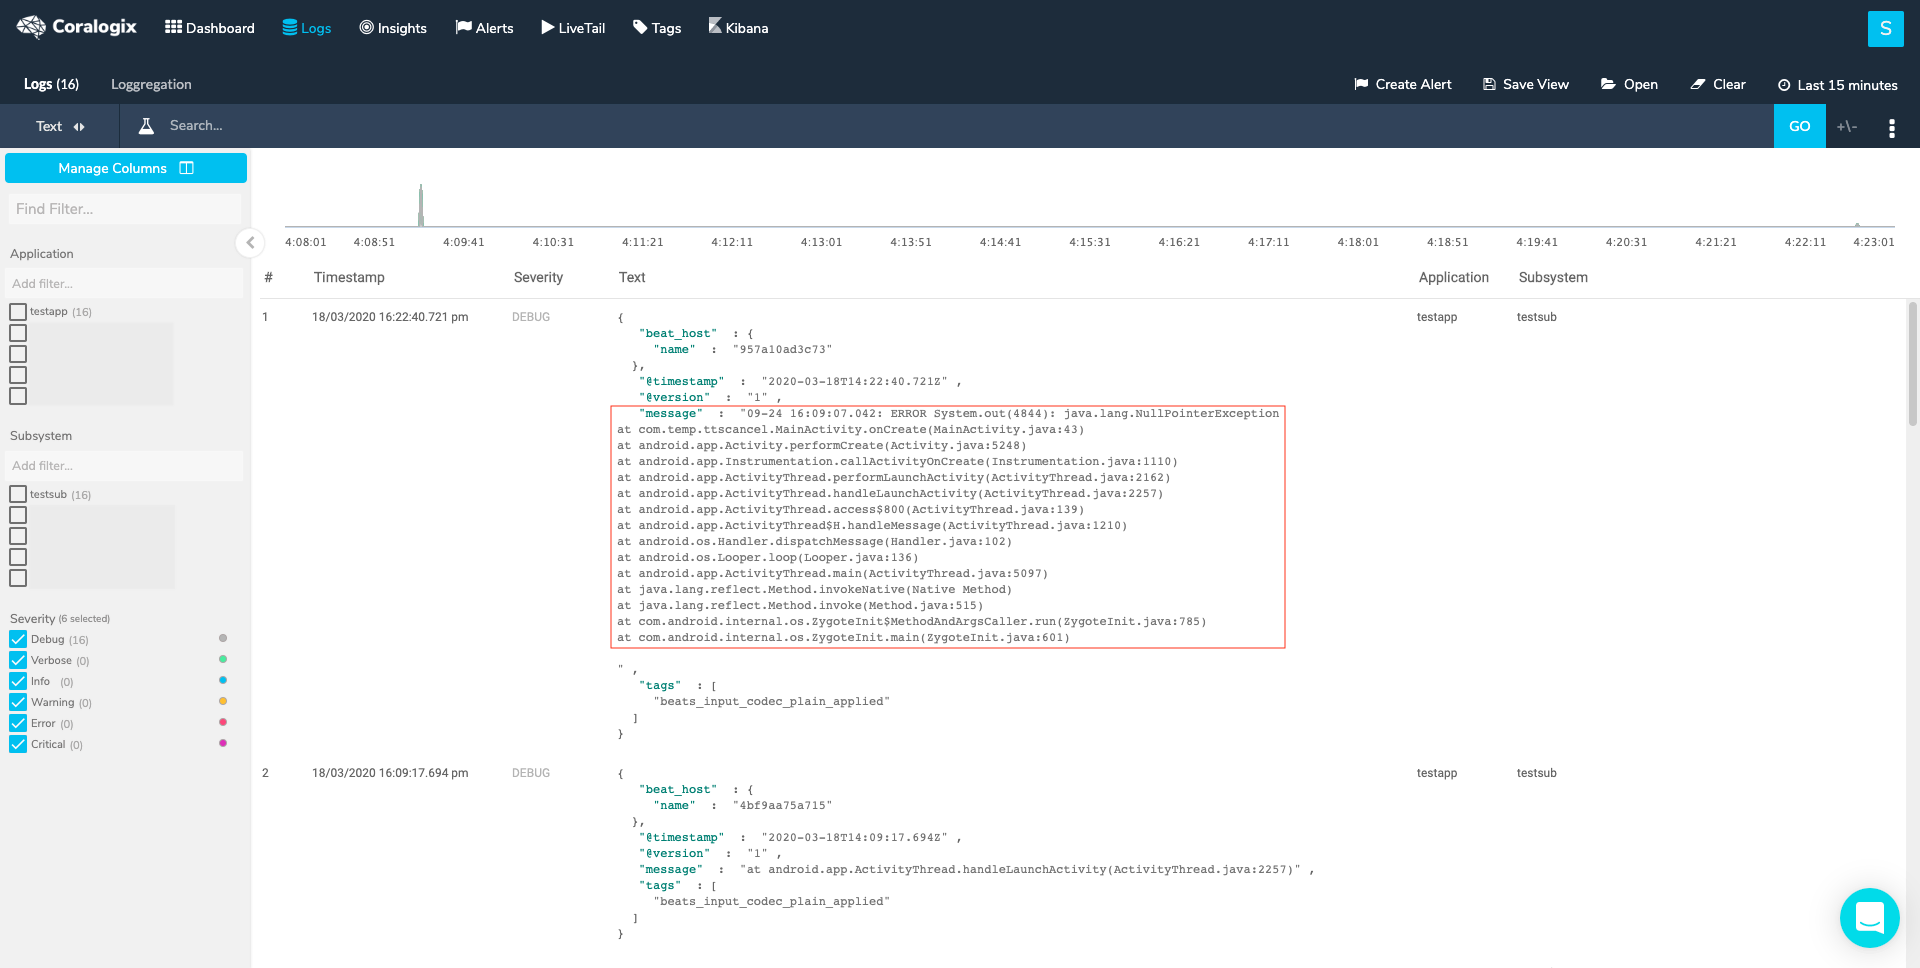
One of the commonly used built-in parsers is ‘multiline’. Multiline logs are logs that span across lines. Log shippers will ship these lines as separate logs, making it hard to get the needed information from the log. The ‘Multiline’ parser enables the restructuring and formatting of multiline logs into the one log they represent. You can see a few examples of this parser in action in our examples’ section. See here for a full logging in multiline guide
An example of a multiline configuration file using regex:
<source>
  @type tail
  path /var/log/msystem.log
  pos_file /var/log/msystem.log.pos
  tag mytag
  <parse>
          @type multiline
          # Each firstline starts with a pattern matching the below REGEX.
          format_firstline /^d{2,4}-d{2,4}-d{2,4} d{2,4}:d{2,4}:d{2,4}.d{3,4}/
          format1 /(?<message>.*)/
  </parse>
</source>
These input plug-ins support the parsing directive.
Match
The Match section uses a rule. Matches each incoming event to the rule and and routes it through an output plug-in. There are different output plug-ins. This is a simple example of a Match section:
<match mytag**>
   @type stdout
</match>
It will match the logs that have a tag name starting with mytag and direct them to stdout. Like the input plug-ins, the output ones come with their own parameters. See The http documentation as an example.
Combining the two previous directives’ examples will give us a functioning Fluentd configuration file that will read logs from a file and send them to stdout.
HTTP output plug-in
One of the most common plugins is HTTP. We recommend using the generic HTTP output plugin, as it has plenty of adjustability and exposed metrics. Just insert the private key and paste the correct endpoint (you can look at the table below). You can read more in our tutorial.
Here is a basic HTTP plug in example:
<match **>
  @type http
  @id out_http_coralogix
#The @id parameter specifies a unique name for the configuration. It is used as paths for buffer, storage, logging and for other purposes.
  endpoint "https://ingress.<domain>/logs/rest/singles"
  headers {"private_key":"xxxxxxx"}
  error_response_as_unrecoverable false
  <buffer tag>
    @type memory
    chunk_limit_size 5MB
    compress gzip
    flush_interval 1s
    overflow_action block
    retry_max_times 5
    retry_type periodic
    retry_wait 2
  </buffer>
  <secondary>
    #If any messages fail to send they will be send to STDOUT for debug.
    @type stdout
  </secondary>
</match>
Choose the correct https://ingress.<domain>/logs/rest/singles endpoint that matches the cluster under this URL.
Filter
Another common directive, and one that is mandatory in this case, is ‘filter’. The name of this directive is self explanatory. The filter plug-ins allow users to:
- Filter out events by grepping the value of one or more fields.
- Enrich events by adding new fields.
- Delete or mask certain fields for privacy and compliance.
- Parse text log messages into JSON logs
Filters can be chained together.
In order to pass our data to Coralogix API we must manipulate our data (using the record_transformer plugin) so the structure of the data will be valid by the API.
As an example, this filter will show the fields needed in order to be valid by the API:
  <filter **>
    @type record_transformer
    @log_level warn
    #will only show warn and info logs
    enable_ruby true
    #allows the usage of ${}
    auto_typecast true
    renew_record true
    <record>
      # In this example we are using record to set values.
      # Values can also be static, dynamic or simple variables
      applicationName app
      subsystemName subsystem
      timestamp ${time.strftime('%s%L')} # Optional
      text ${record.to_json} # using {record['message']} will display as txt
    </record>
  </filter>
At this point we have enough Fluentd knowledge to start exploring some actual configuration files.
The rest of this document includes more complex examples of Fluentd configurations. They include detailed comments and you can use them as references to get additional information about different plug-ins and parameters or to learn more about Fluentd.
Configuration examples
Example 1
This configuration example shows how to use the rewrite_tag_filter plug-in to separate the logs into two groups and send them with different metadata values.
<source>
  @type tail
  #Reading from file locateed in path and saving the pointer to the file line in pos_file
  @label @CORALOGIX
  #Label reduces complex tag handling by separating data pipelines, CORALOGIX events are routed to label @CORALOGIX
  path /var/log/nginx/access.log
  pos_file /var/log/td-agent/nginx/access.log.pos
  tag nginx.access
  #tagging it as the nginx access logs
  <parse>
    @type nginx
    #nginx parsing plugin
  </parse>
</source>

<source>
  @type tail
  @label @CORALOGIX
  path /var/log/nginx/error.log
  pos_file /var/log/td-agent/nginx/error.log.pos
  tag nginx.error
  #tagging it as the nginx error logs
  <parse>
    @type none
    #no parsing is done
  </parse>
</source>

<label @CORALOGIX>
#as mentioned above events are routed from @label @CORALOGIX
  <filter nginx.access>
  #nginx access logs will go through this filter
    @type record_transformer
    #using this plugin to manipulate our data
    <record>
      severity "info"
      #nginx access logs will be sent as info
    </record>
  </filter>

  <filter nginx.error>
    @type record_transformer
    #error logs will go throgh this filter
    <record>
      severity "error"
      #error logs will be sent as error
    </record>
  </filter>
  <filter **>
    @type record_transformer
    @log_level warn
    enable_ruby true
    auto_typecast true
    renew_record true
    <record>
      # In this example we are using record.dig to dynamically set values.
      # Values can also be static or simple variables
      applicationName fluentD
      subsystemName ${tag}
      timestamp ${time.strftime('%s%L')} # Optional
      text ${record['message']}
#will send the log as a regular text
    </record>
  </filter>
  <match **>
    @type http
    @id coralogix
    endpoint "https://ingress.coralogixstg.wpengine.com/logs/rest/singles"
    headers {"private_key":"XXXXX"}
    retryable_response_codes 503
    error_response_as_unrecoverable false
    <buffer>
      @type memory
      chunk_limit_size 5MB
      compress gzip
      flush_interval 1s
      overflow_action block
      retry_max_times 5
      retry_type periodic
      retry_wait 2
    </buffer>
    <secondary>
      #If any messages fail to send they will be send to STDOUT for debug.
      @type stdout
    </secondary>
  </match>
</label>
Example 2
In this example a file is read starting with the last line (the default). The message section of the logs is extracted and the multiline logs are parsed into a json format.
<source>
  @type tail
  path M:/var/logs/inputlogs.log
  pos_file M:/var/logs/inputlogs.log.pos
  tag mycompany
  <parse>
# This parse section will find the first line of the log that starts with a date. The log
#includes  the substring “message”. ‘Parse’ will extract what follows “message” into a #json field called ‘message’. See additional details in #Example 1.
    @type multiline
    format_firstline /^d{2,4}-d{2}-d{2,4}/
    format1 /(?<message>.*)/
  </parse>
</source>
  <match **>
#match is going to use the HTTP plugin
    @type http
    @davidcoralogix-com
#The @id parameter specifies a unique name for the configuration. It is used as paths for buffer, storage, logging and for other purposes.
    endpoint "https://ingress.coralogixstg.wpengine.com/logs/rest/singles"
    headers {"private_key":"XXXXX"}
    retryable_response_codes 503
    error_response_as_unrecoverable false
    <buffer>
      @type memory
      chunk_limit_size 5MB
      compress gzip
      flush_interval 1s
      overflow_action block
      retry_max_times 5
      retry_type periodic
      retry_wait 2
    </buffer>
    <secondary>
      #If any messages fail to send they will be send to STDOUT for debug.
      @type stdout
    </secondary>
  </match>
Example 3
This example uses the http input plug-in. This plug-in enables you to gather logs while sending them to an end point. It uses the enable_ruby option to transform the logs and uses the copy plug-in to send logs to two different inputs.
<source>
  @type http
  port 1977
  bind 0.0.0.0
  tag monitor
#This indicates the max size of a posted object
  body_size_limit 2m
#This is the timeout to keep a connection alive
  keepalive_timeout 20s
#If true adds the http prefix to the log
  add_http_headers true
#If true adds the remote, client address, to the log. If there are multiple forward headers in the request it will take the first one
  add_remote_addr true
  <parse>
     @type none
  </parse>
</source>

<filter monitor>
#record_transformer is a filter plug-in that allows transforming, deleting, and adding events
  @type record_transformer
#With the enable_ruby option, an arbitrary Ruby expression can be used inside #${...}
  enable_ruby
#Parameters inside <record> directives are considered to be new key-value pairs
  <record>
#Parse json data inside of the nested field called “log”. Very useful with #escaped fields. If log doesn’t exist or is not a valid json, it will do #nothing.
    log ${JSON.parse(record["log"]) rescue record["log"]}
#This will create a new message field under root that includes a parsed log.message field.
    message ${JSON.parse(record.dig(“log”, “message”)) rescue ""}
  </record>
</filter>
<match monitor>
  @type copy
  <store>
    @type http
    @id coralogix
    endpoint "https://ingress.coralogixstg.wpengine.com/logs/rest/singles"
    headers {"private_key":"XXXXX"}
    retryable_response_codes 503
    error_response_as_unrecoverable false
    <buffer>
      @type memory
      chunk_limit_size 5MB
      compress gzip
      flush_interval 1s
      overflow_action block
      retry_max_times 5
      retry_type periodic
      retry_wait 2
    </buffer>
  </store>

  <store>
    @type stdout
    output_type json
  </store>
</match>

<match **>
#Split is a third party output plug-in. It helps split a log and parse #specific fields.
  @type split
#separator between split elements
  separator   s+
#regex that matches the keys and values within the splitted key
  format      ^(?<key>[^=]+?)=(?<value>.*)$
#Key that holds the information to be splitted
  key_name message
#keep the original field
  reserve_msg yes
  keep_keys HTTP_PRIVATE_KEY
</match>
Example 4
This example uses label in order to route the logs through its Fluentd journey. At the end we send Fluentd logs to stdout for debug purpose.
# Read Tomcat logs
<source>
#Logs are read from a file located at path. A pointer to the last position in #the log file is located at pos_file
  @type tail
#Labels allow users to separate data pipelines. You will see the lable section #down the file.
  @label @AGGREGATION
  path /usr/local/tomcat/logs/*.*
#adds the watched file path as a value of a new key filename in the log
  path_key filename
#This path will not be watched by fluentd
  exclude_path ["/usr/local/tomcat/logs/gc*"]
  pos_file /fluentd/log/tomcat.log.pos
  <parse>
#This parse section uses the multi_format plug-in. This plug-in needs to be #downloaded and doesn’t come with Fluentd. After installing it users can #configure multiple <pattern>s to #specify multiple parser formats. In this #configuration file we have 2 patterns being formatted.
    @type multi_format
    # Access logs
    <pattern>
      format regexp
      expression /^(?<client_ip>.*?) [(?<timestamp>d{2}/[a-zA-Z]{3}/d{4}:d{2}:d{2}:d{2} +d{4})] "(?<message>.*?)" (?<response_code>d+) (?<bytes_send>[0-9-]+) (?<request_time>d+)$/
      types response_code:integer,bytes_send:integer,request_time:integer
#Specifies time field for event time. If the event doesn't have this field, #current time is used.
      time_key timestamp
#Processes value using specific formats
      time_format %d/%b/%Y:%T %z
#When true keeps the time key in the log
      keep_time_key true
    </pattern>
# Stacktrace or undefined logs are kept as is
    <pattern>
      format none
    </pattern>
  </parse>
  tag tomcat
</source>

# Read Cloud logs
<source>
  @type tail
  @label @AWS
  path /usr/local/tomcat/logs/gc*
  pos_file /fluentd/log/gc.log.pos
  format none
  tag gclogs
</source>

# Route logs according to their types
<label @AGGREGATION>
  # Strip log message using a filter section
  <filter tomcat.**>
#record_transformer is a filter plug-in that allows transforming, deleting, and #adding events
    @type record_transformer
#With the enable_ruby option, an arbitrary Ruby expression can be used inside #${...}
    enable_ruby
#Parameters inside <record> directives are considered to be new key-value pairs
    <record>
      message ${record["message"].strip rescue record["message"]}
    </record>
  </filter>
# Delete undefined character
# This filter section filters the tomcat logs
  <filter tomcat.**>
#record_transformer is a filter plug-in that allows transforming, deleting, and #adding events
    @type record_transformer
    Enable_ruby
#Parameters inside <record> directives are considered to be new key-value pairs
    <record>
      message ${record["message"].encode('UTF-8', invalid: :replace, undef: :replace, replace: '?') rescue record["message"]}
    </record>
  </filter>

# Concat stacktrace logs to processing
  <filter tomcat.**>
#A plug-in that needs to be installed
    @type concat
#This is the key for part of the multiline log
    key message
#This defines the separator
    separator " "
#The key to determine which stream an event belongs to
    stream_identity_key filename
#The regexp to match beginning of multiline.
    multiline_start_regexp /^((d{2}/d{2}/d{4} d{2}:d{2}:d{2}.d{1,3})|(d{2}-[a-zA-Z]{3}-d{4} d{2}:d{2}:d{2}.d{1,3})|NOTE:) /
#Use timestamp of first record when buffer is flushed.
    use_first_timestamp true
#The number of seconds after which the last received event log will be flushed
    flush_interval 5
#The label name to handle events caused by timeout
    timeout_label @PROCESSING
  </filter>
# Route logs to processing
  <match tomcat.**>
    @type relabel
    @label @PROCESSING
  </match>
</label>

 # Process simple logs before sending to Coralogix
<label @PROCESSING>
# Parse stacktrace logs
  <filter tomcat.**>
    @type parser
    format /^(?<timestamp>d{2}/d{2}/d{4} d{2}:d{2}:d{2}.d{1,3}) (?<hostname>.*?)|(?<thread>.*?)|(?<severity>[A-Z ]+)|(?<TenantId>.*?)|(?<UserId>.*?)|(?<executor>.*?) - (?<message>.*)$/
#Specifies time field for event time. If the event doesn't have this field, #current time is used.
    time_key timestamp
#Processes value using specific formats
    time_format %d/%m/%Y %T.%L
#When true keeps the time key in the log
    keep_time_key true
    key_name message
    reserve_data true
    emit_invalid_record_to_error false
  </filter>

 # Parse access logs request info
  <filter tomcat.**>
    @type parser
    format /^(?<method>GET|HEAD|POST|PUT|DELETE|CONNECT|OPTIONS|TRACE|PATCH) (?<path>/.*?) (?<protocol>.+)$/
    key_name message
    hash_value_field request
    reserve_data true
    emit_invalid_record_to_error false
  </filter>

# Other logs
  <filter tomcat.**>
#This is a filter plug-in that pases the logs
    @type parser
    format /^(?<timestamp>d{2}-[a-zA-Z]{3}-d{4} d{2}:d{2}:d{2}.d{1,3}) (?<severity>[A-Z ]+) [(?<thread>.*?)] (?<executor>.*?) (?<message>.*)$/
#Specifies time field for event time. If the event doesn't have this field, #current time is used.
    time_key timestamp
#Processes value using specific formats
    time_format %d-%b-%Y %T.%L
#When true keeps the time key in the log
    keep_time_key true
#message is a key in the log to be filtered
    key_name message
#keep the other key:value pairs
    reserve_data true
#Emit invalid records to @ERROR label. Invalid cases are key not exist, format #is not matched, and unexpected error. If you want to ignore these errors set #to false.
    emit_invalid_record_to_error false
  </filter>

# Add filename and severity
  <filter tomcat.**>
#record_transformet is a filter plug-in that allows transforming, deleting, and #adding events
    @type record_transformer
#With the enable_ruby option, an arbitrary Ruby expression can be used inside #${...}
    Enable_ruby
#Parameters inside <record> directives are considered to be new key-value pairs
    <record>
#Overwrite the value of filename with the filename itself without the full path
      filename ${File.basename(record["filename"])}
#Takes the value of the field “severity” and trims it. If there is no severity #field create it and return the value DEBUG
      severity ${record["severity"].strip rescue "DEBUG"}
    </record>
  </filter>
  # Route logs to output
  <match tomcat.**>
#Routes all logs to @labe
    @type relabel
    @label @CORALOGIX
  </match>
</label>

<label @CORALOGIX>
  <match **>
    @type http
    @id coralogix
    endpoint "https://ingress.coralogixstg.wpengine.com/logs/rest/singles"
    headers {"private_key":"d2aaf000-4bd8-154a-b7e0-aebaef7a9b2f"}
    retryable_response_codes 503
    error_response_as_unrecoverable false
    <buffer>
      @type memory
      chunk_limit_size 5MB
      compress gzip
      flush_interval 1s
      overflow_action block
      retry_max_times 5
      retry_type periodic
      retry_wait 2
    </buffer>
</label>

# Send GC logs to AWS S3 bucket
#<label> indicates that only AWS labeled logs will be processed here. They will #skip sections not labeled with AWS
<label @AWS>
  <match gclogs.**>
#The S3 output plugin is included with td-agent (not with Fluentd). You can get #information about its specific parameters in the documentation
   @type s3
   aws_key_id "#{ENV['AWS_ACCESS_KEY_ID']}"
   aws_sec_key "#{ENV['AWS_SECRET_ACCESS_KEY']}"
   s3_bucket "#{ENV['S3Bucket']}"
   s3_region us-east-1
   path /logs/"#{ENV['SUBSYSTEM_NAME']}"
   buffer_path /fluentd/logs
   store_as text
   utc
   time_slice_format %Y%m%d%H
   time_slice_wait 10m
   s3_object_key_format "%{path}%{time_slice}_#{Socket.gethostname}%{index}.%{file_extension}"
   buffer_chunk_limit 256m
   <buffer time>
    timekey      1h # chunks per hours ("3600" also available)
    timekey_wait 5m # 5mins delay for flush ("300" also available)
   </buffer>
  </match>
</label>

# Print internal Fluentd logs to console for debug
<match fluent.**>
  @type stdout
  output_type hash
</match>
Example 5
The following configuration reads the input files starting with the first line. Then transform multi line logs into a json format. It sends the logs to stdout.
<source>
  @type tail
#The parameter ‘read_from_head’ is set to true. It will read all files from the #first line instead of #the default last line
  tag audit
  read_from_head true
# Adds the file name to the sent log.
  path_key filename
  path /etc/logs/product_failure/*.*.testInfo/smoke*-vsim-*/mroot/etc/log/auditlog.log.*
  pos_file /etc/logs/product_failure/audit_logs.fluentd.pos
  <parse>
#The multiline parser plugin parses multiline logs. This plugin is multiline #version of regexp parser.
    @type multiline
#This will match the first line of the log to be parsed. The plugin can skip #the logs until format_firstline is matched.
    format_firstline /^(?<timestamp>[a-zA-Z]{3} [a-zA-Z]{3} *[0-9]{1,2} [0-9]{2}:[0-9]{2}:[0-9]{2}(?: [A-Z]+)?)/
#Specifies regexp patterns. For readability, you can separate regexp patterns #into multiple format1 … formatN. The regex will match the log and each named #group will become a key:value pair in a json formatted log. The key will be #the group name and the value will be the group value.
    format1 /^(?<timestamp>[a-zA-Z]{3} [a-zA-Z]{3} *[0-9]{1,2} [0-9]{2}:[0-9]{2}:[0-9]{2}(?: [A-Z]+)?) [(?<machine>[^:]+):(?<shell>[^:]+):(?<severity>[^]]+)]: (?<message>.*)/
  </parse>
</source>

# Send to STDOUT
<match *>
  @type stdout
</match>