The new standard of observability is here. Discover Olly, the industry’s first

Platforms like Heroku give you the freedom to focus on building great applications rather than getting lost setting up and maintaining infrastructure. Heroku provides many great features to achieve this, and the one we will focus on today is logging. This tutorial, will uncover best practices for making the most of Heroku logs and integrating them with Coralogix logging. To better understand how logs are generated, we’ll begin by revisiting the fundamentals of Heroku’s architecture. Feel free to skip to the logging section if you are already familiar with those.
Heroku Logs – Basic concepts
Cheat Sheet
| Command | Description |
| heroku logs -t heroku logs -tp router | (-tail) real-time log stream (-tp) router log entries only |
| heroku logs -n 200 | specify the number of log entries to display. |
| heroku logs –d router | (–dyno) filter to specify dyno, in this example, router |
| heroku logs –source app | (–source) filter to specify source, in this example, app logs. |
| heroku drains –json | obtain the drain tokens for your app’s log drains |
| heroku releases heroku releases:info v19 heroku rollback | View release history View info on a version (here v19) Rollback a release |
| heroku addons:create coralogix:test | Add a log analytics add-on |
Heroku Basic Architecture
Applications deployed on Heroku live in lightweight Linux containers called Dynos. Dynos can range from holding simple web apps to complex enterprise systems. The scalability of these containers, vertically and horizontally, is one of the flexible aspects of Heroku that developers leverage. They include the following types:
- Web Dynos are web processes that receive HTTP traffic from routers.
- Worker Dynos may be any non-web-type process type used for background processes, queueing, and cron jobs.
- One-off dynos are ad-hoc or temporary dynos that can run as attached or detached from local machines. One-off Dynos are typically used for DB migrations, console sessions, background jobs, and other administrative tasks, such as processes started by the Heroku Scheduler.
Heroku Logging
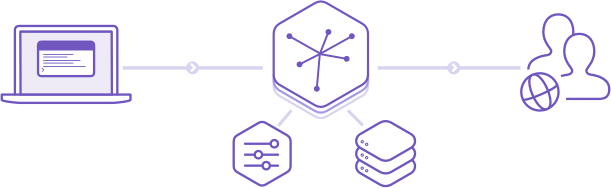
Heroku provides a tool called Logplex, that collates and routes log streams from all running processes into a single channel. Logs from that channel can then be sent through a Drain to a third-party logging add-on that specializes in log monitoring, such as Coralogix.
Heroku Runtime Logs
The Heroku platform maintains four categories of logs for deployed apps. For example, log entries generated by a dependency-related error thrown when running an app are separated from messages about deploying new code. The four categories are as follows:
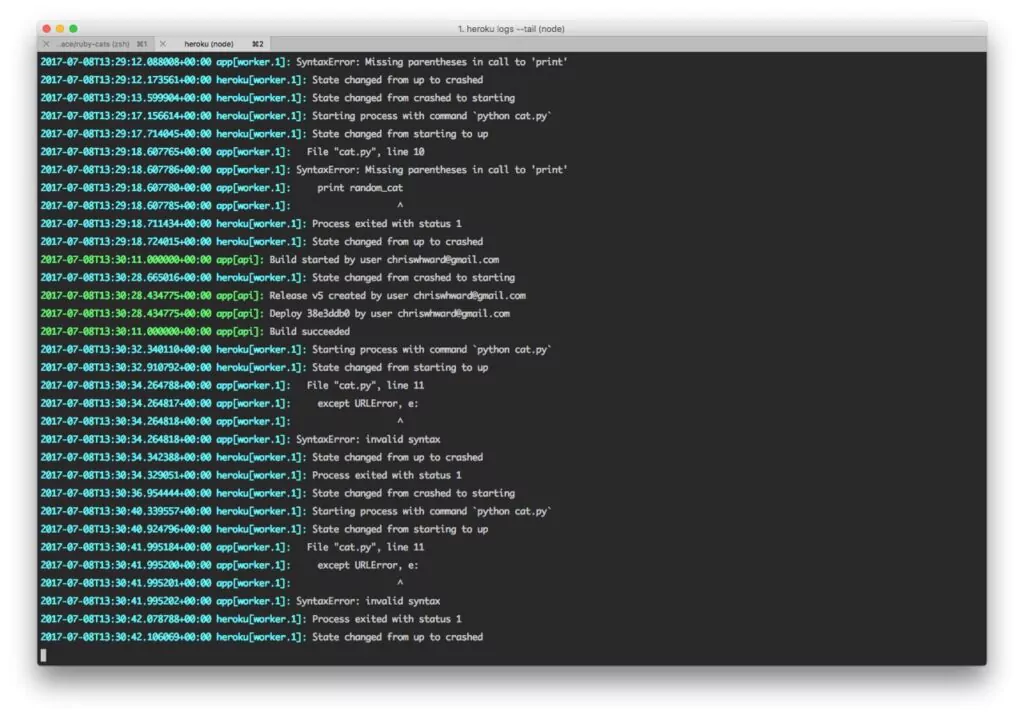
- App logs – Entries generated when an app runs and throws an exception, for example, for a missing dependency such as an inaccessible library. The CLI log filter is: –source app.
- API logs – Developer administrative actions (such as deploying new code) trigger entries to the API log. Scaling processes and toggling maintenance modes are other examples in this category. These logs can set progressive delays in retrying an API call when one fails. API logs can also be used to catch authentication failures and issues with push requests. The CLI filter is: –source app –dyno api
- System logs – Contain information about hardware systems and system processes, or in other words, infrastructure. A system log entry will be generated when the Heroku platform restarts an app because of an infrastructure issue (e.g., failed HTTP request). The CLI filter to query system log entries is: –source heroku
- Add-on logs – Add-on logs are generated by add-ons to the Heroku platform, like Redis Cloud, MongoDB, SendGrid, or Coralogix.
Heroku Build Logs
Heroku build logs are generated by successful and failed builds in your continuous integration and deployment pipelines.
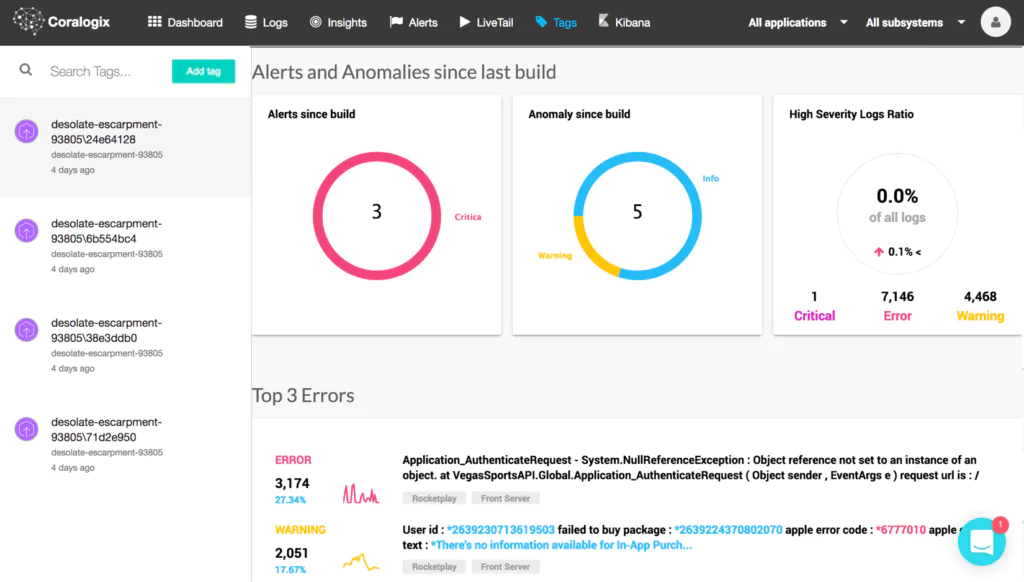
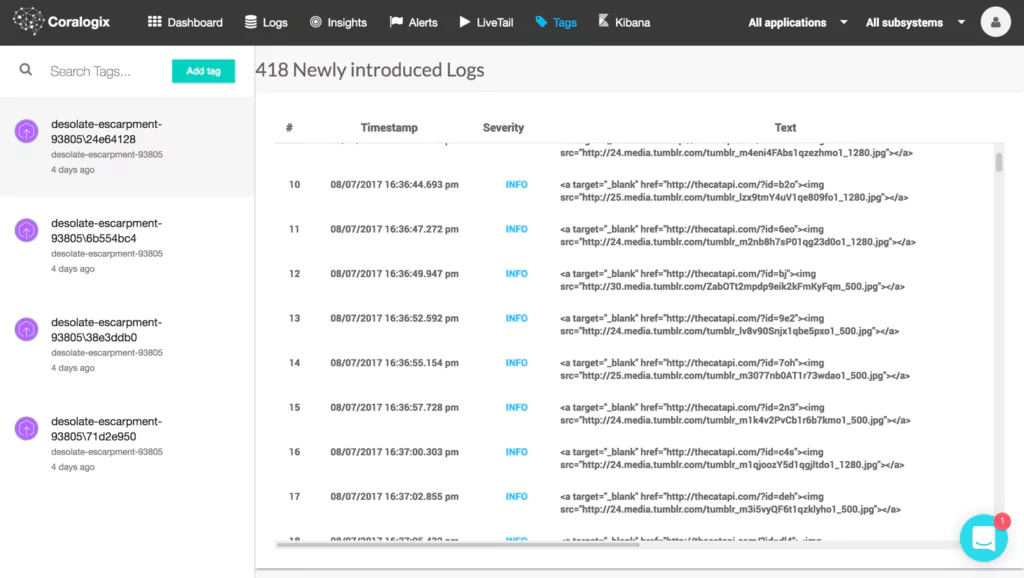
These logs can be accessed in your app’s activity feed on the Heroku dashboard. They can also be configured with a tool like Coralogix to benchmark errors for each build version.
Log Severity
Log data can be quantified by level of urgency. Here is the standard set of levels used in Heroku logs with examples of events for which Heroku Logplex generates a log entry:
| Severity | Description | Example |
| emergency | system is unusable | “Child cannot open lock file. Exiting” |
| alert | Immediate action required | “getpwuid: couldn’t determine user name from uid” |
| critical | Threats to app functionality | “socket: Failed to get a socket, exiting child” |
| error | Client not receiving adequate service | “Premature end of script headers” |
| warning | issues which don’t threaten app functioning but may need observation | “child process 01 did not exit, sending another SIGHUP” |
| notice | Normal events which may need monitoring | “httpd: caught SIGBUS, attempting to dump core in …” |
| info | Informational | “Server is busy…” |
| debug | Logs normal events for debugging | “opening config file …” |
| trace 1-8 | For finding functions in code, locating code chunks | “proxy: FTP: … ” |
View Heroku Logs
Logs can be accessed and viewed from the Heroku platform. After Heroku is installed locally, developers can also use the CLI to view, define, filter, target, and query logs.
The most commonly used CLI command to retrieve logs is:
$ heroku logs
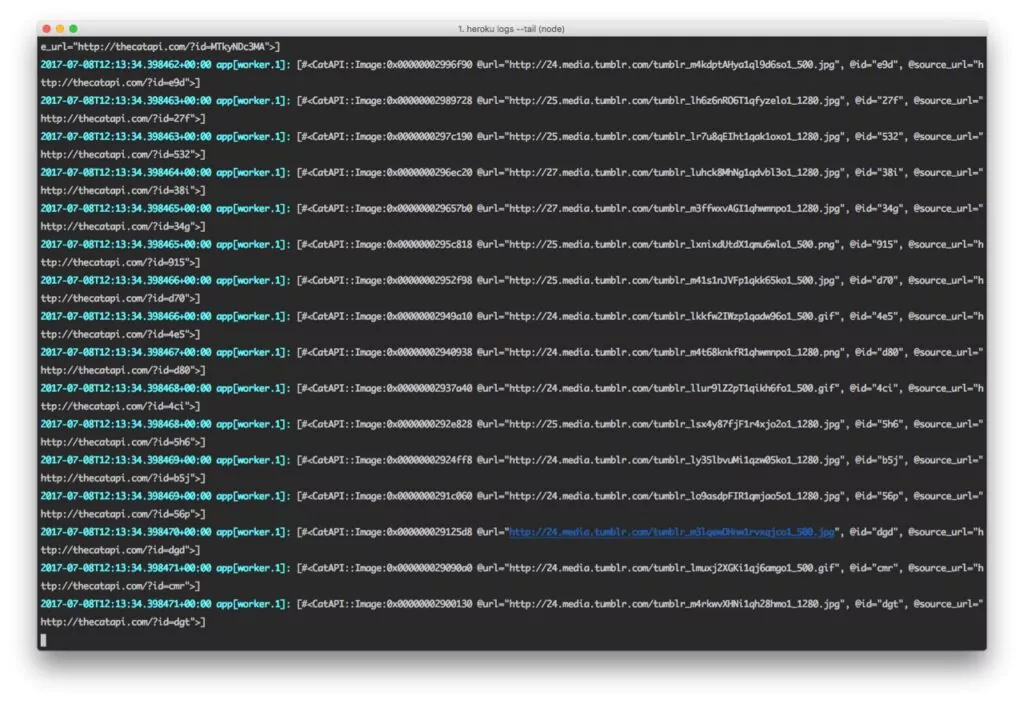
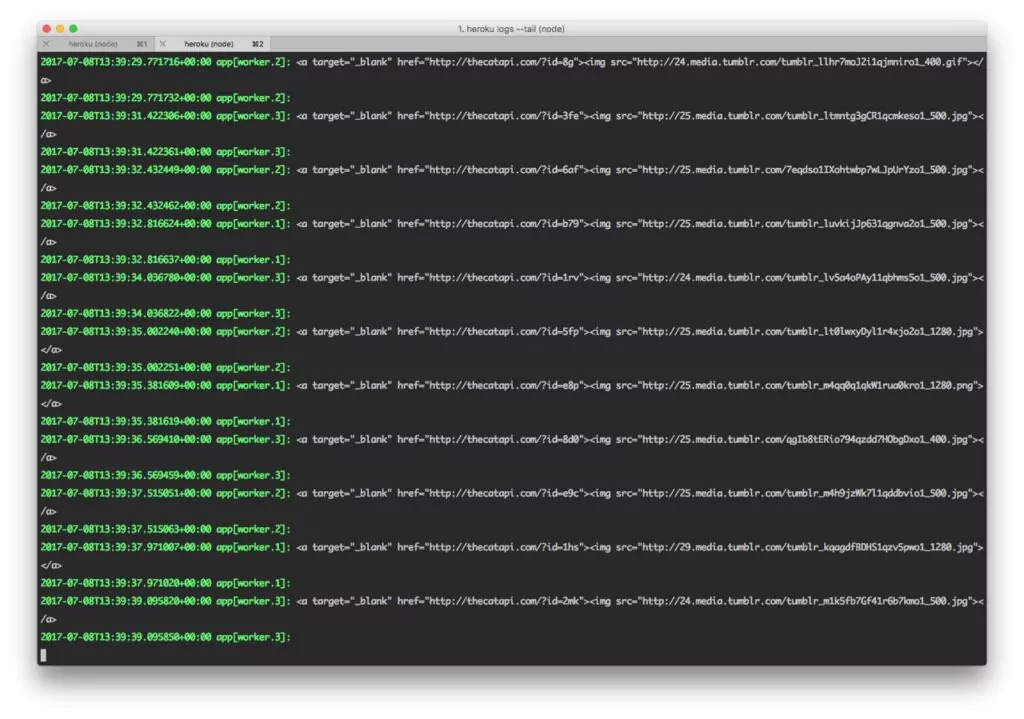
Let’s look at the anatomy of a Heroku log. First, enter the following CLI command to display 200 logs:
$ heroku logs -n 200
Heroku would show 100 lines by default without the -n parameter above. Using the -n, or –num parameter, we can display up to 1500 lines from the log. Here is an example of a typical log entry:
2023-01-02T15:13:02.723498+00:01 heroku[router]: at=info method=GET path="/posts" host=myapp.herokuapp.com" fwd="178.68.87.34" dyno=web.1 connect=1ms service=18ms status=200 bytes=975 2023-09-16T15:13:47.893472+00:00 app[worker.3]: 2 jobs processed at 16.6761 j/s, 0 failed ...
In the above entry, we can see the following information:
- Timestamp – The precise time when the Dyno generated the log entry, according to the standard RFC5424 format. The default timezone is UTC (see below for how to change the default timezone).
- Source – web dynos, background workers, and crons generate log entries shown as app. HTTP routers and dyno managers are shown as Heroku.
- Dyno – In this example, worker #3 is the Dyno, and the Heroku HTTP router is shown as router.
- Message – contains the content, in this case, the status, which is equal to 200, and the byte length. In practice, the message contents typically require smart analytics apps to assist with interpretation.
The filter is another important CLI parameter. For example, by using the following filter, we can choose to display only the log entries originating from a specific Dyno:
$ heroku logs --dyno
But also logs originating from a specific source, such as our app:
$ heroku logs --source app
Or system logs:
$ heroku logs --source heroku
As mentioned, Heroku uses the UTC time zone for its dynos by default. You can change it, although the recommended approach is to convert to the client’s local timezone when displaying the data.
To check the current timezone:
$ heroku config:get TZ
To change the timezone for Heroku logs:
$ heroku config:add TZ="America/New_York"
Here’s a complete list of supported timezone formats.
Best Practices for Heroku Logging
Although some logging practices will depend on your app’s specificities and the programming languages you use, here are five universal best practices for logging with Heroku:
- Log useful events
Ideally, a Heroku log should contain an entry for every useful event in the behavior of an application. Examples of useful events are:
- Authentication, Authorization, and Access – These events include successful and failed authentication and authorizations, system access, data access, and application access.
- Changes – These events include changes to systems or applications, changes to data (creation and destruction), application installation, and changes.
- Availability – Availability events include the startup and shutdown of systems and applications, builds and releases, faults and errors that affect application availability, and backup successes and failures.
- Resources – Resource issues to log include exhausted resources, exceeded capacities, and connectivity issues.
- Threats – Some common threats to logs include invalid inputs and security issues known to affect the application.
- Be intentional about the data you include
Don’t log sensitive data like passwords, API keys, or other confidential information. If you need to log something for debugging purposes, obfuscate or redact the sensitive parts.
Do include contextual information like requests and session IDs in your logs. This can help you trace a specific request’s lifecycle and troubleshoot issues.
- Structure your logs
Use structured log formats like JSON or key-value pairs to make log entries more machine-readable, as this can simplify log analysis and parsing. You can also use logging libraries or frameworks designed for your programming language, such as Winston for Node.js, Log4j for Java, or Django logging for Python. These libraries provide structured logging and allow you to configure log levels easily.
- Use correct log levels
Use different log levels (e.g., DEBUG, INFO, WARN, ERROR) to categorize log messages based on severity. This helps you filter and analyze logs effectively.
- Define log retention policies
Define log retention policies to manage log data storage efficiently. Store logs for a reasonable period based on your compliance and debugging needs. Heroku’s retention period is one week, so you should consider adding a logging add-on for production-ready persistence of logs.
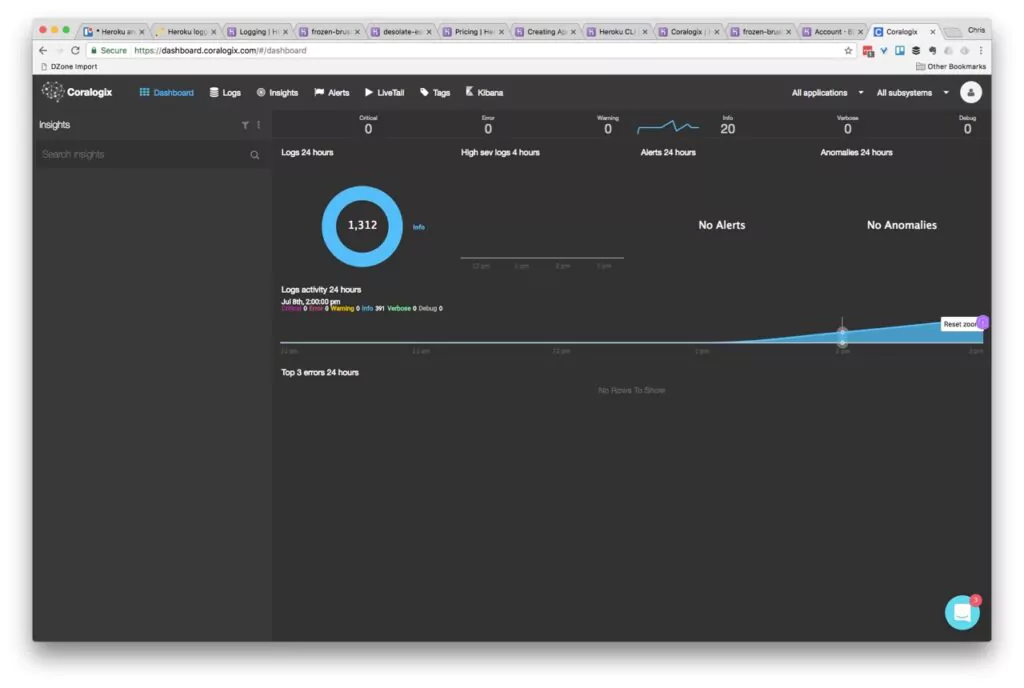
Set up a Logging Add-on: Coralogix
To bypass Heroku’s relatively short retention period (1 week) and 1500 log entries history limit, you must either set up an add-on or a custom drain. A logging add-on provides capabilities for managing and analyzing logs, which will help troubleshoot issues, monitor application performance, and derive insights from your log data. It streamlines the log management process, making it an essential tool for maintaining a healthy and reliable application on the Heroku platform.
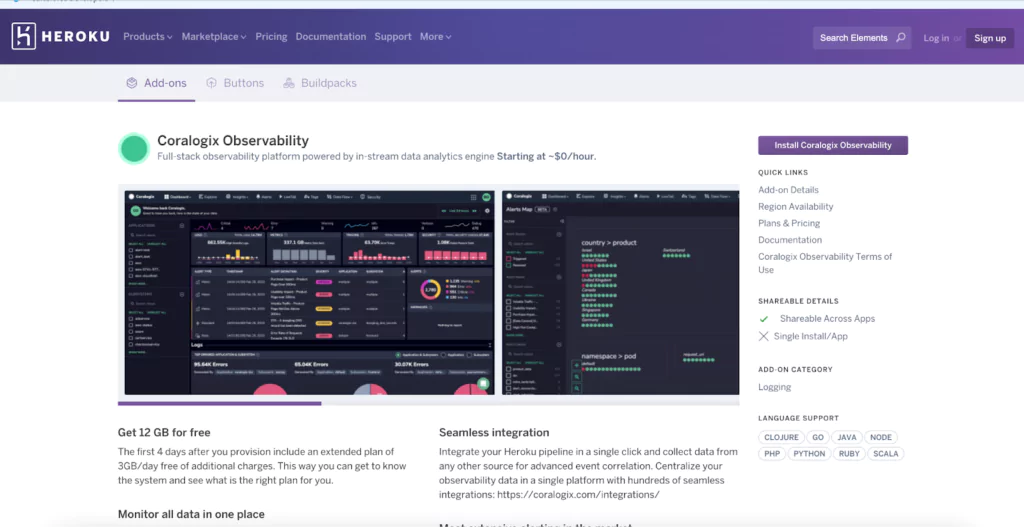
Setting up an add-on with Heroku is pretty straightforward. Let’s take Coralogix as an example:
You can head to https://elements.heroku.com/addons/coralogix and click ‘Install Coralogix Observability.’ You can also do this straight from your Heroku dashboard by clicking on the ‘Configure add-ons’ option.
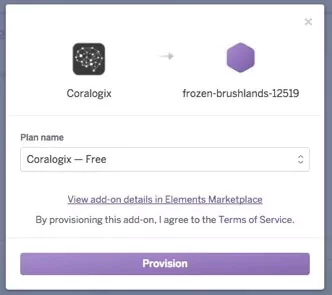
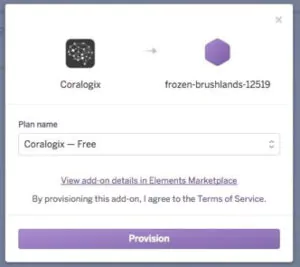
Next, you can choose a plan and your Heroku destination app.
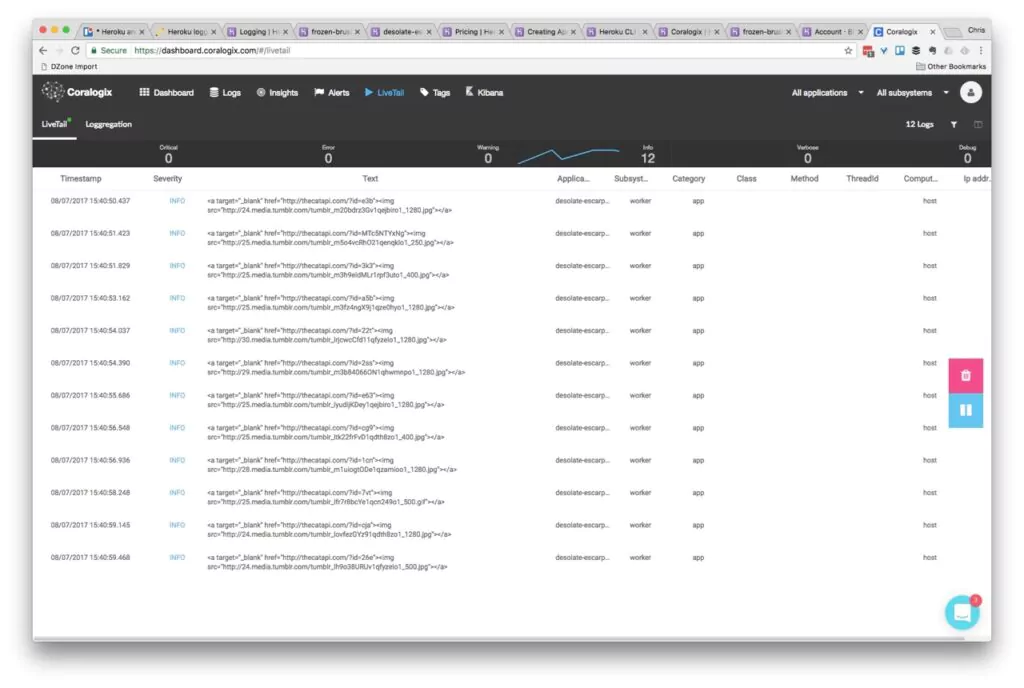
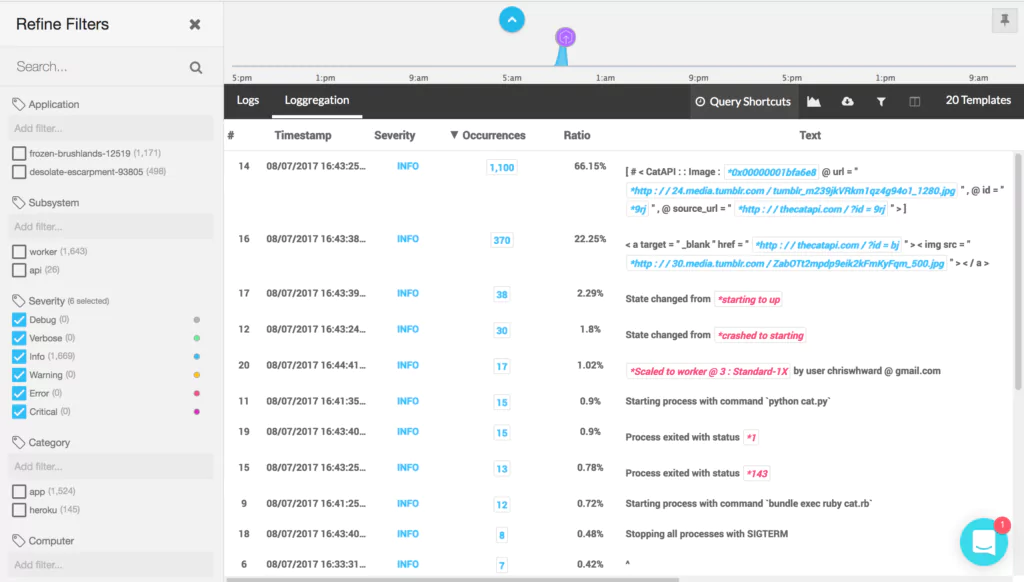
Submit your order, and wait a few seconds for the add-on to be provisioned. From this point, any logs your application generates will feed into Coralogix! To make it better still, you can install the Extension Package for Heroku that includes out-of-the-box Heroku parsing rules, 20+ alerts, and a predefined Kibana dashboard. All you need to do is go to Coralogix Extension Packages and deploy the Heroku Extension Package.