How to Maximize Logging Performance with Kafka

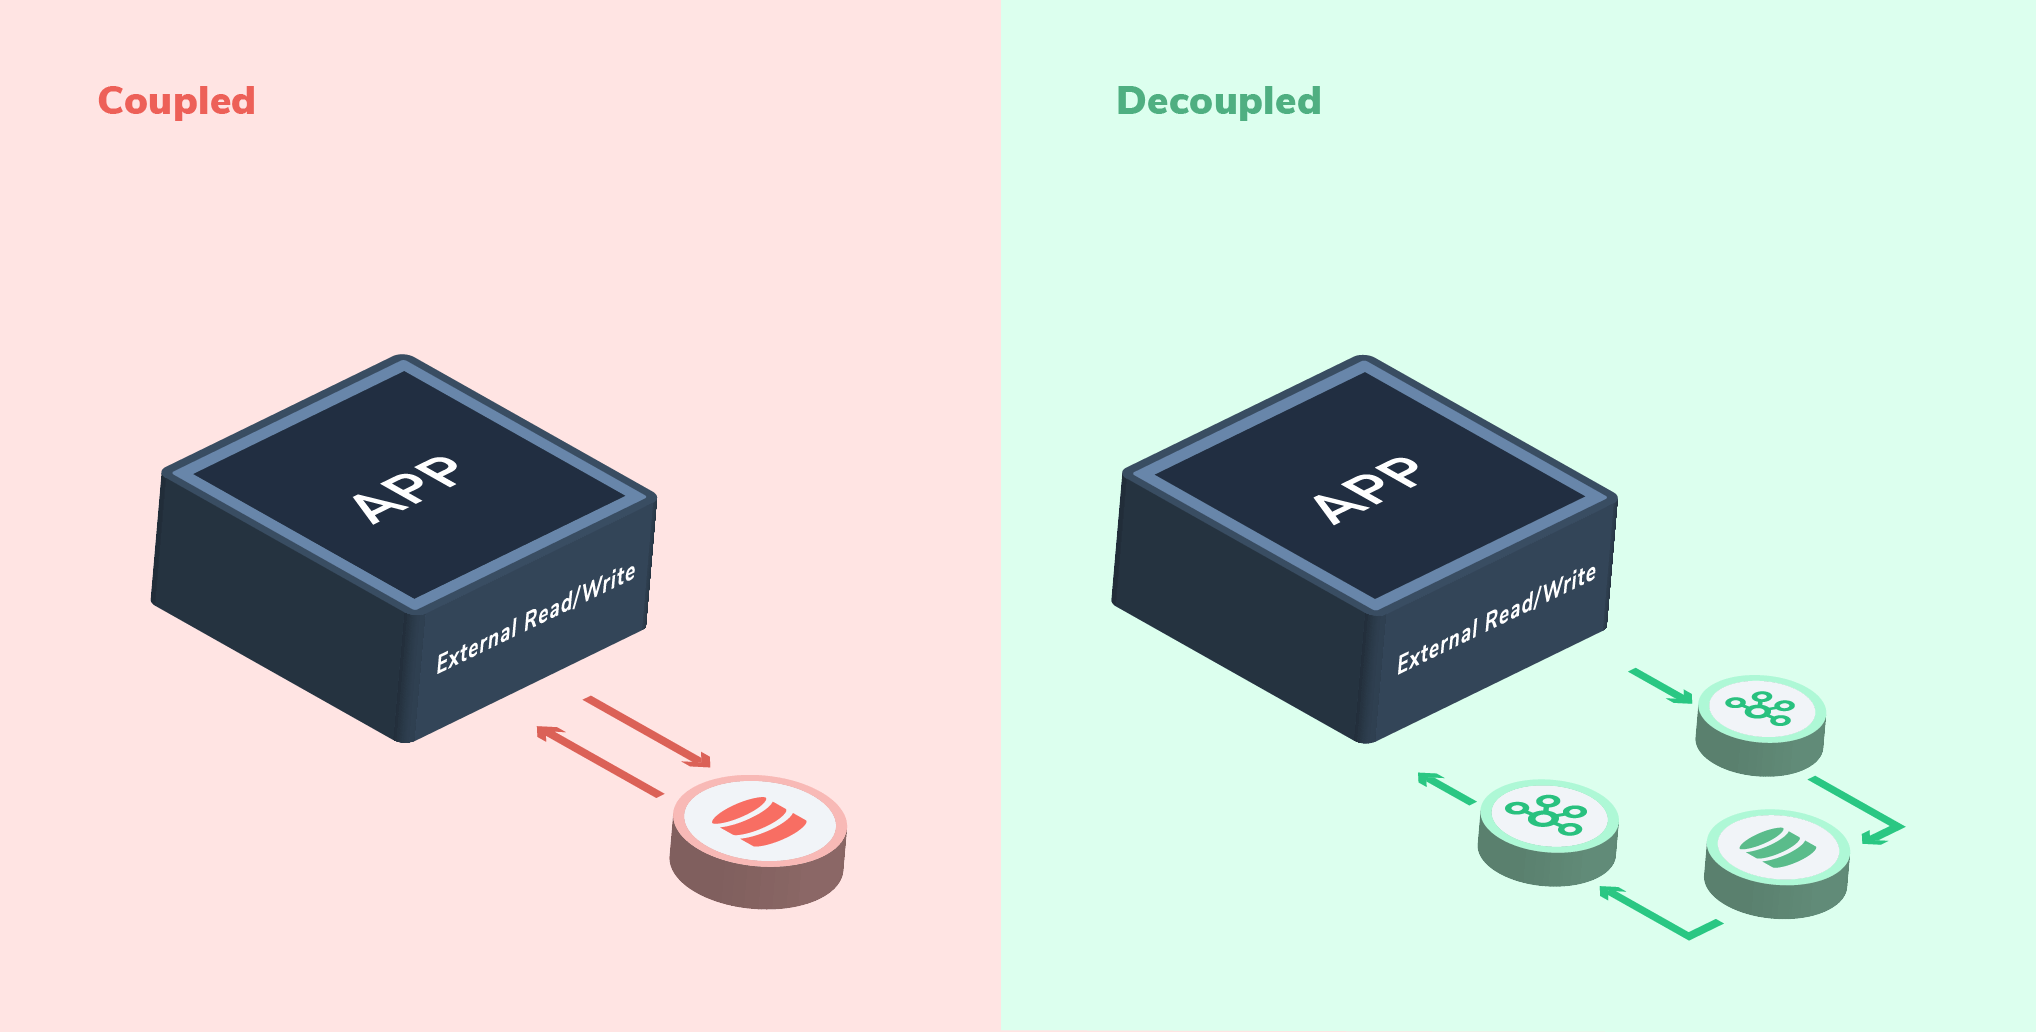
As software is evolving away from monoliths and towards service-based architectures, it is becoming more apparent than ever that monitoring logging performance needs to be a first-class consideration of our architectural designs. 

This article will explore how to build and maintain a logging solution for a microservice-oriented containerized application, how to address some common difficulties which come with running such a solution, plus some tips for debugging and eliminating bottlenecks.

Although primarily for large businesses, public sector, and non-profit organizations operating at scale, the architecture discussed here could easily be implemented in smaller-scale applications that anticipate scaling issues in the future.

Tools of the Trade

There are many options out there for containerization, log formatting, pub/sub, indexing, and visualization, all of which have their pros and cons. This article will not attempt to analyze or compare every permutation of a reliable & scalable logging architecture, as the field is fast-moving and any such benchmarking and feature listing would become dated very quickly.

Instead, for longevity and simplicity, we’re going to work with industry-standard components which are known to work reliably at scale and have the development resources required to be healthy for years to come:

  • Docker is our core containerization technology, though the fundamentals of this article will apply equally well if you’re using an alternative. With Docker, everything published by a containerized application to stdout or stderr can be easily retrieved and re-routed by our logging agent.
  • Fluentd will serve as our logging driver, it will parse and format the messages from each Docker container before publishing them to the queue. This will take the place of Logstash in the ELK stack because it’s easier to set up with Docker and generally (as of 2020) a more performant option.
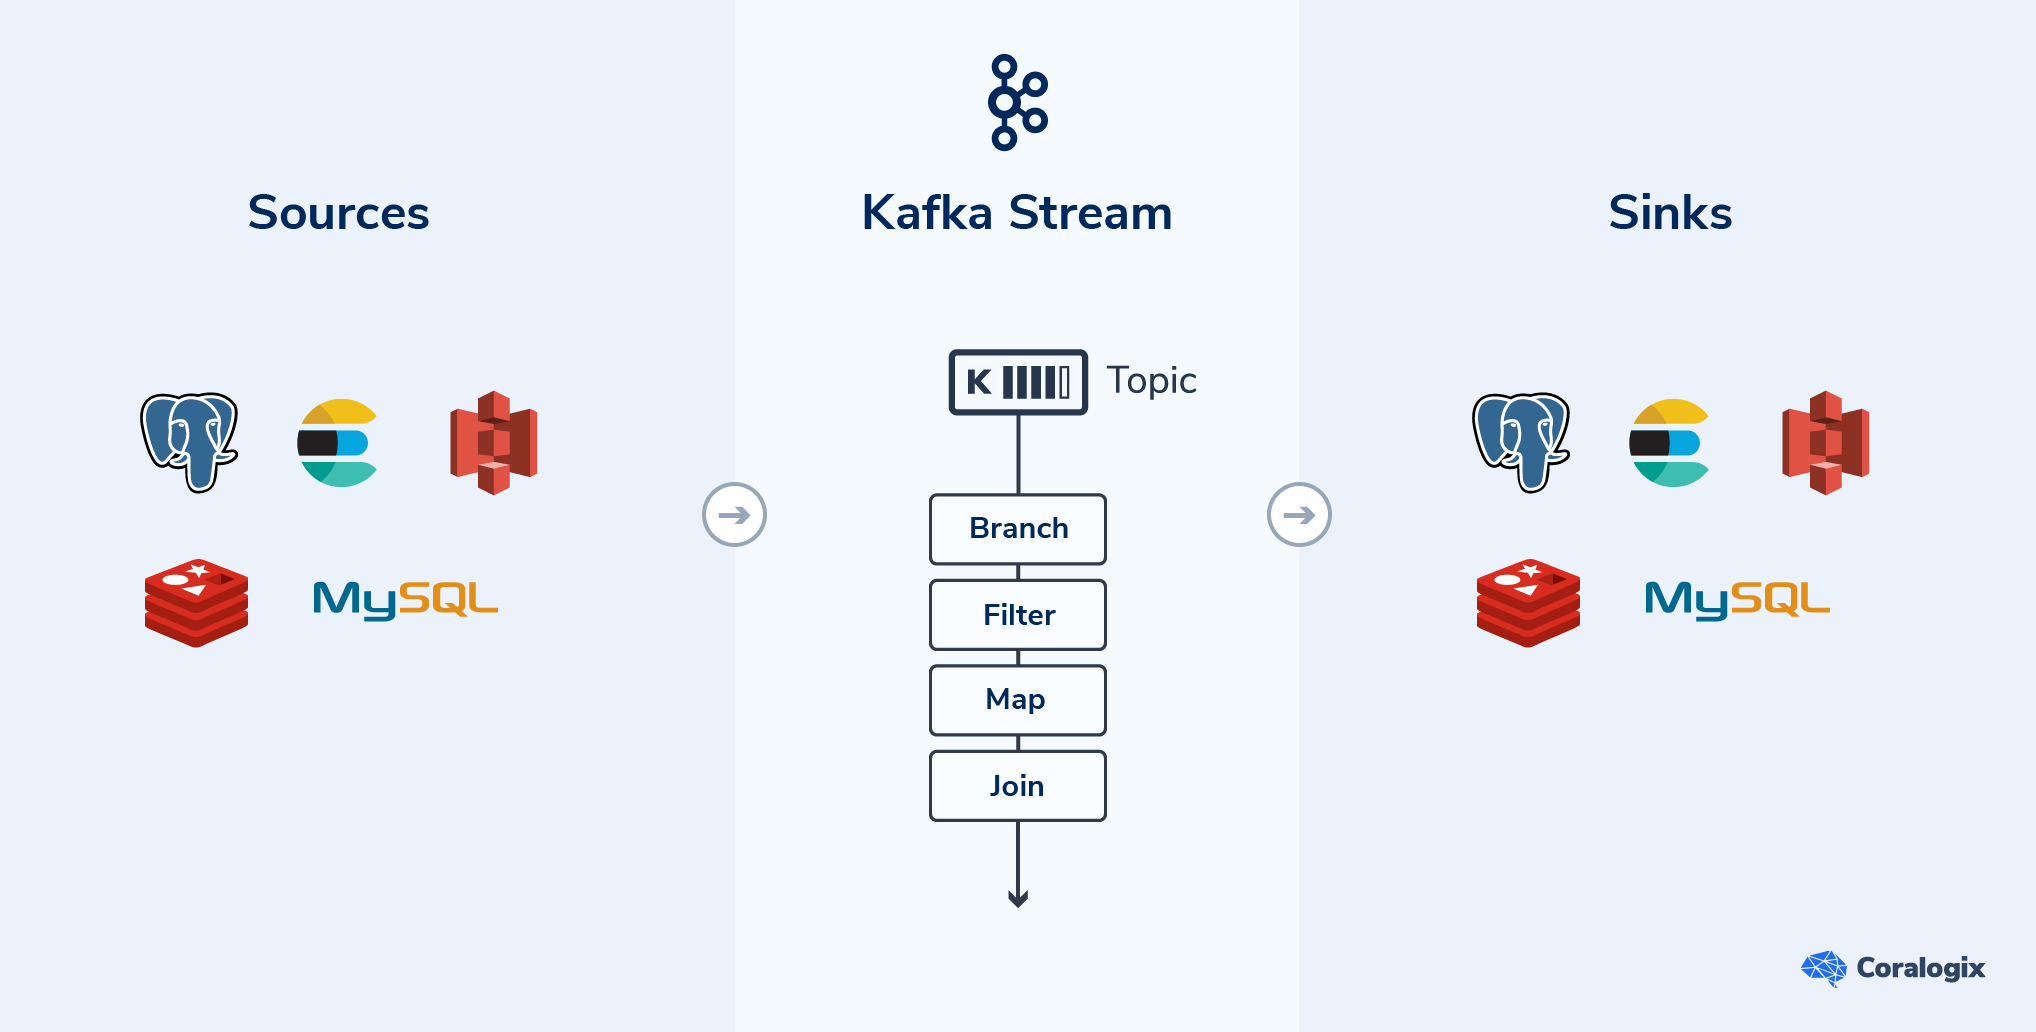
  • Kafka will handle our queues, it’s designed for logging performance with a throughput of up to 2 million writes per second on a single shard. Kafka is a very powerful piece of software, allowing for configurable shards, delivery strategies, and fault-tolerance automatic recovery, and forms the backbone of most scalable log aggregation systems.
  • Zookeeper to run Kafka and handle distributed synchronization as well as providing group services, naming, etc for our Kafka instances.
  • Kafka Connect is a Kafka component that allows Kafka to communicate with external services like key-value stores and databases. In our case, we’ll be using it to connect Kafka to ElasticSearch and publish our logs.
  • ElasticSearch will serve as our primary datastore and search engine for our logs. It’s pretty much the industry standard for indexing and searching unstructured data, which has made it a mainstay of logging solutions for the past decade.
  • Kibana will manage the visualization and exploration of our data. It also has a powerful actions plugin, Kibana Alerting, which is a great option for managing alerting policy.

This architecture is built entirely from mature and open source components, so they can be implemented long before their high availability functions are required and scaled up to meet the demands of any distributed application as it grows.

Architecture Topology

architecture topology

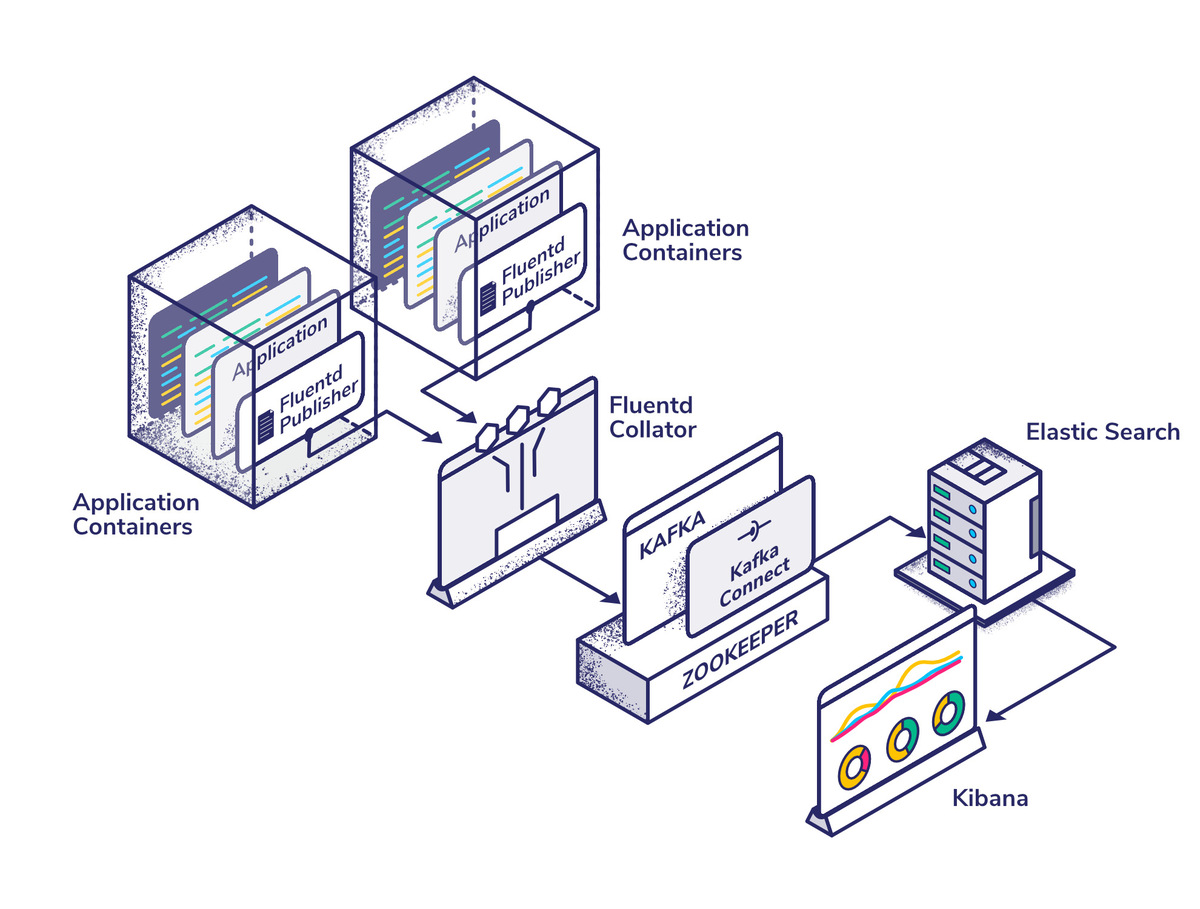
Building a Pipeline Optimized for Logging Performance

This section gives a high-level overview of configuring and connecting all of the moving parts of our architecture, optimized for logging performance. We won’t be focusing on code snippets or low-level implementation details as these are likely to differ significantly between application stacks. Instead, we will examine the implementation principles suitable for all scalable applications.

We will focus entirely on how to set up the logging pipeline, and it’ll be assumed that our application is already set up and running on Docker/Kubernetes or similar.

Configuring Fluentd

The first significant service in our stack is Fluentd, an application that collates logs from our Docker containers (called pods in Kubernetes), parses and formats them, and then publishes them to an external datastore, in our case, Kafka.

Fluentd works with output plugins which allow it to connect to various external stores. For our purposes, thankfully there is a mature Kafka connector with millions of downloads and a long history of being well-maintained.

There is also great documentation on the Fluentd website which explains how to set the application up as a Kubernetes DaemonSet, which is a way to ensure that each node in our cluster runs a copy of the Fluentd pod. The documentation uses the ElasticSearch output plugin, but it won’t be too difficult to modify it for our purposes.

Parsing & Concatenating Logs With Fluentd

Before putting logs onto Kafka, you’ll want to define the structure of the data we want to publish. This will be unique to the application, you’ll probably want to use the concatenation plugin to merge multi-line Docker logs.

From a point of view of logging performance, you can use buffering. This is built into the Kafka output plugin, which allows us to write our logs to a temporary file and publish them to Kafka every few seconds instead of writing each log line individually. This vastly reduces your connection & I/O overheads in exchange for a negligible delay in publishing your logs.

The default data structure which Fluentd puts out is perfectly serviceable, but depending on your application and the types of events we’re particularly interested in, we might want to create new fields from data found within our logs. Fluentd’s powerful configuration and wide array of data parsing and transformation plugins make this fairly trivial. However, it can take a bit of time to configure it exactly to your liking.

Setting up Kafka & Zookeeper

Apache Kafka needs no introduction. In the past decade it’s gone from being a niche internal platform at LinkedIn to one of the most popular open-source tools in the industry. Kafka has a reputation, which is not entirely undeserved, for being difficult to configure and maintain. However, with a bit of perseverance and willingness to consult the documentation, it’s difficult to beat for moving large amounts of data across a web-scale system.

Anyone who has set up Kafka has probably come across Zookeeper, but it’s often thought of as more esoteric and many people don’t understand why they need Zookeeper to manage Kafka. Zookeeper operates as the ‘brains’ of the setup; it handles orchestration and brokering of information and services across the Kafka cluster.

There are plenty of offerings when it comes to Kafka on Kubernetes. My personal preference is Yolean’s Kafka StatefulSet repo, which aims to be a “production-worthy Kafka setup for persistent (domain- and ops-) data at small scale”. As per the description, it will need some configuration tweaks to operate at scale (we’ll come back to this later), but it offers a well-tailored starting point to build on.

As of 2020, there is an example in the variants directory of the repository which covers scaling up the configuration to 6 replicas on GKE, which will provide a good starting point for our setup.

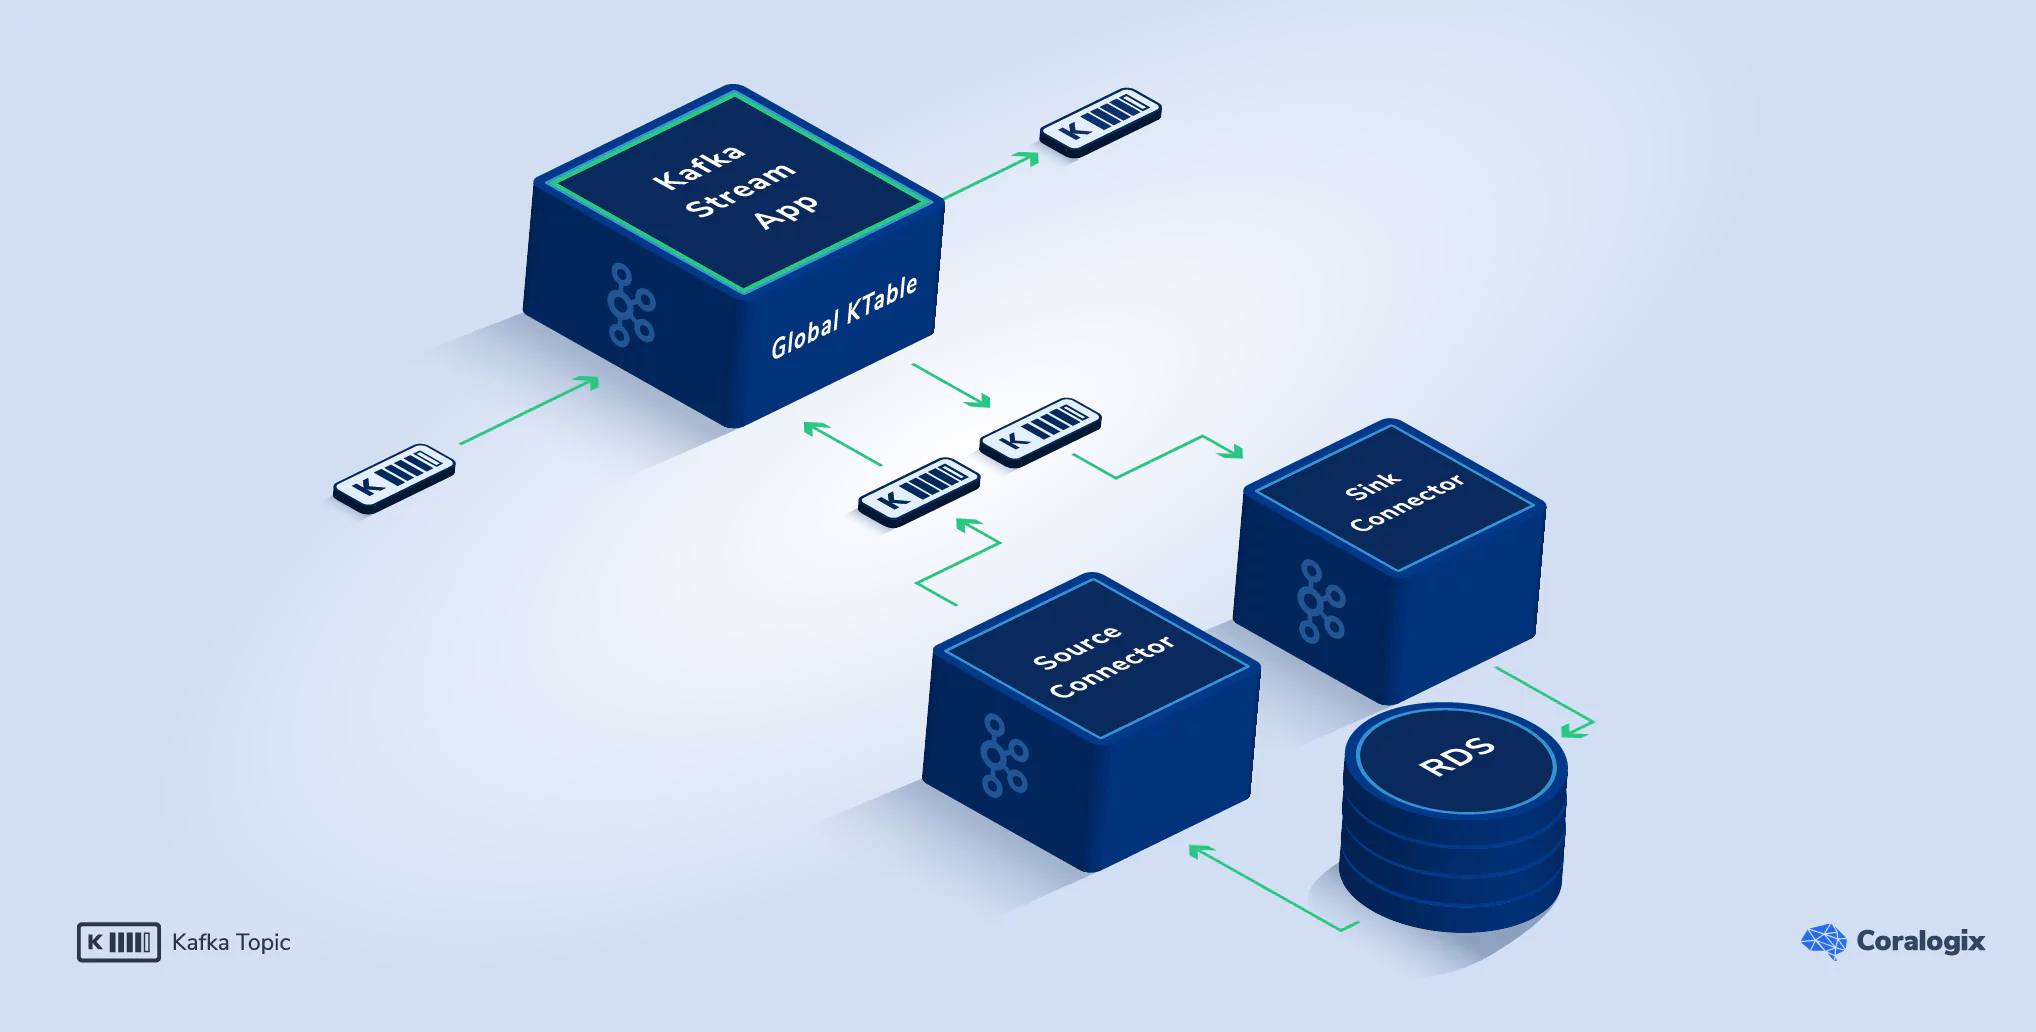
Hook things together with Kafka Connect

kafka cluster

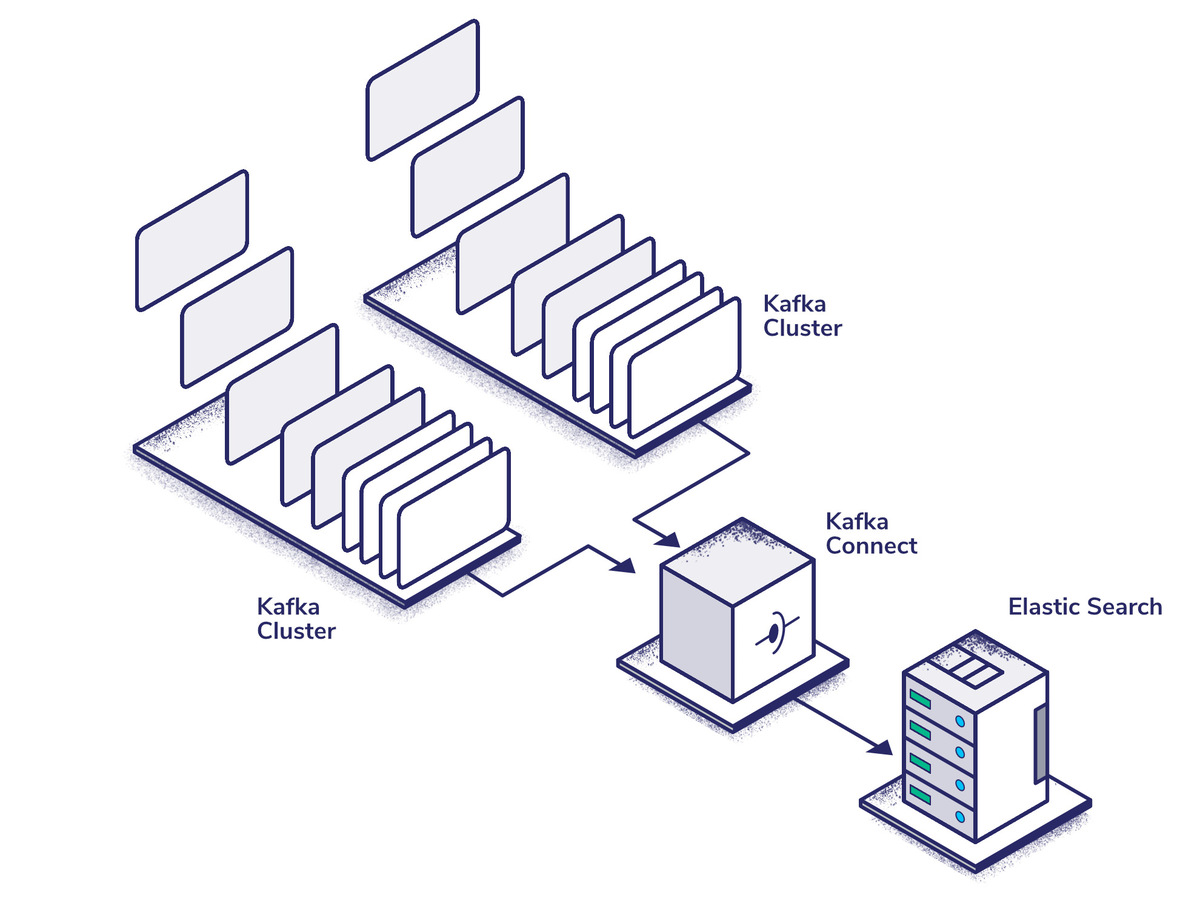
Kafka Connect is an application for managing data I/O from Kafka. Since Fluentd has its own publisher plugin, you don’t need to worry about the source side, but there is a sink which allows us to push data directly to ElasticSearch.

You could write a custom consumer to replace Kafka Connect in our stack, but in most cases with logging, Kafka Connect is more than capable and abstracts away a lot of the complexity of writing scalable, high availability applications. Kafka Connect also provides at least once delivery by default. Whilst exactly once delivery is possible, it has a significant performance overhead and is probably unnecessary for this use-case as you can de-dupe any message delivered multiple times with ElasticSearch.

Conveniently, Confluent Inc offers a pre-built Docker image for setting up a distributed Kafka Connect cluster, so all you have to do is write a Kubernetes manifest to scale it to your application’s needs.

ElasticSearch

ElasticSearch is the industry standard when it comes to self-hosted highly searchable databases. There is an official Kubernetes distribution for the application, which we’ll be using for our logging stack.

Once you have ElasticSearch set up, assuming everything is configured correctly, you should be able to watch your logs move through the pipeline. You’ll need to make sure you have enough storage space and resources allocated to your components, especially Kafka and ElasticSearch which can both use significant IO and computational resources.

Kubernetes & High Availability

Because we’re using Kubernetes, high availability is a well-documented concern. You will need to set up a load balancer that can balance traffic between multiple control planes, each of which will be located in different regions. Some cloud providers manage this behavior automatically on their managed Kubernetes offerings, but the official documentation explains detailed options for setting it up on a self-hosted cluster.

Configuring Kafka For Logging Performance

Now that you have the skeleton of your stack set up and working, you should do a bit of fine-tuning to ensure that our logging performance is up to the task of handling our application. This section will focus on configuring scalable and resilient applications rather than horizontal scaling, as the latter is largely managed by Kubernetes.

This is by no means an exhaustive list of performance tweaks, because that could be a series of articles by itself, but it aims to highlight the quick performance wins we can achieve when operating Kafka at scale.

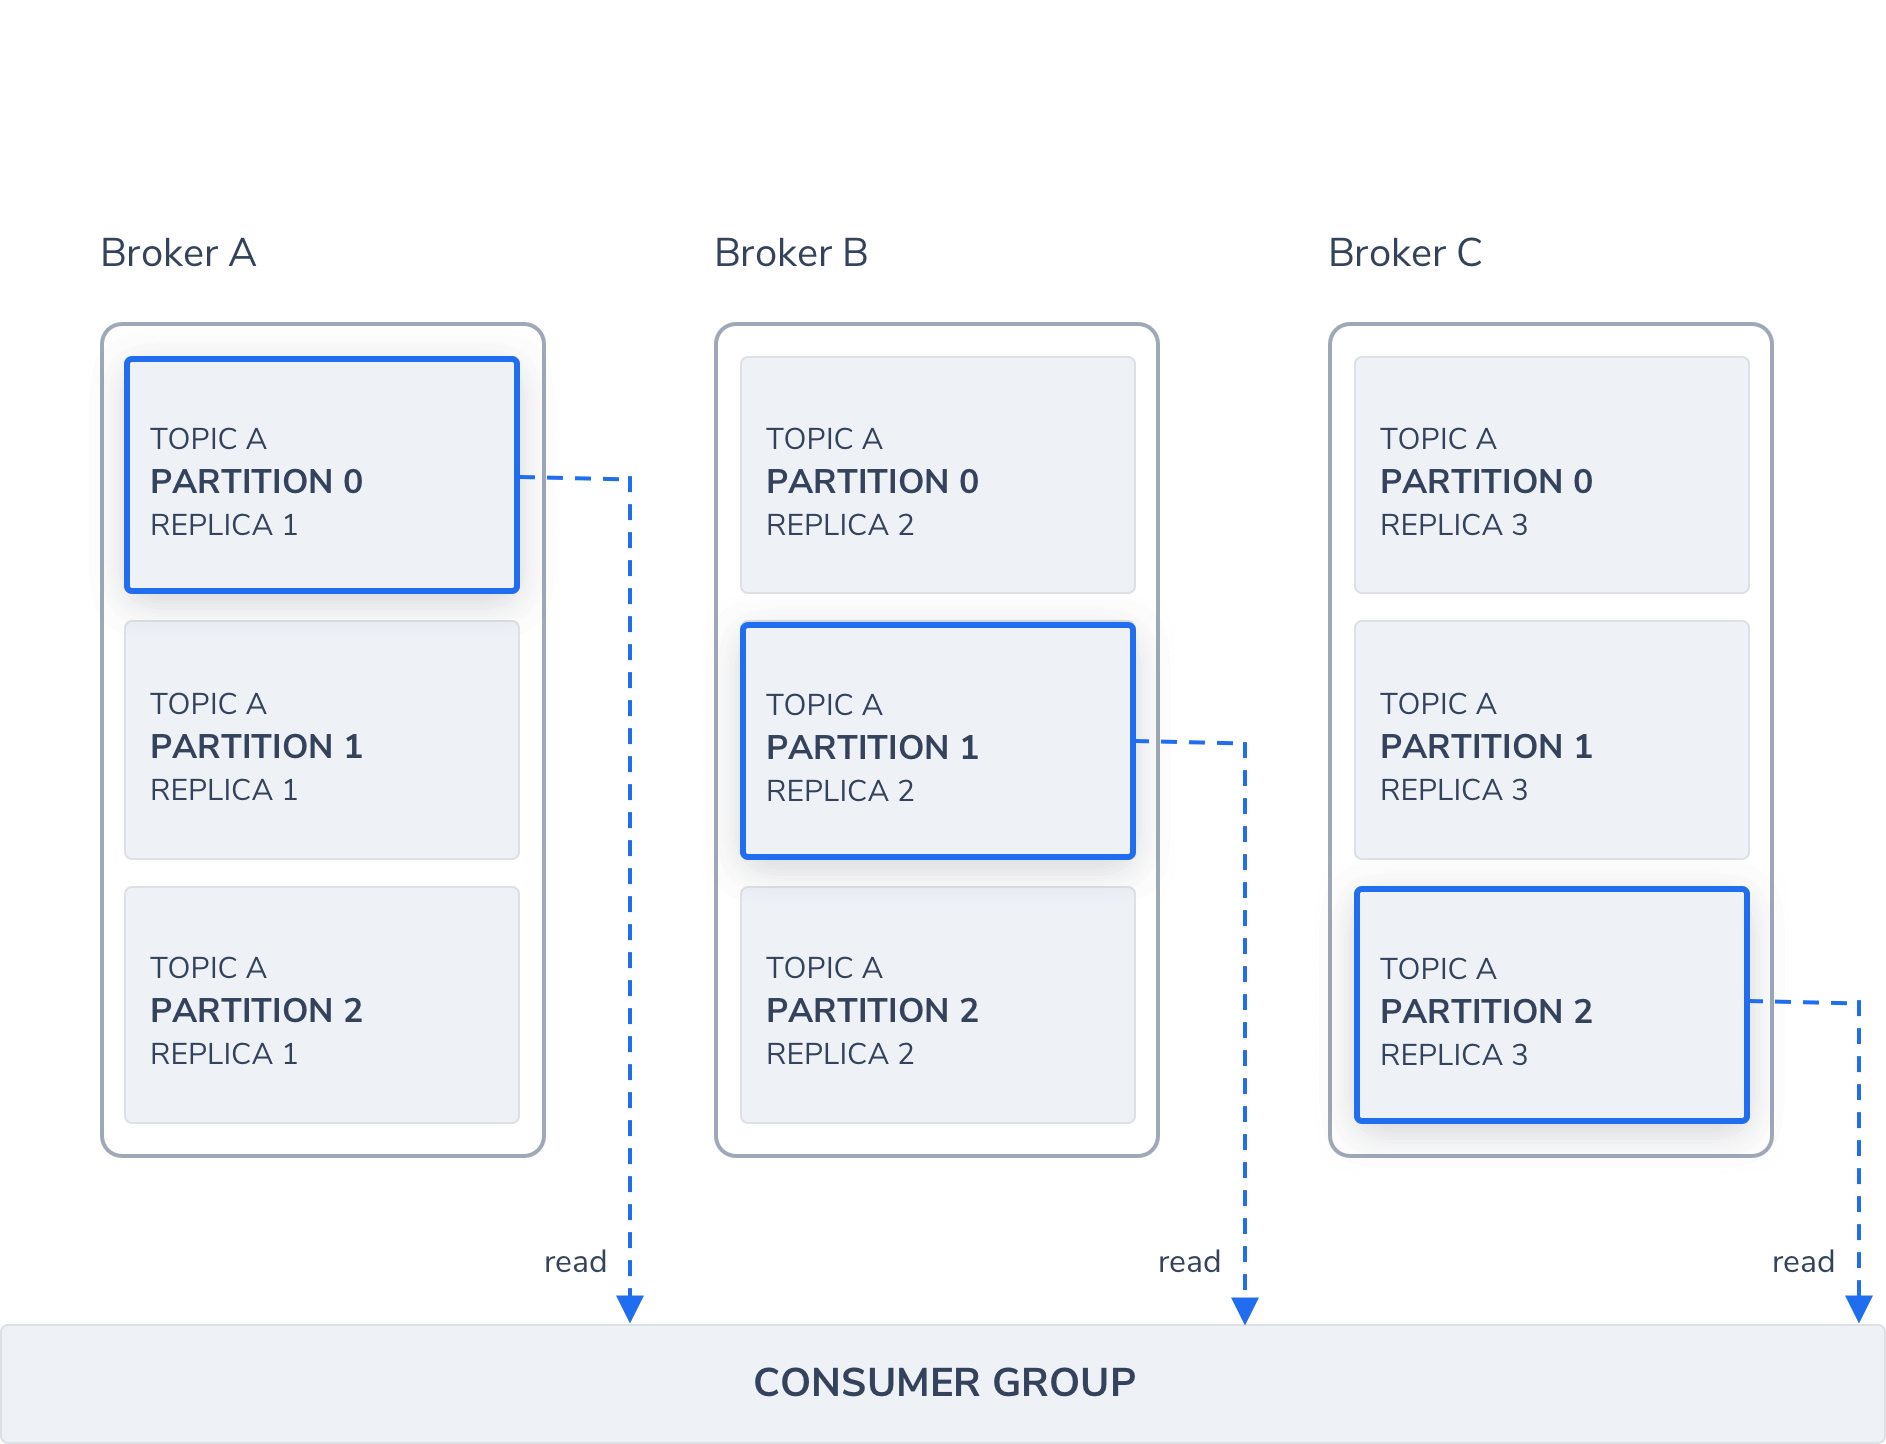
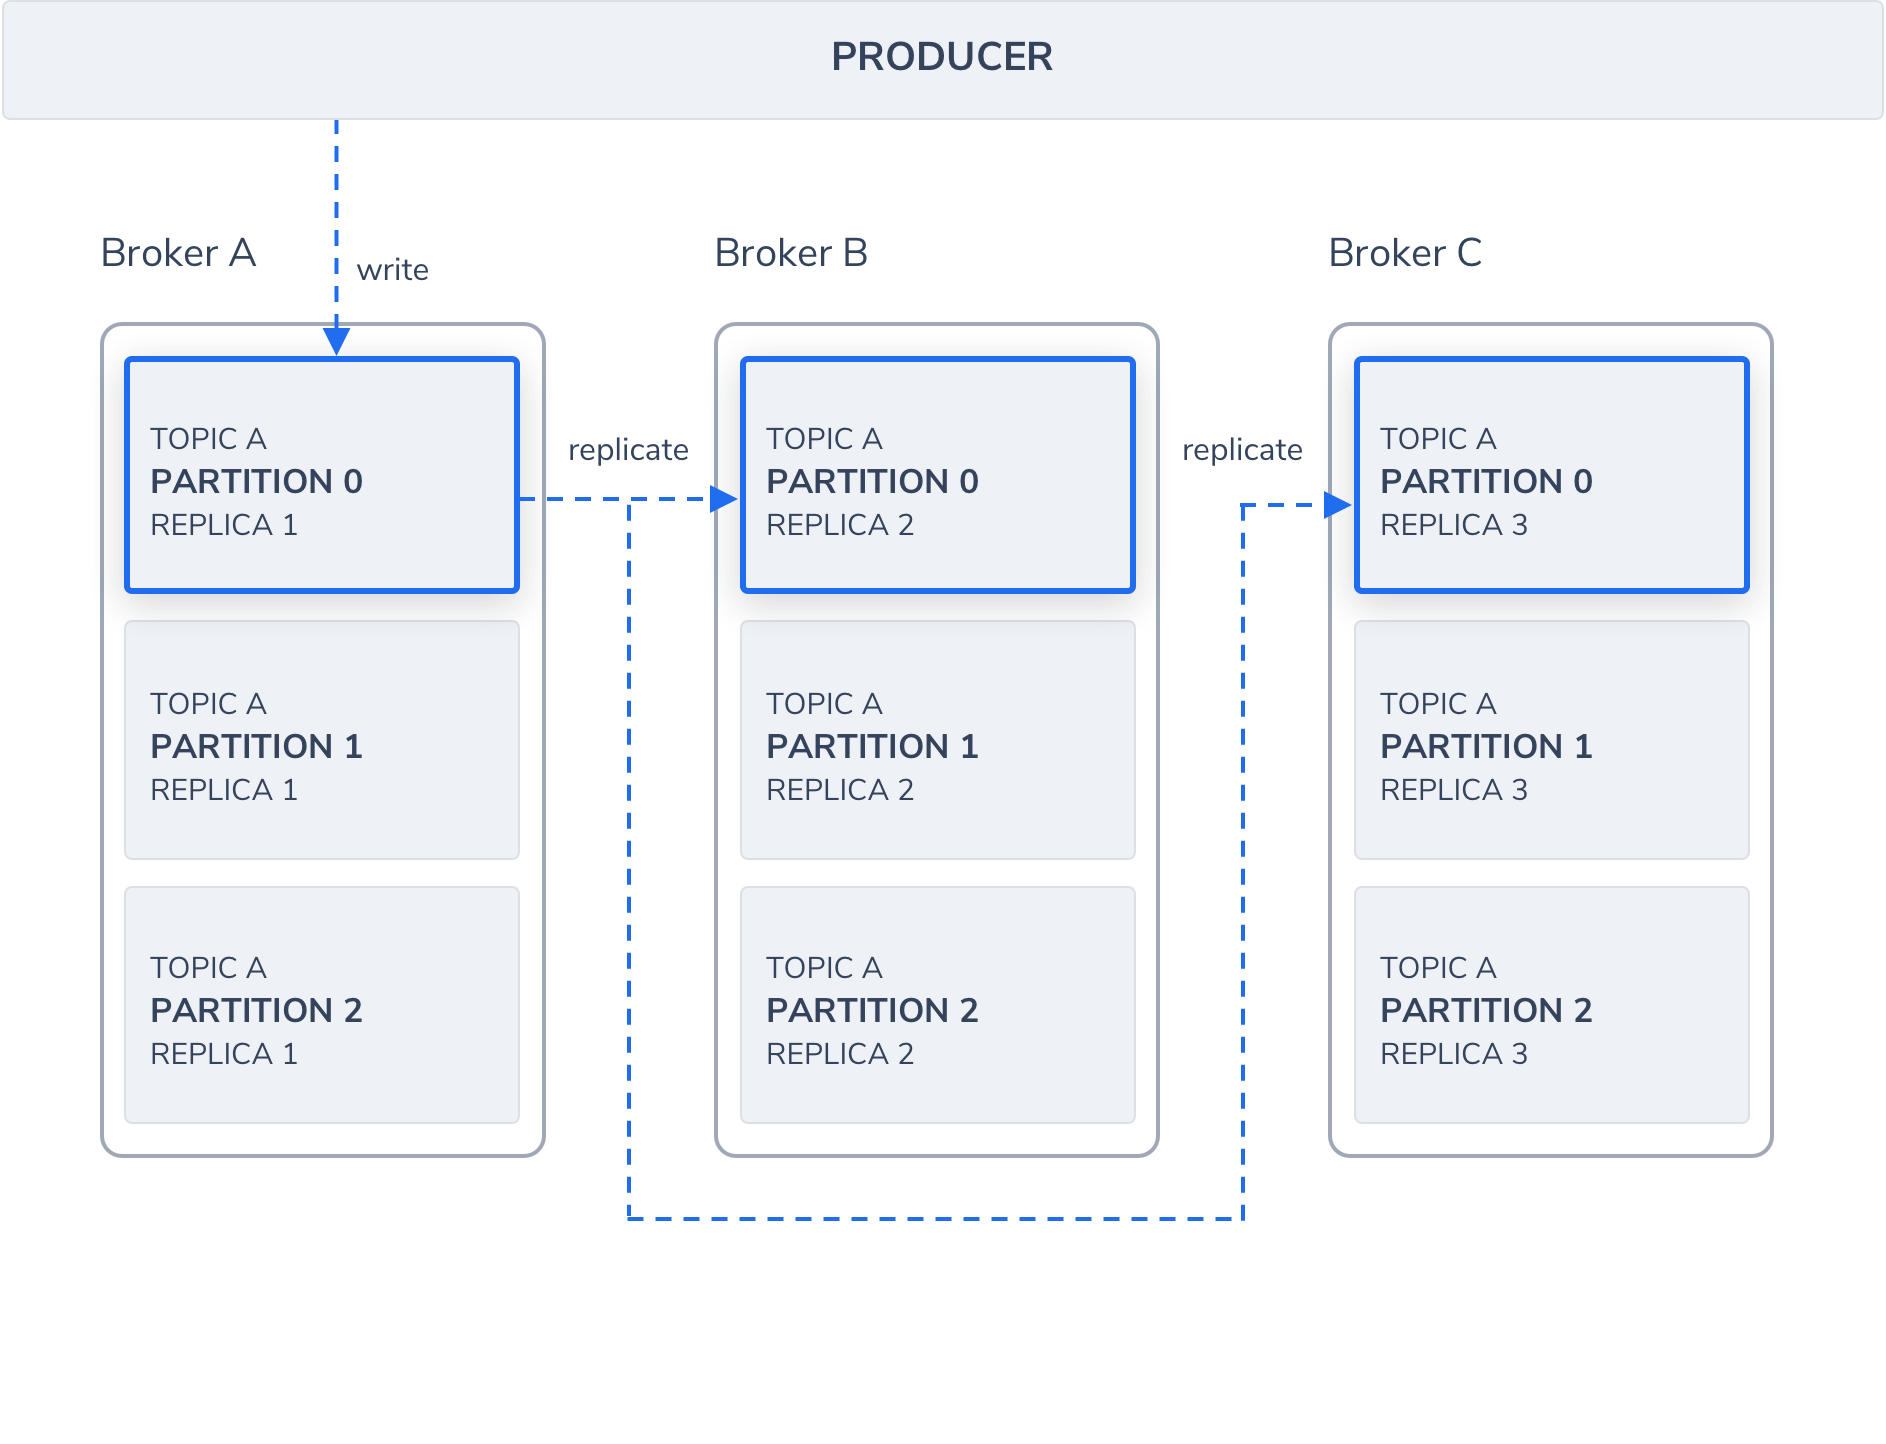
Topics, Partitions & Brokers

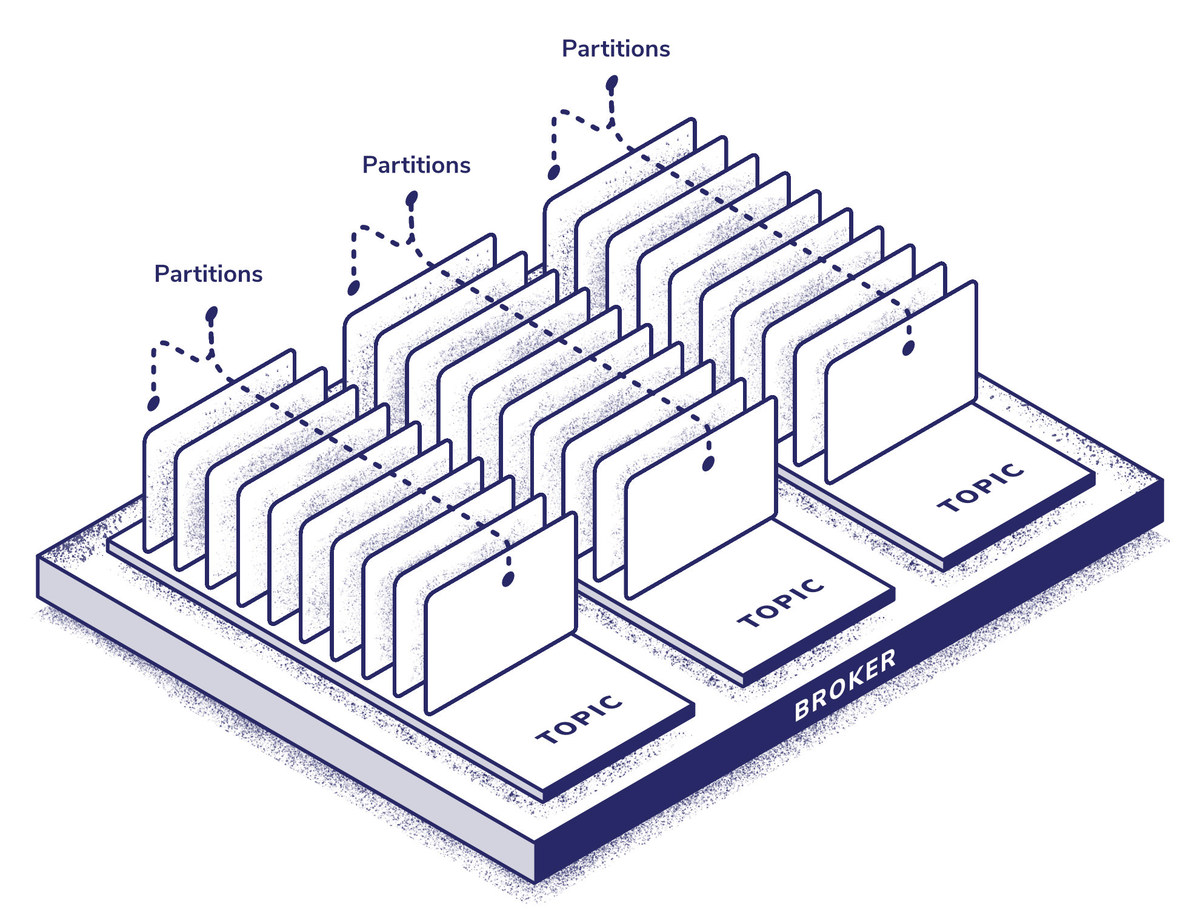
Kafka’s topics are the service’s system for sorting messages, though in this logging setup we’ll be using a single topic with multiple partitions. A good rule of thumb for determining how many partitions to start with is to work out the throughput per producer (P), the throughput per consumer (C), and the total throughput (T). Then we can take (max(T/P, T/C)) as a starting point. Increasing the partitions on the fly can be done, but it can have a fairly significant performance impact whilst load balancing occurs, so it’s always better to overprovision than to underprovision partitions.

This resource on the Confluent blog goes into more depth on the subject, but nothing will be better for determining the number of partitions you need to run than trial and error, because it’s so different for every application. It’s recommended that you don’t use more than 4,000 partitions per broker.

System-Level Tuning

Many system-level options can affect Kafka’s performance, and this could easily be an article on its own. Some of the most important things to look at are:

  1. The maximum process file limit-setting and ulimit often need to be increased when running a large number of partitions on a single broker;
  2. Swap memory and disk IO can be significant performance hits on a Kafka cluster, and there are a lot of Linux kernel tweaks which affect how these are handled (vm.swappiness – yes, it’s actually called that – is the most significant);
  3. Similarly, there are a lot of Linux kernel parameters which can be tweaked to support greater network throughput and greater network buffering, most of these live in the net.core and net.ipv4/6 namespaces;
  4. Choosing the right filesystem, ideally one which doesn’t update atime (access time) every time a file is touched, can also significantly improve disk throughput.

You should also avoid having Kafka share disks with any other application, as this will significantly slow down disk operations for what can be a very disk-hungry service.

Kafka & Zookeeper Tweaks

Most of the default settings in Zookeeper are surprisingly suitable for scaling, but for some use cases it’s worth looking at timeout, max connections, and buffer settings.

Message Compression

The Fluentd Kafka producer doesn’t compress messages by default. For most use cases, it makes sense to enable gzip compression as it significantly reduces disk I/O and network traffic in exchange for a small CPU overhead.

Addressing Performance Bottlenecks

One positive aspect of using these tried-and-tested industry-standard applications is that they’re all probably running on applications with greater logging needs than yours, which means that any of the issues you’re going to run into, someone else has probably already solved. Unfortunately, finding those solutions can prove challenging because they’re not common problems – scalable logging in general isn’t a common domain.

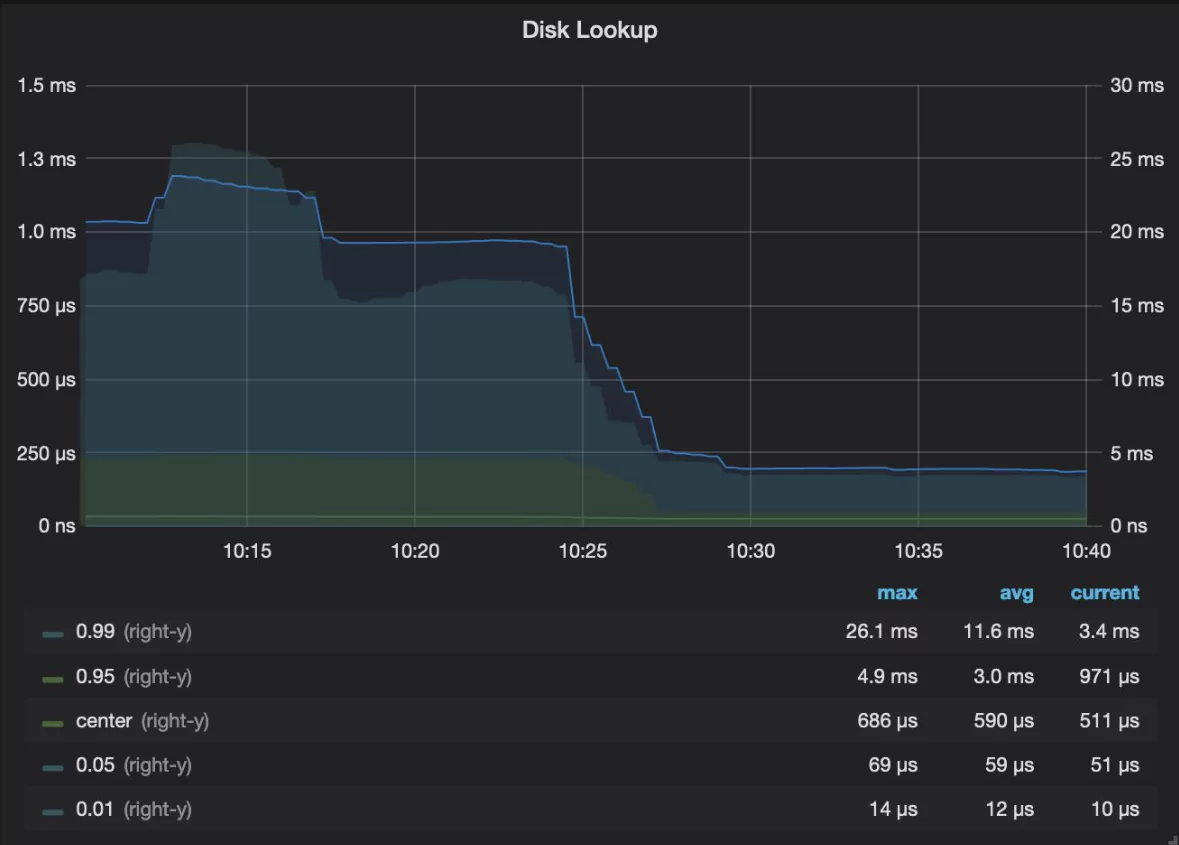
The first step to fixing a problem is finding out where it is. Kubernetes has quite a few tools for troubleshooting, but I prefer to use Prometheus, which can be easily configured to directly monitor each node’s disk I/O, CPU usage, memory usage, and network usage. This usually makes finding the source of speed troubles fairly simple.

Often, you can improve logging performance by simply scaling whichever service is experiencing bottlenecks, either horizontally by requiring more pods or vertically by allocating more resources to our cluster nodes. 

With Kafka, often the issues are disk I/O based, and they can be eased by allocating faster disks (SSDs instead of hard drives), more disks (organized in a write-optimized configuration like RAID-1 or RAID-10), or tweaking the pagecache configuration for the service.

A Managed Alternative

Building pipelines optimized for performance and stability can be a rewarding and educational experience, but it can also be expensive, time-intensive, and difficult, despite the leaps and bounds of qualify of life that have come along with open source tooling and containerization. 

Coralogix is an observability platform optimized for scalability and stability, which maintains power-user friendliness via a wide array of integrations and customization options without sacrificing ease of use.

Coralogix services are priced based on GB of logs ingressed, which means that they can grow organically with your business, and they offer easy integrations with almost every dashboard and data source conceivable (and a powerful API for custom integrations). For Kubernetes ingress, they offer documentation and real-world examples for configuration, which is no more than a few lines of config for even the largest clusters.

Whether or not Coralogix makes sense for your organization is likely to depend on your in-house ops resources, level of expertise with Apache Kafka, and ability to quickly troubleshoot and rectify the issues that come with scalable data streams. If you’re not sure whether our managed platform is suitable for your use case, check out our 14-day free trial.

Avoiding death by external side effects — a tale of Kafka Streams

At Coralogix, we strive to ensure that our customers get a stable, real-time service at scale. As part of this commitment, we are constantly improving our data ingestion pipeline resiliency and performance.

Coralogix ingests messages at extremely high rates — up to tens of billions of messages per day. Every one of these records needs to go through our entire pipeline at near real-time rates: validation, parsing, classification, and ingestion to Elasticsearch.

In the past, we had services in our ingestion pipeline consuming messages from Kafka, performing their workload, and producing the messages to the next topic in the pipeline. The workload consisted of a mixture of external I/O and in-memory processing. The external I/O was necessary for writing and pulling data from various sources (relational database, Redis, Couchbase, etc.). As our scale grew, we saw that our processing rate was not scaling linearly and was highly sensitive to infrastructure glitches.

As we see it, a scalable service is bounded by the machine’s CPU. When traffic increases, the CPU usage should increase linearly. In our case, we were forced to scale out our services despite the CPU not being a bottleneck. At some point, one of our services had to run on 240 containers (!). We then decided that we’re due for a redesign.

The naive approach

We started with the most straightforward design possible: a cache that will be populated on-demand with a configurable expiration time. For each message, the mechanism checked that the required data was cached and retrieved it when necessary. It did improve read performance, but some issues persisted.

Problems with the naive approach:

  • X minutes delay from the source of truth by design
  • Hard hit after a restart until the cache warms up
  • Bad p99 and p95 performance, which affected the average processing time
  • Whenever the external source malfunctioned, the service was crippled
  • External I/O was still mixed with the in-memory processing.

Not what we wanted

We decided to do a full redesign and reach a point where our services where bounded entirely by CPU, without any time wasted on external I/O. After considering a few platforms, we decided that Kafka Streams was the right solution for us.

The decoupled approach — Kafka Streams & Kafka Connect

The idea behind Kafka Streams and Kafka Connect is having all your data available in Kafka.
We can split the design into three types of components — the 3 S’s:

Source
Stream
Sink

Source: a source is anything that ingests data from external sources into a Kafka topic. For example, a REST server, a database, etc. In addition to custom sources implemented by our services, Kafka Connect provides many plugins that implement different sources (Relational databases, Elasticsearch, Couchbase, and more).

Stream: The stream is where it all comes together, and your business logic is executed. The stream consumes the data from the source topics and creates a GlobalKTable or KTable from them. The main data flow then uses these tables to enrich incoming records as part of the workload.

Sink: Consumes data from a topic and ingests it to an external data source. Kafka Connect has sink connectors, however, we prefer using Akka stream to write our own sinks (maximum flexibility).

Kafka Stream Overview

Advantages: Light, easy to get started, overall easy to maintain, provides a push-updated cache, relies only on Kafka.
From our experience, the main advantage of the Kafka Streams platform is the fact that it is opinionated and makes it harder to execute external side effects as part of the stream.

Disadvantages: Complex stateful transformations like sliding windows and even group by are not handled well from our experience, particularly with hot partitions (i.e., key skew). This can be addressed by spreading the keys which will require two sliding windows — not fun.


How we use it (simplified example)

Kafka streaming solution
Simple illustration on how to remove RDS side effect (read & write)

We started by ingesting all of our data sources to Kafka topics using Kafka Connect plugins, which produce the data to multiple Kafka topics.

The main data stream is received by a RESTful HTTP API which validates the incoming data and produces it to a Kafka topic.
The Kafka Streams-based service consumes all the source topics and creates GlobalKTable stores based on RocksDB. Whenever the external source changes, the connector produces a message to the topic. The service consumes the message and updates the store. During the streaming process, the incoming data is enriched with the data from the GlobalKTable to execute the workload.

Look at that! We got a ‘push-updated’ cache with no delays and no external side effects. Thank you, Kafka Streams 🙂

What if we need to update an external datastore? If during the workload processing, the service needs to update a store, it will produce a message to a Kafka topic. We create different decoupled microservice sinks that will consume the data and ingest it into the stores after the workload processing is completed.

In real-world examples, like our full solution, you can easily have many sources and sink topics in use by a single Kafka Streams application.


What did we accomplish

  • Removed external I/O due to querying data from external sources
  • Removed external I/O due to writing data to external sources
  • Our services are now CPU bound, with Kafka as their only I/O action
  • Increased resiliency against external source glitches. Whenever an external source is experiencing degraded performance, the stream will continue to work with the latest data it received
  • Reduced the required resources for our services by 80%!

Looking good, but can we do even better?
This was already a meteoric step forward. However, one thing still bugged us. The disk lookup latency for retrieving and deserializing items from RocksDB was taking 33% of the total time to handle a message. We started with optimizing RocksDB:

  • Enabled compression
  • Increased the block cache
  • Changed serialization formats from JSON to Protobuf

All of these changes yielded some improvements, but we were still not satisfied. It was only then that we added another layer of in-memory LRU cache for deserialized objects. We were finally happy with the new performance, as can be seen in these latency charts:

Kafka results
Drop in disk lookup latency

Conclusion

By decoupling our external sources from our stream app and bring the required data close to our app, we were able to increase the stability and performance of our main pipeline. Kafka Stream & Kafka Connect made a lot of the heavy lifting and helps us stay in the right track going forward.

Next heights to conquer

  • Optimize the JVM for Kafka Streams applications. Heap allocation is the black plague of JVM, and we are always striving to reduce it.
  • Benchmark GraalVM and Java 11 ZGC with our use cases. Stay tuned for the benchmarks 🙂

It is an exciting time to join Coralogix’s engineering team. If this sounds interesting to you, please take a look at our job page – Work at Coralogix. If you’re particularly passionate about stream architecture, you may want to take a look at these two openings first: FullStack Engineer and Backend Engineer.

Thanks for reading. Drop us a message if you have questions or want to discuss more how we use Kafka Streams.
Special thanks to Zohar Aharon & Itamar Ravid for being the pioneers of the new design!

For an introduction on Kafka, see this tutorial.

Introduction to Kafka Tutorial

Kafka is an open source real-time streaming messaging system and protocol built around the publish-subscribe system. In this system, producers publish data to feeds for which consumers are subscribed to.

With Kafka, clients within a system can exchange information with higher performance and lower risk of serious failure. Instead of establishing direct connections between subsystems, clients communicate via a server which brokers the information between producers and consumers. Additionally, the data is partitioned and distributed across multiple servers. Kafka replicates these partitions in a distributed system as well.  

Altogether, this design enables moving large amounts of data between system components with low-latency and fault-tolerance.

Kafka achieves high-throughput, low-latency, durability, and near-limitless scalability by maintaining a distributed system based on commit logs, delegating key responsibility to clients, optimizing for batches and allowing for multiple concurrent consumers per message.

Example use cases:

  • IoT and sensor networks
  • Large scale message processing
  • Stream processing
  • Processing business and user event streams in real time
  • Aggregating metrics and logs from distributed servers and applications
  • Manage and distribute content to multiple applications in real-time
  • Broker data to analytics clusters, real-time web analytics, and real-time predictive analytics.

BROKERS

Kafka is maintained as clusters where each node within a cluster is called a Broker. Multiple brokers allow us to evenly distribute data across multiple servers and partitions. This load should be monitored continuously and brokers and topics should be reassigned when necessary.

Each Kafka cluster will designate one of the brokers as the Controller which is responsible for managing and maintaining the overall health of a cluster, in addition to the basic broker responsibilities. Controllers are responsible for creating/deleting topics and partitions, taking action to rebalance partitions, assign partition leaders, and handle situations when nodes fail or get added. Controllers subscribe to receive notifications from ZooKeeper which track the state of all nodes, partitions, and replicas.

TOPICS

As a publish-subscribe messaging system, Kafka uses uniquely named Topics to deliver feeds of messages from producers to consumers. Consumers can subscribe to a topic to get notified when new messages are added. Topics parallelize data for greater read/write performance by partitioning and distributing the data across multiple brokers. Topics retain messages for a configurable amount of time or until a storage size is exceeded.

Topics can either be preconfigured ahead of time or automatically generated by Kafka when a message doesn’t specify a specific topic. This is the default behavior, but you have the option to change it to prevent automatic topic creations.

RECORDS

Records are messages that contain a key/value pair along with metadata such as a timestamp and message key. Messages are stored inside topics within a log structured format, where the data gets written sequentially.

A message can have a maximum size of 1MB by default, and while this is configurable, Kafka was not designed to process large size records. It is recommended to split large payloads into smaller messages, using identical key values so they all get saved in the same partition as well as assigning part numbers to each split message in order to reconstruct it on the consumer side.

PRODUCERS

Kafka producers transmit messages to topics and may either allow Kafka to evenly distribute the data to different partitions or choose a specific partition based on a message assignment key’s hash value or the message can specify a partition when transmitted. Producer clients can assign keys to maintain a specific order of messages or to specify a partition semantically based on the data contained in the message. Otherwise, without a key, Kafka defaults to a round-robin approach to distributing the messages evenly across partitions for optimal balance.

Produces are in charge of configuring the consistency/durability levels (ack=0, ack=all, ack=1). This includes setting the number of replicas required to have saved the message before acknowledging it to the partition leader.

Generally speaking, a single producer per topic is more network efficient than multiple producers. As it becomes necessary to increase data throughput, we first want to increase the number of threads per producer if possible, before increasing the number of producers.

When setting up producers, you have the option to configure whether producers wait for acknowledgment from all in-sync replicas (ISRs), just the partition leader, or not at all. The different levels of acknowledgment allow you to strike a balance between data consistency and throughput.

CONSUMERS

Consumers are applications that subscribe to a topic in order to consume their messages. After a producer sends data to Kafka, it forwards the data to all subscribed consumers. Consumers send an acknowledgment to Kafka upon ingesting the message.

Kafka maintains load balance between Consumers and Partitions by evenly distributing the load between Consumers.

When setting up Consumers, you need to choose when the consumer commits the offset of the message. You several options, each with their own pros and cons.

  • Messages are read at least one time: This ensures no data loss in case of consumer failure but carries the potential for duplicated data.
  • Messages are read at the most one time: This approach is riskier since a message may be lost in between processing and committing the offset.
  • Messages are read exactly once: This ensures all messages are read and avoids any duplication, however, it also reduces data throughput.

CONSUMER GROUPS

Consumers are typically grouped by their shared function in a system into Consumer Groups. While Kafka allows only one consumer per topic partition, there may be multiple consumer groups reading from the same partition. Multiple consumers may subscribe to a Topic under a common Consumer Group ID, although in this case, Kafka switches from sub/pub mode to a queue messaging approach.

Kafka stores the current offset per Consumer Group / Topic / Partition, as it would for a single Consumer. This means that unique messages are only sent to a single consumer in a consumer group, and the load is balanced across consumers as equally as possible.

When the number of consumers exceeds the number of Partitions in a Topic, all new consumers wait in idle mode until an existing consumer unsubscribes from that partition. As new consumers join a Consumer Group and there are more consumers than partitions, Kafka initiates a rebalancing. Any unused consumers are used by Kafka as failovers.

PARTITIONS  

The Kafka distributed system partitions and replicates Topics across multiple servers to scale and achieve fault tolerance. Partitions allow us to split the data of a topic across multiple broker servers for writes by multiple producers and reads by multiple consumers. Partitions are either automatically or manually assigned to a broker server within a broker cluster.

Kafka-Top-Consumer-Read

Kafka topics are divided into several partitions, which contain messages in an immutable sequence. A unique sequence ID called an offset gets assigned to every message that enters a partition. These numerical offsets are used to identify every message’s sequential position within a Topic’s partition, as they arrive. Offset sequences are unique only to each partition. This means that locating a specific message requires that you know the Topic, Partition, and Offset number.

Partitions may also be used to split up a large size topic across multiple servers. Being that a partition cannot be split onto multiple servers, in order to scale a Topic beyond a server’s storage capacity, Kafka can use partitions to split the topic data across multiple servers.

Since a single partition may be consumed by only one consumer, the parallelism of your service is limited by the number of partitions contained in a topic.

REPLICAS

For stronger durability and higher availability in case of failures, Kafka can replicate partitions and distribute them across multiple broker servers.

Kafka-Topic-Producer-writes

Kafka always designates one Leader partition which is in charge of handling all reads and writes, while Follower replicas only replicate the Leader’s data and take on the Leader role should the designated Leader experience a failure. Followers are designated as in-sync replicas (ISR) when they’re in sync with the Leader, and only ISRs are eligible to become Leaders. You can choose the minimum amount of ISRs required before the data becomes available for consumers to read. Kafka designates the High Watermark (HW) as the last offset in a partition that has been replicated.

The configurability of replicas allow us to configure Kafka for particular types of applications such as one needing high durability compared to another app requiring a lower write response latency.

In Synchronous Replication mode, messages are only available to consumers after all replicas in a partition have confirmed the data was saved via their commit logs. In contrast, the Asynchronous Replication option will make the message available as soon as it’s saved to the partition leader. The downside with the asynchronous approach is the risk of a broker failing and the commit message being lost.

While a leader replica is being replaced (i.e. due to a failure), Kafka may return LeaderNotAvailable errors. In this case, producers and consumers should pause activity until the next leader becomes available in order to avoid data loss.

CONNECT

Kafka Connect is a framework for importing data into Kafka from external data sources or exporting data to external sources like databases and applications. Connectors allow you to move large amounts of data in and out of Kafka to many common external data sources, and also provides a framework for creating your own custom connectors.

Kafka connect comes with the standard Kafka download, although it requires separate setup on a different cluster.

STREAMS

Kafka streams read data from a topic, running some form of analysis or data transformation, and finally writing the data back to another topic or shipping it to an external source. Although Kafka enables this activity with regular Producers, with Streams we can achieve real-time stream processing rather than batch processing. For the majority of cases, it’s recommended to use Kafka Streams Domain Specific Language (DSL) to perform data transformations. Stream processors are independent of Kafka Producers, Consumers, and Connectors.

Kafka offers a streaming SQL engine called KSQL for working with Kafka Streams in a SQL-like manner without having to write code like Java. KSQL allows you to transform data within Kafka streams such as preparing the data for processing, running analytics and monitoring, and detecting anomalies in real-time.

ZOOKEEPER

ZooKeeper maintains metadata for all brokers, topics, partitions, and replicas. Since the metadata changes frequently, sustaining ZooKeeper’s performance and connection to brokers is critical to the overall Kafka ecosystem.

Since Kafka Brokers are stateless, they rely on ZooKeeper to maintain and coordinate Brokers, such as notifying consumers and producers of the existence of a new Broker or when a Broker has failed, as well as routing all requests to partition Leaders. ZooKeeper can read, write, and observe updates to data as a distributed coordination service.

Zookeeper maintains the last offset position of each consumer so that a consumer can quickly recover from the last position in case of a failure. ZooKeeper stores the current offset value of each consumer as it acknowledges each message as received so that the consumer can receive the next offset in the partition’s sequence.

SUMMARY

Since its launch as an open source project by LinkedIn in 2011, Kafka has become the most popular platform for distributing and streaming data. Any system that moves data around between services and may also need to transform the data in transit will find Kafka is a great fit.

Create Kafka Topics in 3 Easy Steps

Creating a topic in production is an operative task that requires awareness and preparation. In this tutorial, we’ll explain all the parameters to consider when creating a new topic in production.

Setting the partition count and replication factor is required when creating a new Topic and the following choices affect the performance and reliability of your system.

Create a topic

kafka/bin/kafka-topics.sh --create 
--zookeeper localhost:2181 
--replication-factor 2 
--partitions 3 
--topic unique-topic-name

PARTITIONS

Kafka topics are divided into a number of partitions, which contains messages in an unchangeable sequence. Each message in a partition is assigned and identified by its unique offset.

Partitions allow us to split the data of a topic across multiple brokers balance the load between brokers. Each partition can be consumed by only one consumer group, so the parallelism of your service is bound by the number of partition the topic has.

The number of partitions is affected by two main factors, the number of messages and the avg size of each message. In case the volume is high you will need to use the number of brokers as a multiplier, to allow the load to be shared on all consumers and avoid creating a hot partition which will cause a high load on a specific broker. We aim to keep partition throughput up to 1MB per second.

Set Number of Partitions

--partitions [number]

REPLICAS

Kafka-Topic-Producer-writes

Kafka optionally replicates topic partitions in case the leader partition fails and the follower replica is needed to replace it and become the leader. When configuring a topic, recall that partitions are designed for fast read and write speeds, scalability, and for distributing large amounts of data. The replication factor (RF), on the other hand, is designed to ensure a specified target of fault-tolerance. Replicas do not directly affect performance since at any given time, only one leader partition is responsible for handling producers and consumer requests via broker servers.

Another consideration when deciding the replication factor is the number of consumers that your service needs in order to meet the production volume.

Set Replication Factor (RF)

In case your topic is using keys, consider using RF 3 otherwise, 2 should be sufficient.

--replication-factor [number]

RETENTION

The time to keep messages in a topic, or the max topic size. Decide according to your use case. By default, the retention will be 7 days but this is configurable.

Set Retention

--config retention.ms=[number]

COMPACTION

In order to free up space and clean up unneeded records,  Kafka compaction can delete records based on the date and size of the record. It can also delete every record with identical keys while retaining the most recent version of that record. Key-based compaction is useful for keeping the size of a topic under control, where only the latest record version is important.

Enable Compaction

log.cleanup.policy=compact

For an introduction on Kafka, see this tutorial.