The new standard of observability is here. Discover Olly, the industry’s first

Prometheus metrics are an essential part of your observability stack. Observability comes hand in hand with monitoring, and is covered extensively here in this Essential Observability Techniques article. A well-monitored application with flexible logging frameworks can pay enormous dividends over a long period of sustained growth, but Prometheus has a problem when it comes to scale.
Prometheus Metrics at Scale
Prometheus is an extremely popular choice for collecting and querying real-time metrics primarily due to its simplicity, ease of integration, and powerful visualizations. It’s perfect for small and medium-sized applications, but what about when it comes to scaling?
Unfortunately, a traditional Prometheus & Kubernetes combo can struggle at scale given its heavy reliance on writing memory to disk. Without specialized knowledge in the matter, configurations for high performance at scale is extremely tough. For example, querying through petabytes of historical data with any degree of speed will prove to be extremely challenging with a traditional Prometheus setup as it relies heavily on read/write disk operations.
So how do you scale your Prometheus Metrics?
This is where Thanos comes to the rescue. In this article, we will be expanding upon what Thanos is, and how it can give us a helping hand and allow us to scale using Prometheus without the memory headache. Lastly, we will be running through a few great usages of Thanos and how effective it is using real world examples as references.
Thanos
Thanos, simply put, is a “highly available Prometheus setup with long-term storage capabilities”. The word “Thanos” comes from the Greek “Athanasios”, meaning immortal in English. True to its name, Thanos features object storage for an unlimited time and is heavily compatible with Prometheus and other tools that support it such as grafana.
Thanos allows you to aggregate data from multiple Prometheus instances and query them, all from a single endpoint. Thanos also automatically deals with duplicate metrics that may arise from multiple Prometheus instances.
Let’s say we were running multiple prometheus instances, and wanted to use Thanos to our advantage. We will take a look at the relationship between these two components and then delve into more technical details.
Storage
The first step to solving memory woes using Thanos is its Sidecar component, as it allows seamless uploading of metrics as object storage on your typical providers (S3, Swift, Azure etc). It employs the use of the StoreAPI as an API gateway, and only uses a small amount of disk space to keep track of remote blocks and keep them in sync. The StoreAPI is a gRPC that uses SSL/TLS authentication, and therefore standard HTTP operations are converted into gRPC format. Information on this can be found here.
Thanos also features Time Based Partitioning which allows you to set flags that query metrics from certain timeframes within the Store Gateway. For example: --min-time=-6w would be used as a flag to filter data older than 6 weeks.
Additionally, Thanos has an Index Cache and implements the use of a Caching Bucket – certainly powerful features that allow you to safely transition from a read/write dependency to seamless cloud storage. These latency performance boosters are essential when scaling – every ms counts.
The use of the Sidecar is also invaluable in case of an outage. It is key to be able to refer to historical data through the use of backups on the cloud. Using a typical Prometheus setup, you could very well lose important data in case of an outage.
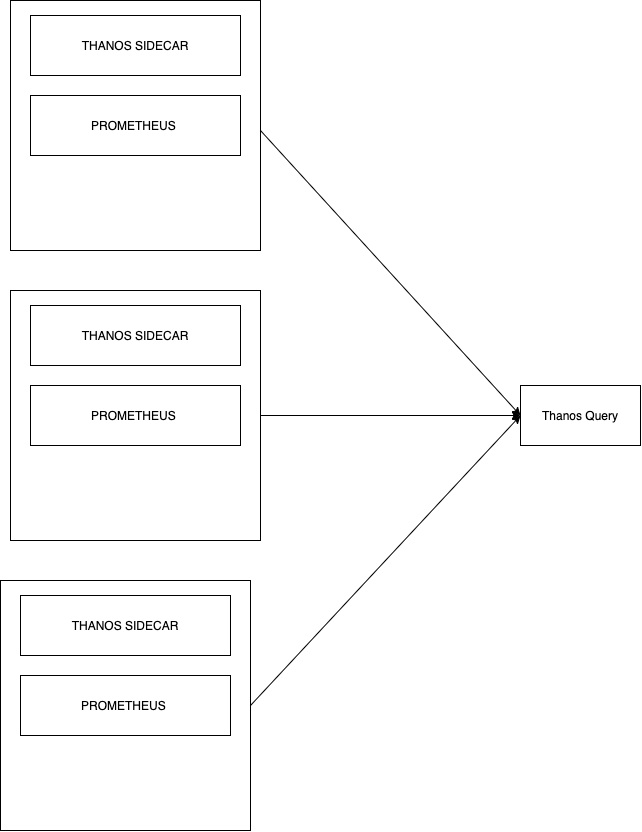
Basic Thanos Query
The basic Thanos setup seen above in the diagram also contains the Thanos Query component, which is responsible for aggregating and deduplicating metrics like briefly mentioned earlier. Similar to storage, Thanos Query also employs the use of an API – namely the Prometheus HTTP API. This allows querying data within a Thanos cluster via PromQL. It intertwines with the previously mentioned StoreAPI by querying underlying objects and returning the result. The Thanos querier is “fully stateless and horizontally scalable”, per its developers.
Scaling Thanos Query
Thanos Query works as an aggregator for multiple sidecar instances, but we could easily find ourselves using multiple Kubernetes clusters, with multiple Prometheus instances. This would mean we would have multiple Thanos Query nodes leading subsets of Sidecar & Prometheus instances. Intuitively, this is a difficult problem to solve.
The good news is that a Thanos Query node aggregates multiple instances of Thanos Query nodes also! Sounds confusing? It’s actually very simple:
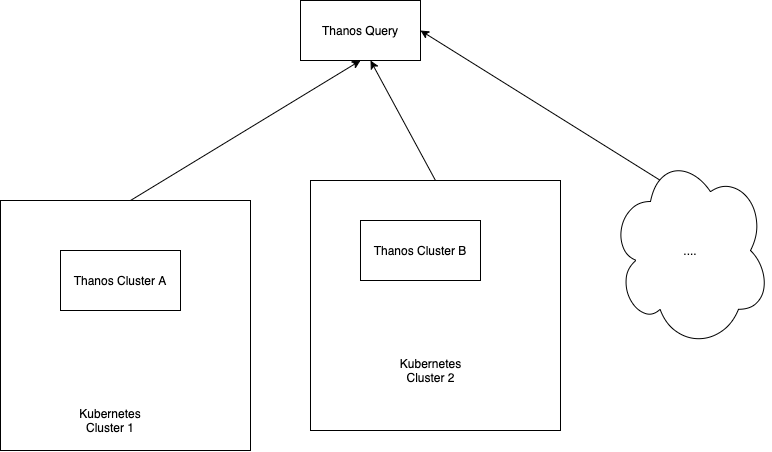
It doesn’t matter if your project spans over multiple Kubernetes clusters. Thanos deduplicates metrics automatically. The “head” Thanos Query node takes care of this for us by running high performance deduplication algorithms.
The clear advantage to this type of setup is that we end up with a single node where we can query all of our metrics. But this also has a clear disadvantage – What if our head Thanos Query node goes down? Bye bye metrics?
Luckily there are options to truly nail the Thanos setup over multiple Kubernetes clusters. This fantastic article runs through “Yggdrasil”, an AWS multi-cluster load-balancing tool. It allows you to perform queries against any of your clusters and still access all of your metrics. This is especially important in case of any downtime or service failures. With careful planning, you can cut down data loss to pretty much near 0%.
Availability
It should be clear by now that the sum of all these parts is a Prometheus setup with high availability of data. The use of Thanos Query and Thanos Sidecar significantly facilitate the availability of objects and metrics. Given the convenience of a single metric collection point, alongside unlimited retention of object storage, it’s easy to see why the first four words on the Thanos website are “Highly available Prometheus setup”.
Uses of Thanos for Prometheus Metrics
Nubank
Many large companies are using Thanos to their advantage. Nubank, a Brazilian fintech company that toppled a $10B valuation last year, has seen massive increases to operational efficiency after fitting Thanos, within other tools into their tech stack.
A case study on the company revealed that the Nubank cloud native platform “includes Prometheus, Thanos and Grafana for monitoring”. Although its ultimately impossible to attribute this solely to Thanos, the case study explains how Nubank now deploys “700 times a week” and has “gained about a 30% cost efficiency”. It seems even a very large-scale application can deeply benefit from a hybrid Prometheus+Thanos setup.
GiffGaff
Popular UK mobile network provider GiffGaff also boasts the use of Thanos. In fact, they have been fairly public as to how Thanos fits into their stack and what sort of advantages it has given them.
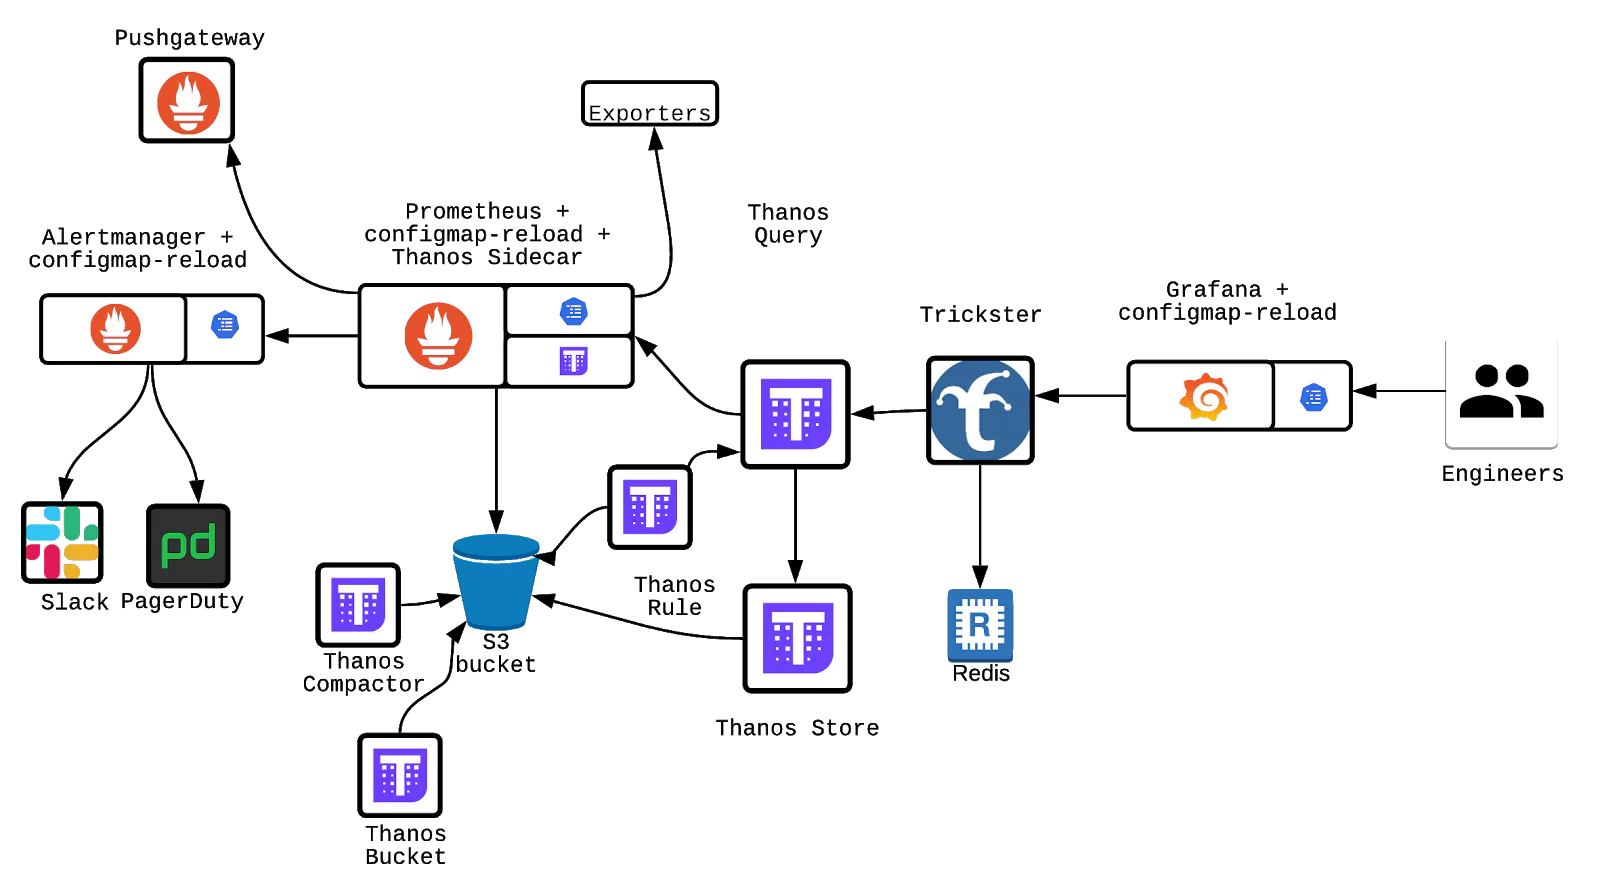
The diagram above shows that the Thanos Store, Thanos Query and Thanos Bucket. They are critical parts of the monitoring data flow. Objects are constantly being synced and uploaded onto an S3 bucket. In comparison to disk operations seen in a normal Prometheus setup, this scales far more and benefits from the reliability of S3.
Within their post under the “Thanos” section, GiffGaff claims “As long as at least one server is running at a given time, there shouldn’t be data loss.” This hints at some form of multi-cluster load balancing at the very least.
“… [Thanos] allowed us [GiffGaff] to retain data for very long periods in a cost-efficient way”
Interestingly, GiffGaff employs the use of the sidecar to upload objects every 2 hours – hedging against any potential prometheus downtime.
GiffGaff uses Thanos Store and allocates time periods for each Thanos Store cluster for storage. This effectively rotates the cluster use, keeping availability and reliability very high. The example given, by GiffGaff themselves is:
- now – 2h: Thanos Sidecars
- 2h – 1 month: Thanos Store 1
- 1 month – 2 months: Thanos Store 2
- 2 months – 3 months: Thanos Store 3
We had previously touched upon Thanos downsampling and how it could save you time when querying historical data. In order to implement this, GiffGaff used the Thanos Compactor, “performing 5m downsampling after 40 hours and 1h downsampling after 10 days.” Impressive to say the least.
Conclusion
Now you know what Thanos is, how it interacts with Prometheus and the type of advantages it can give us. In this post, we also ran through some real life examples which should give some insight into how Thanos is used. It should also be clear how the use of Thanos Sidecar and Storage are inherently advantageous when it comes to scaling, in relation to a typical Prometheus setup.
Apart from storage capabilities, the effectiveness of Thanos Query should also be direct – and how a single metric collection point is a massive blessing but comes with its own responsibilities should you need to balance the load on multiple clusters.
Lastly, downsampling through the use of the Thanos Compactor seems like a performance no brainer. Large datasets can be easily handled using the downsampling method.
Hopefully you understand Thanos and what it has to offer to make your life easier. If that sounds like a lot of work, Coralogix offers a powerful suite of monitoring tools.