Your Team is Using Claude Code. Do You Know What It’s Costing You?

The first two weeks of Claude Code are exciting. The third week is when you realize you don’t have visibility into what it’s doing or what it’s costing you.
You would not run a production service without metrics, logs, and dashboards or deploy an API without knowing its latency, error rate, or cost per request. Yet right now, thousands of engineering teams are running Claude Code, an AI agent that makes real code changes, fires tool calls, and accumulates model costs, with no real visibility into what it is doing. Without instrumentation, Claude Code sessions are a black box.
This isn’t a criticism; it’s just where we are in the adoption curve. The tooling has not caught up to the speed of adoption. Until now.
Claude Code already emits the data. Coralogix makes it usable.
Claude Code has native OpenTelemetry support built in. Every session automatically generates structured telemetry, including token usage, model-level cost, tool calls, code edits, commits, pull requests, and active processing time.
What it doesn’t come with is a destination and a dashboard.
Coralogix integrates directly to Claude Code’s OTLP exporter, so every session streams metrics and logs in real time into your existing observability pipeline. That includes cost metrics, token breakdowns by type, code impact signals such as lines added and commits, and session-level activity tied to individual users and workflows.
Instead of isolated sessions, you get a unified view across your entire engineering organization. You move from raw telemetry to actual answers like who is driving cost, which models are being used, what code was produced, and whether that spend translated into meaningful output.
This is not another tool layered on top. It extends your existing observability stack to include AI coding agents as first-class infrastructure, using the same OpenTelemetry pipeline, the same querying tools, and the same workflows your teams already rely on.
Three signals that change how you think about AI coding costs
Once that telemetry is in place, patterns emerge quickly, especially around where cost is coming from and what you are getting in return.
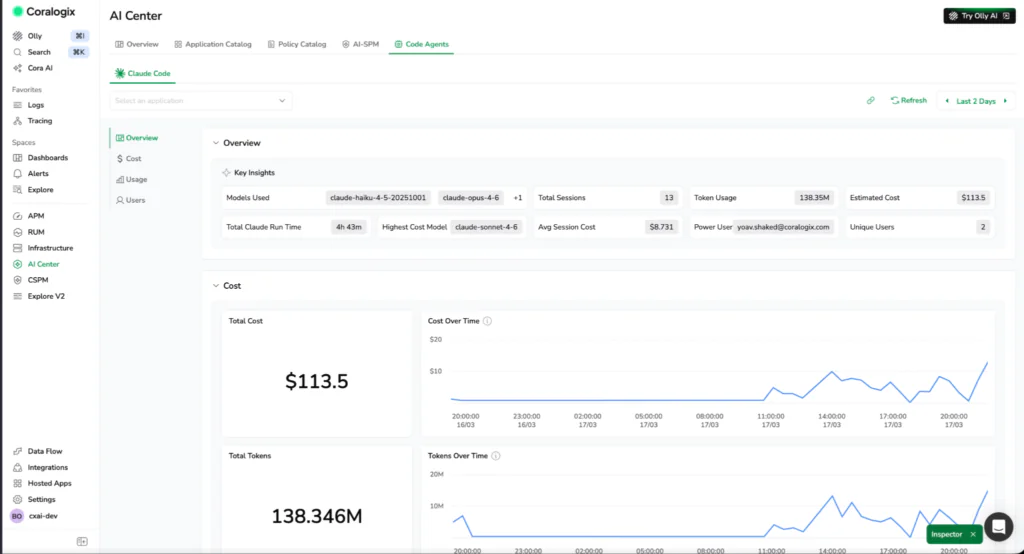
Token usage and model costs
Get visibility into token consumption and estimated cost across models, sessions, and users.
Usage is broken down by token type, including input, output, cache reads, and cache writes, so you can see exactly what is driving spend and where inefficiencies start to appear. If a team is generating large outputs but accepting very few edits, that ratio tells a story worth investigating.
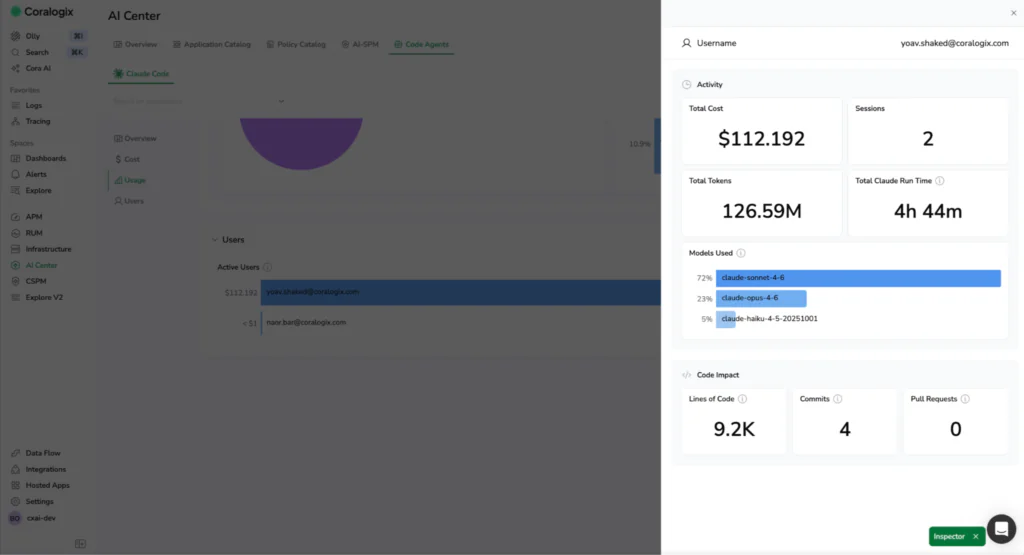
Code impact vs. compute consumed
Correlate spend with code impact such as lines added, commits, and pull requests. Measure efficiency across teams and workflows and understand whether usage is producing meaningful results.
Token spend on its own is an incomplete signal. What matters is what you got for it; cost only matters in relation to output. Answer the question that actually matters: are we getting proportional code output for what we’re spending?
Active time breakdown
Separate active processing time from user interaction time. You can see how long Claude Code is actively working versus how long developers are reviewing, editing, or waiting.
This distinction helps identify real bottlenecks. Some teams are limited by model latency. Others are limited by human review cycles. Without this split, both look the same.
What this looks like in practice
A few weeks after rolling out Claude Code, a platform lead gets pulled into a familiar conversation.
Finance is asking why AI costs spiked. Engineering says usage is up, but no one can explain what is actually driving the increase. Some teams claim they are moving faster and others are unsure if it is helping at all. After integrating with Coralogix, the picture changes within hours.
Now, they can see:
- Identify which users and teams are driving the highest AI spend
- Understand which models are contributing most to overall cost
- Detect inefficient usage patterns, such as high output with low acceptance rates
- Compare teams to see who is generating consistent output with lower spend
- Shift from reacting to monthly bills to acting on real-time usage data
- Optimize model usage and share best practices across teams
- Set clear expectations for efficient AI workflows
- Make cost predictable and usage intentional
What was previously invisible becomes something they can measure and control. Instead of reacting to a bill, they can act on the data. They adjust model usage, share best practices across teams, and set expectations around efficient workflows. Over time, cost becomes predictable, and usage becomes intentional.
The instrument panel you should have had from day one
AI coding agents are infrastructure now. They consume compute, they make changes to your codebase, and they have real costs that scale with usage. Treating them differently from the rest of your observable stack is exactly how you end up in a reactive conversation with finance instead of a proactive one with your engineering teams.
The Coralogix integration with Claude Code makes observability the default, not the afterthought. Token costs land next to your application metrics. Code impact is correlated with compute spend. Every session is traceable, every team is accountable, and the bill at the end of the month stops being a surprise.
You would not run production systems without observability. There is no reason to run AI coding agents without it.