OpenTelemetry Tracing: How It Works, Tutorial and Best Practices

How Does Tracing Work?
Tracing in OpenTelemetry refers to tracking the execution of transactions or workflows through multiple distributed systems. It involves collecting data about requests as they propagate through services, providing visibility into performance bottlenecks, latency issues, and errors. Each piece of traced data, known as a “trace,” represents a single operation or transaction and consists of one or more spans.
A span is the primary building block of a trace, representing a specific operation within the workflow. Spans include metadata such as start and end times, operation names, and status codes. By connecting multiple spans together, developers can visualize the entire path of a request, making it easier to diagnose and optimize application performance.
Related content: Read our guide to OpenTelemetry collector
Understanding the OpenTelemetry Tracing API
When using the OpenTelemetry API for tracing, it’s important to understand the following concepts.
TracerProvider
TracerProvider acts as the entry point for creating tracers in OpenTelemetry. It is responsible for configuring and managing the lifecycle of Tracer instances. Users can configure TracerProvider with specific settings, such as resource labels and exporters, to control how telemetry data is collected and where it is sent.
TracerProvider ensures that consistent configuration is applied to all Tracer instances it creates. Once configured, TracerProvider facilitates the instantiation of Tracer objects. These objects are then used to start and manage spans.
Tracer
Tracer is an interface provided by OpenTelemetry to start and end spans. Through the Tracer, developers can initiate tracing operations, defining the boundaries and metadata of spans. It is used to create child spans, encapsulating nested operations within the context of a larger transaction.
Each Tracer is associated with a name and an optional version, which helps in distinguishing the traces originating from different parts of an application. The Tracer interface abstracts the complexity of span management, providing a streamlined API that can generate detailed telemetry data.
Span
A span in OpenTelemetry represents a single operation within a distributed system. It contains information such as the operation name, start and end times, attributes, and events. Spans are the building blocks of traces, linking together to form a detailed view of a transaction’s journey across services and components.
Each span has a unique identifier and references to parent or child spans, creating a hierarchical structure that mirrors the call flow of the application. Spans can be annotated with events, capturing significant incidents or exceptions that occur during their execution.
This granular level of detail helps developers and operators pinpoint issues, understand dependencies, and optimize performance in complex distributed environments.
Quick Tutorial: Getting Started with OpenTelemetry Tracing
Acquire a Tracer
When implementing OpenTelemetry tracing, start by acquiring a Tracer. This Tracer is needed to create spans, which are essential for tracking the execution of operations across your application. To get started, you incorporate the necessary imports and then instantiate a Tracer using the OpenTelemetry API. Here’s how you can do it in Java:
import io.opentelemetry.api;
...

Tracer tracer = openTelemetry.getTracer("instrumentation-library-name", "1.0.0");
This code snippet initiates the process of obtaining a Tracer by specifying the name and version of your instrumentation library.
Create a Span
Once you have a Tracer, you can create spans. Spans represent individual operations within your application. The OpenTelemetry SDK manages the start and end times of these spans, simplifying the process. Here’s an example of creating and activating a span:
Span span = tracer.spanBuilder("span 1").startSpan();

// Set this span as the current span

try (Scope ss = span.makeCurrent()) {

} finally {

   span.end();

}
This example shows how to create a span with a specific name and how to make it the current active span within a given scope, ensuring it’s automatically ended after its execution block.
Note: On Ubuntu, you might need to first download the required JARs and use them in the command line when executing.
Create Nested Spans
Nested spans allow you to trace the hierarchy and flow of operations within your services. Here’s an example showing how you can create nested spans for a scenario where a parent method invokes a child method:
void parentOne() {
Span parentSpan = tracer.spanBuilder("parent").startSpan();

   try {

       childOne(parentSpan);

   } finally {

       parentSpan.end();

   }

}

void childOne(Span parentSpan) {

   Span childSpan = tracer.spanBuilder("child")

        .setParent(Context.current().with(parentSpan))

        .startSpan();

   // Perform operations

   childSpan.end();

}
The output should look something like this:
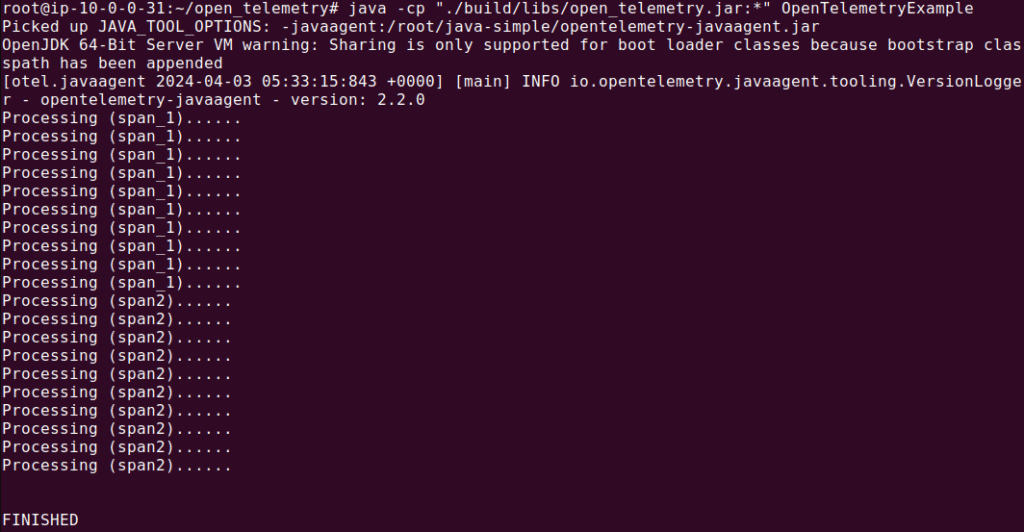
In this code, parentOne initiates a parent span, and within it, childOne is called, creating a child span. The child span is explicitly linked to its parent through context propagation, illustrating the hierarchical relationship between operations.
Add Attributes to the Span
Adding attributes to spans enriches the telemetry data with additional context. Attributes can describe the operation being tracked, such as HTTP method and URL in the case of a web request:
Span span = tracer.spanBuilder("/resource/path").setSpanKind(SpanKind.CLIENT).startSpan();
span.setAttribute("http.method", "GET");

span.setAttribute("http.url", url.toString());
This snippet creates a span for a client request, marking it with HTTP method and URL attributes.
Propagate Context
OpenTelemetry employs W3C Trace Context HTTP headers for context propagation across distributed systems. It’s important to note that the OpenTelemetry SDK and API work together to ensure that context is propagated according to the W3C Trace Context specification.
Once set up, the trace context is carried across service boundaries without additional effort from the developer, ensuring that spans across services are correctly linked.
Best Practices for OpenTelemetry Traces
Here are several measures that can help make the most of OpenTelemetry for tracing.
Specify the Span Kind Based on Usage
The span kind attribute in OpenTelemetry specifies the role of a span within a transaction—whether it represents a server handling a request, a client sending a request, a producer or a consumer. Correctly setting the span kind is crucial for accurate interpretation of trace data. It affects how spans are analyzed and visualized by observability tools.
Span kinds facilitate correct categorization and analysis of observability data. By correctly setting span kind, engineers can ensure that traces accurately reflect the architecture and behavior of their systems.
Leverage Automatic Instrumentation to Simplify Setup
Automatic instrumentation simplifies the initial setup process in OpenTelemetry by automatically capturing telemetry data from standard libraries and frameworks. It reduces manual coding effort, making it easier for teams to adopt observability practices. Developers can focus on building features instead of instrumentation code, accelerating development cycles.
Though automatic instrumentation covers common scenarios, manual instrumentation may be needed for custom or complex use cases. Using automatic instrumentation by default, and adding manual instrumentation when necessary, allows teams to minimize effort while retaining the flexibility to capture specific telemetry data.
Record Errors and Stack Traces as Events
Recording stack traces and errors as events on spans is useful for diagnosing issues in distributed systems. It provides context about exceptions or failures that occur during operation execution. By attaching this information directly to spans, developers can quickly locate and understand the root cause of problems, reducing downtime and improving application stability.
Incorporating error details into spans enriches trace data, offering a comprehensive view of application behavior under error conditions. This practice facilitates efficient debugging and optimization efforts, ensuring high-quality service delivery.
Control Data Volumes with Sampling
Sampling is a technique to manage the volume of trace data collected by selecting a subset of spans for recording and analysis. It helps balance the need for detailed observability with system overhead constraints.
OpenTelemetry supports various sampling strategies. By carefully selecting the spans to sample, developers can maintain high levels of observability without incurring excessive costs or overwhelming storage and processing resources. This practice is crucial for scaling observability in large-scale environments.
Managed Application Observability with Coralogix
Coralogix sets itself apart in observability with its modern architecture, enabling real-time insights into logs, metrics, and traces with built-in cost optimization. Coralogix’s straightforward pricing covers all its platform offerings including APM, RUM, SIEM, infrastructure monitoring and much more. With unparalleled support that features less than 1 minute response times and 1 hour resolution times, Coralogix is a leading choice for thousands of organizations across the globe.