Node logging best practices and tips

As is traditional with the JavaScript world, there are a dizzying amount of options for node log monitoring. In this article, I will dig into some of the better and lesser-known options to see what’s on offer and help you log better in your Node applications.
Best practices
Before deciding what tool works best for you, following broad logging best practices will help make anything you do log more useful when trying to track down a problem. Read “The Most Important Things to Log in Your Application Software” and the introduction of “JAVA logging – how to do it right” for more details, but in summary, these rules are:
- Enable logging: This sounds like an obvious rule in an article about logging, but double check you have enabled logging (in whatever tool you use) before deploying your application and don’t solely rely on your infrastructure logging.
- Categorize your logs: As an application grows in usage, the amount of logs it generates will grow and the ability to filter logs to particular categories or error levels such as authorization, access, or critical can help you drill down into a barrage of information.
- Logs are not only for you: Your logs are useful sources of information for a variety of stakeholders including support and QA engineers, and new programmers on your team. Keep them readable, understandable and clear as to their purpose.
And now to everyone’s favorite topic, tools.
Start with console
For many developers, debugging a Node application begins with the console and could still be enough if your application is simple. It offers two main logging outputs:
console.log('Keeping you informed'); // outputs to stdout
console.error('An error!'); // outputs to stderr
And that’s about it. For more useful logs, you need a bit more information including a level, a timestamp, and formats suitable for humans and machines. You could implement some of this yourself based around console by passing in string replacements and some less common methods (read more on MDN), but there are simpler ways.
Using console.log can cause performance issues and cause problems when trying to read these logs from a file into log collection tools as it prints the data with line breaks and causes the log collectors to split multi-line logs into separate entries.
Format JSON output with bunyan
Bunyan is a mature and popular option for node logging, currently at version 1.8.x that has a single purpose. It creates well-formatted JSON versions of your logs, which is particularly useful for those of you using external services to read your logs (see more below).
To get started, create a Logger, assigning it a name. From there bunyan has a logging API to tailor messages to your preferred format. For example:
var bunyan = require('bunyan');
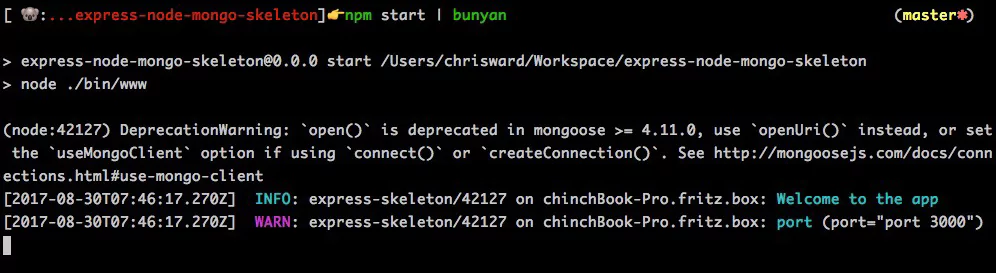
var log = bunyan.createLogger({name: 'express-skeleton'});
log.info('Welcome to the app'); // Just text
log.warn({port: bind}, 'port'); // Text plus metadata
Will produce the following output:
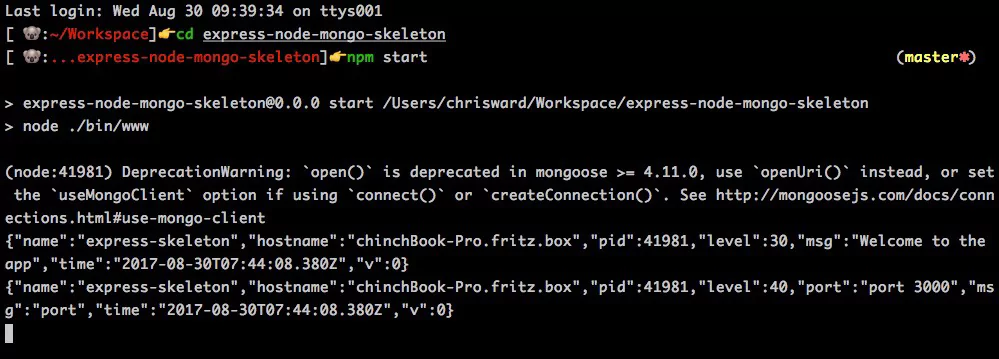
Which isn’t so human readable, but you can pipe this to the bunyan CLI tool, creating output suitable for you and any external services that work better with JSON.
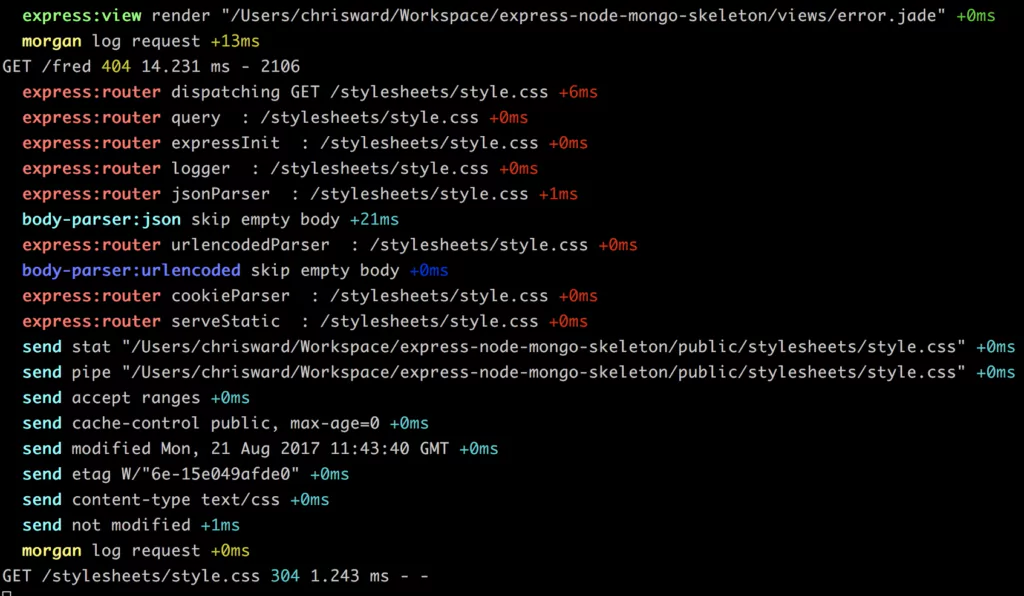
HTTP request logging with Morgan
Morgan is another popular package designed for one specific function, logging HTTP requests in the Express framework.
You’ll see it adding output to other screenshots in this article, and if you follow any basic Express getting started steps, you’re using it already.
You use Morgan by defining a format string. For example the code below uses Morgan’s default dev format that adds coloring, but there are others available:
logger = require('morgan');
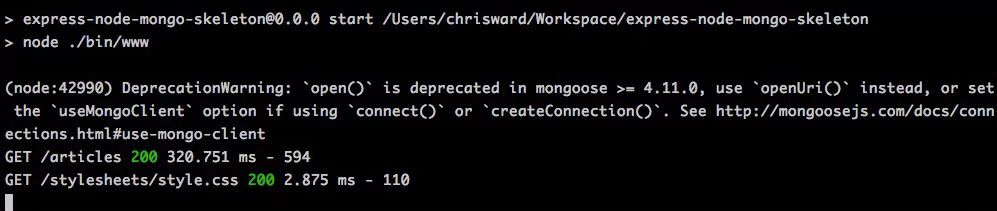
app.use(logger('dev'));
Which results in the following output.
Debugging with debug
For those of you developing applications that you distribute to others (including NPM packages) you’ll want to view logs whilst developing and testing, but hide them from end users. The debug package is a long-standing and popular tool in any Node developers toolkit that you can have present in your application, but toggle its output for when you need it.
Give your application a name, and then start debug, this will wrap console.error into something more usable. For example in this Express-based application:
var debug = require('debug')('express-node-mongo-skeleton:server');
...
function onListening() {
var addr = server.address();
var bind = typeof addr === 'string'
? 'pipe ' + addr
: 'port ' + addr.port;
debug('Listening on ' + bind);
}
Enable it by prefixing your application script command (read the documentation on how to customize this to suit your application), e.g.
DEBUG=* npm start
Log it with Winston
For more complex applications with greater or custom logging needs, Winston enters the fray, and possibly (based on git commits) the oldest option in this article. It allows you to define your own logging levels, custom loggers (and destinations), add metadata, maintain multiple asynchronous logs and more.
For example, to create a custom logger that adds a timestamp, uppercases the logging level and adds any metadata you define in a log message:
// Create custom logger

var logger = new (winston.Logger)({
transports: [
new (winston.transports.Console)({
timestamp: function() {
return Date.now();
},
formatter: function(options) {
return options.timestamp() +' '+ options.level.toUpperCase() +' '+ (options.message ? options.message : '') +
(options.meta && Object.keys(options.meta).length ? 'nt'+ JSON.stringify(options.meta) : '' );
}
})
]
});
And this example shows how to define different message types on the fly and also how to set a log level until you change it again.
function onListening() {
var addr = server.address();
var bind = typeof addr === 'string'
? 'pipe ' + addr
: 'port ' + addr.port;
logger.info('info', 'Listening on ' + bind);

logger.level = 'debug';
logger.log('debug', 'Now debug messages are written to console!');
}
And for those of you using Express, there’s middleware for Winston.
Gathering intel
A lesser-known option is the intel package, it offers similar features to the other options above, but provides a lot of default logger types, filters, and formatters. One interesting feature is that if an exception is triggered it will include a stack trace as a JSON object, giving you useful information for fixing problems. Also, intel has hierarchical loggers meaning you can pass messages up the logger chain if it meets certain criteria, kind of like levels in a support department.
Logging to external services
With all of these options you will still need to parse, process and understand your logs somehow, and numerous open source and commercial services can help you do this (search NPM and you’ll find lots), I’ll highlight those that support Node well.
The YAL package lets you define remote TCP loggers and send your logs there. It supports log levels, sets timestamps, hostnames, and multiple destinations.
log4js-node is a node version of the venerable log4js framework and offers a comprehensive feature list much like the two options above, and adds an API to provide plugins that can connect to external logging providers.
If you’re a fluentd user, then naturally there’s a Node package that also integrates with log4js and Winston. If Kibana is your platform of choice, then this package for Winston will format your logs to better suit it.
Loggly’s package supports tags, JSON objects, arrays, search, and a variety of options for what to log in the first place.
Airbrake’s package is more suited to error and exception handling and also supports Express and the hapi framework.
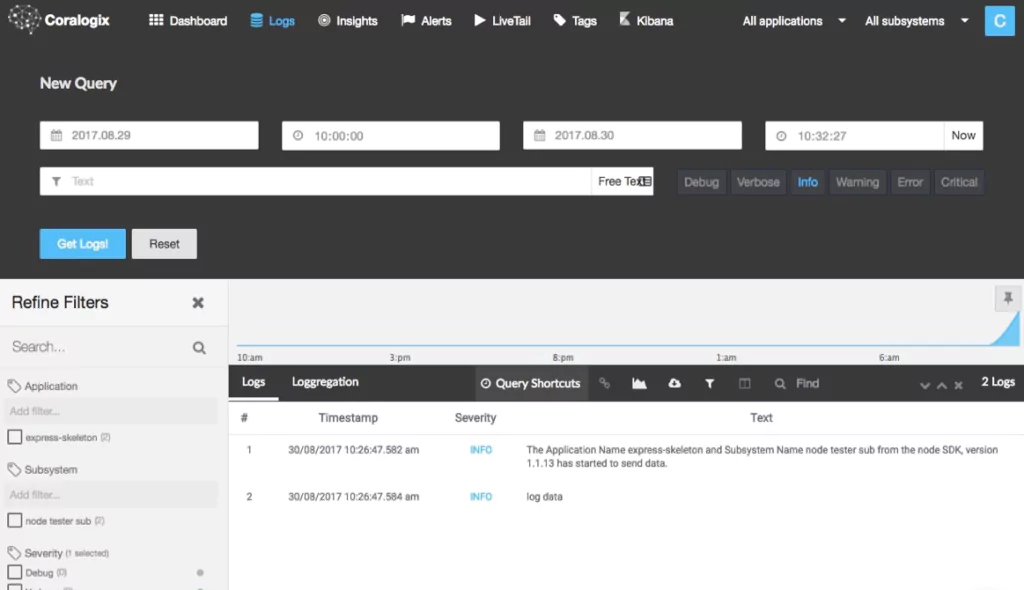
And of course, Coralogix’ own package allows you to create different loggers, assign a log level to them and other useful metadata. In addition to all standard logging features, such as flexible log querying, email alerts, centralized live tail, and a fully hosted Kibana, Coralogix provides machine learning powered anomaly detection in the context of Heroku builds.
Another benefit is that Coralogix is the only solution which offers straightforward pricing, all packages include all features.
The example below defines a new logger for information, sets an appropriate level and metadata for a class and method name:
var Coralogix = require("coralogix-logger");

const config = new Coralogix.LoggerConfig({
applicationName: "express-skeleton",
privateKey: ""
subsystemName: "node tester sub"
});

Coralogix.CoralogixLogger.configure(config);

const logger = new Coralogix.CoralogixLogger("Information");

const log = new Coralogix.Log({
severity: Coralogix.Severity.info,
className: "expressInit",
methodName: "onListening",
text: "Listening"
});

logger.addLog(log);
Coralogix also has integration options for Winston and Bunyan keeping you covered no matter what NodeJS option you choose.
With Winston, create configuration the same as above and add Coralogix as a transport.
var winston = require("winston");
var CoralogixWinston = require("coralogix-logger-winston");

var config = {…};

CoralogixWinston.CoralogixTransport.configure(config);

winston.configure({
transports: [new CoralogixWinston.CoralogixTransport({
category: "CATEGORY"
})]
});

winston.info("use winston to send your logs to coralogix");
And for Bunyan, again create your configuration and create a logger that streams to Coralogix as raw data, you can also use Coralogix as a child logger of other loggers.
var bunyan = require("bunyan");
var CoralogixBunyan = require("coralogix-logger-bunyan");

var config = {…};

CoralogixBunyan.CoralogixStream.configure(config);

var logger = bunyan.createLogger({
name: 'BUNYAN_ROOT',
streams: [
{
level: 'info',
stream: new CoralogixBunyan.CoralogixStream({category:"YOUR CATEGORY"}),
type: 'raw'
}
]
});

logger.info('hello bunyan');