Introducing the Coralogix CLI: Headless Observability for Every Agent.
Code Agents Need Observability

AI coding is everywhere. But is it actually helping?
For those of us using tools like Claude Code, Codex, or Gemini, we already know they’re powerful.
They can write code, refactor functions, open PRs, even run commands. For a lot of developers, they’re already part of the daily workflow.
But once you zoom out beyond the individual developer, the biggest problem isn’t productivity. It’s control. AI coding tools are powerful, but they introduce a new, unpredictable cost layer that most teams don’t fully understand.
Across a team, or an entire engineering org, it’s surprisingly hard to answer simple questions: Is this actually making us faster? Is the code better, or are we just producing more of it?
The visibility gap no one’s talking about
AI coding agent usage is inconsistent. Some developers lean on them heavily, while others prefer the old fashioned way, and there’s usually no clear picture of what the difference in output is actually like.
At the same time, these tools aren’t just suggesting code anymore, they’re taking action: editing files, running commands, and opening pull requests.
The impact of a single session can be significant for better or worse. And yet, for something this powerful, visibility is still pretty limited. You might see total usage or a monthly bill. But understanding what actually drove that cost, and whether it created value, is a lot harder.
Cost scales silently. More usage, longer prompts, heavier models, background agent activity adds up fast. And in most teams, no one can clearly answer: who is spending what, and why?
Introducing Code Agent Observability
Coralogix is now offering Code Agent Observability, giving you a way to see how AI coding agents are actually being used across your team and what they’re producing.
For any agent with native OpenTelemetry support, there’s nothing to instrument. No SDKs, no wrappers, no custom pipelines. Point the agent to your Coralogix OTLP endpoint, set your API key, and telemetry starts flowing automatically, capturing every session without ongoing maintenance as agents evolve.
For org-wide configurations, like Claude Code in Teams or Enterprise, setup is done once and applied across all developers. Without per-user setup or scripts, your entire engineering org goes from zero visibility to full observability with a single configuration.
All data lands directly in Coralogix, alongside your existing logs and metrics. You’re not adding another tool, you’re extending your current observability layer to include AI. And because it’s all based on OpenTelemetry, the same pipeline works across any agent your team uses today or adopts tomorrow.
What you get:
Across Claude, Codex, Gemini, and any OpenTelemetry-enabled agent, you get a single view of:
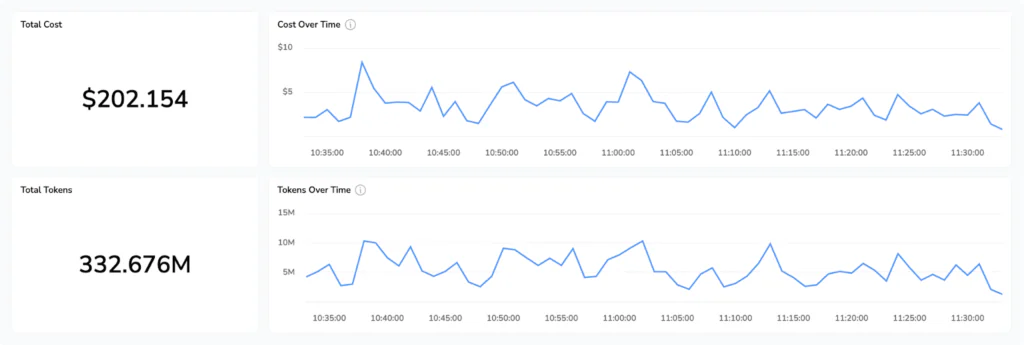
- Cost and token usage: Real-time visibility into token consumption, model usage, and estimated cost, broken down by user, session, and agent activity.
- Code impact: lines added and removed, git commits made, pull requests opened, all attributed to specific sessions and developers.
- Tool call decisions: every accept and reject on an AI-generated code suggestion, tracked with the tool name, decision source, and language.
- Session activity: active processing time split between AI/tool work and keyboard interaction, so you can see how much of a session was agent versus the developer
- Prompts and tool details: opt-in log events that capture prompt text, MCP server names, and tool outcomes for sessions where you want full detail
All of this is queryable in Coralogix via DataPrime or Lucene. So instead of guessing, you can actually see what’s going on.
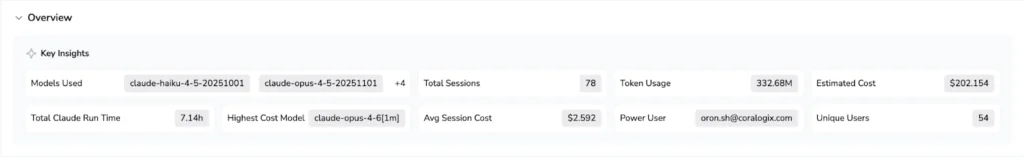
The dashboard
The Code Agent Observability dashboard in AI Center has four tabs:
- Overview: active models, total spend, and session volume for any time range
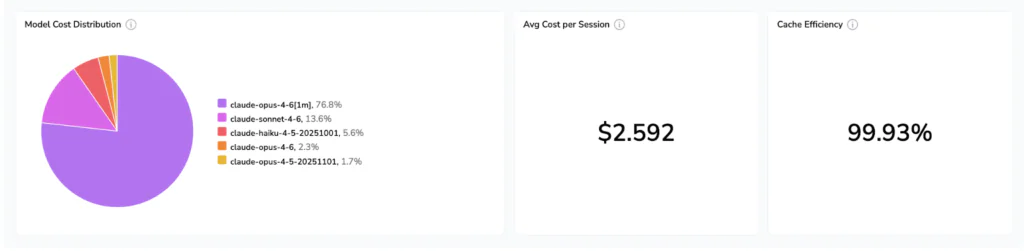
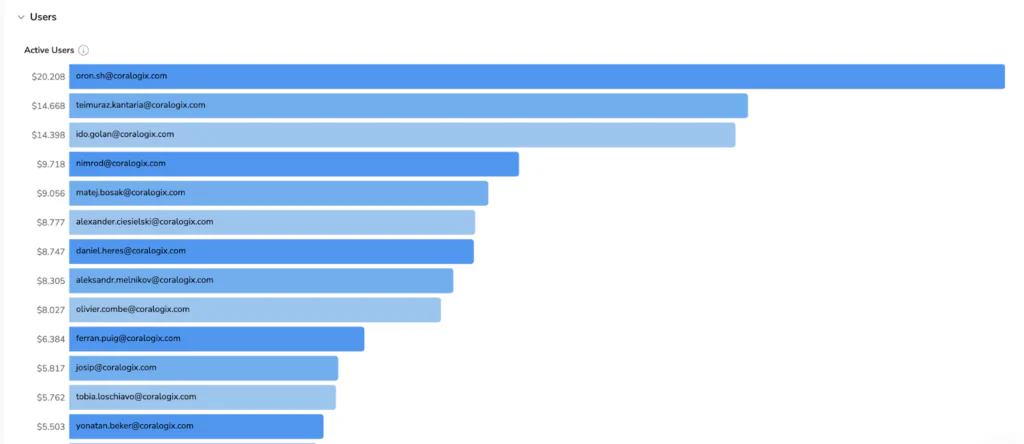
- Cost: model cost distribution, a ranked breakdown of highest-spending users, and a productivity ratio (accepted AI suggestions vs. total generated) so you can see whether spend is translating into accepted output
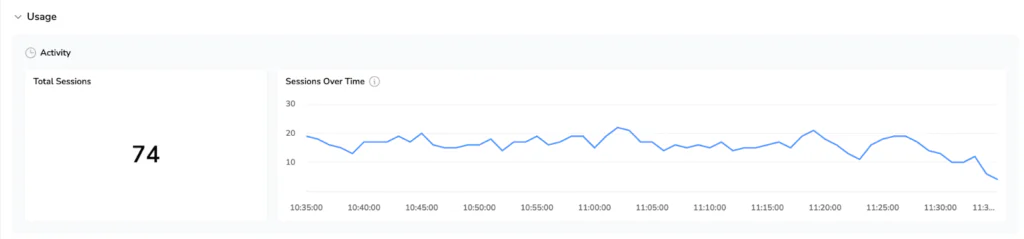
- Usage: session count, request volume, code impact, acceptance rate trends, and a tool call breakdown showing what Claude actually did during sessions
- Users: ranked by estimated cost, with drill-down into any individual developer’s session activity, token consumption, and code impact over time
Better answers, not just more data
Because this telemetry lives alongside the logs, metrics, and integrations you’ve already set up in Coralogix (like Github, PagerDuty, or incident.io) you can start correlating things that were previously impossible to connect:
- Does higher AI usage correlate with faster incident resolution?
- Are AI-generated changes more likely to fail in production?
- Which developers are getting the most leverage from these tools and what are they doing differently?
AI stops being something experimental and starts becoming part of how your system behaves.
AI isn’t the question anymore
The real question is: are you in control of it, or just paying for it?
Now you have the data to see.