How to Configure the OTel Community Demo App to Send Telemetry Data to Coralogix

If you’re just getting familiar with full-stack observability and Coralogix and you want to send us your metrics and traces using the new OpenTelemetry Community Demo Application, this blog is here to help you get started. In this simple, step-by-step guide, you will learn how to get telemetry data produced by the OpenTelemetry Demo Webstore into your Coralogix dashboard using Docker on your local machine.
Intro
Earlier this year, OpenTelemetry (OTel) announced a project to build an OpenTelemetry Demo, and more recently it shared OpenTelemetry Demo v1.0 with the world, which allows you to quickly run a complete end-to-end distributed system instrumented with 100% OpenTelemetry traces and metrics. You might be asking why this is such a big deal. It makes OTel that much more accessible, by allowing anyone to easily create a sample application.
The example below uses the OpenTelemetry (OTel) Collector to ingest metrics and traces and sends them to us, where you can analyze and gain valuable insights from your data, including through the use of our new APM features.
OTel Demo App
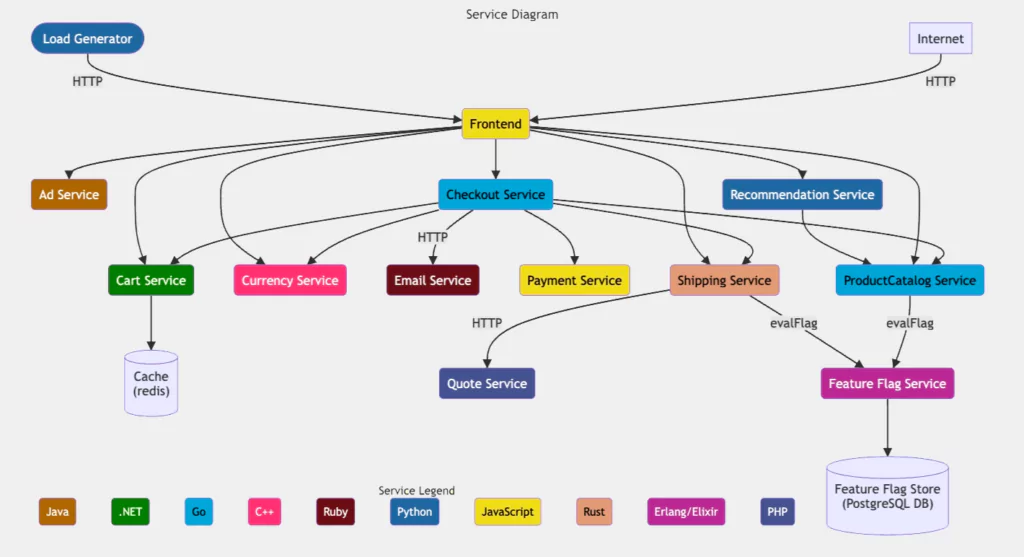
The OTel Demo App serves as a fully-functioning online store, the OpenTelemetry Astronomy Shop, a microservice-based distributed system intended to illustrate the implementation of OpenTelemetry in a near real-world environment.
The app consists of more than 14 micro-services that communicate with each other via gRPC, Redis, and HTTP libraries, with support for 6 languages (C#, Go, Java, Node.js, Python, and Ruby).
The demo app also comes with supporting components such as OpenTelemetry Collector, Grafana, Prometheus, and Jaeger to export and visualize metrics and traces. OpenTelemetry Collector can be configured to send telemetry data to multiple backends, including Coralogix.
OTel Collector
At the heart of the OTel Demo is the OTel Collector. It offers a vendor-agnostic implementation of how to receive, process and export telemetry data. It removes the need to run, operate, and maintain multiple agents/collectors.
The OTel Collector is configured via YAML, which is used to define receivers, processors, exporters, and pipelines.
To run the OTel Collector as part of the demo, you’ll need either a Docker or Kubernetes environment. We’ll deploy it locally using Docker Compose, which runs Docker, and send telemetry data to Coralogix as a backend.
Our ‘How-to’ Guide
Prerequisites
- Docker, Docker Compose, and Git installed on your local workstation
- Coralogix account in the domain corresponding to the region within which you would like your data stored
6 Easy Steps
STEP 1 – Clone the Webstore Demo repo
git clone <https://github.com/open-telemetry/opentelemetry-demo.git>
STEP 2 – Set up Exporter Configuration
- Change the directory and edit the
.envfile, add the following lines to the bottom and update the values to reflect your Coralogix account environment variables, as in the example below:- CORALOGIX_DOMAIN: You’ll need to include your account’s specific domain in the Coralogix endpoint.
- CORALOGIX_PRIVATE_KEY: Insert your Coralogix private key. Bear in mind that this information is sensitive and be kept secure.
- CORALOGIX_APP_NAME & CORALOGIX_SUBSYS_NAME: Customize and organize your data in your Coralogix dashboard using application and subsystem ****names.
# ********************
# Exporter Configuration
# ********************
CORALOGIX_DOMAIN=eu2.coralogix.com
CORALOGIX_APP_NAME=otel
CORALOGIX_SUBSYS_NAME=otel-demo
CORALOGIX_PRIVATE_KEY=b3887c90-5e67-4249-e81b-EXAMPLEKEY
- Next, edit the file
src/otelcollector/otelcol-config-extras.ymland add the following:
# extra settings to be merged into OpenTelemetry Collector configuration
# do not delete this file

exporters:
  coralogix:
    domain: ${CORALOGIX_DOMAIN}

    # Your Coralogix private key is sensitive
    private_key: "${CORALOGIX_PRIVATE_KEY}"

    # AppNameSubSystem values.
    # The first non-empty resource attribute is used.
    # application_name_attributes:
    #   - "service.namespace"
    #   - "k8s.namespace.name"
    # subsystem_name_attributes:
    #   - "service.name"
    #   - "k8s.deployment.name"
    #   - "k8s.statefulset.name"
    #   - "k8s.daemonset.name"
    #   - "k8s.cronjob.name"
    #   - "k8s.job.name"
    #   - "k8s.container.name"
    # It is required that logs, metrics and traces emitted by this exporter
    # are tagged in Coralogix
    # with the default application and subsystem constants.
    # Traces, Metrics and Logs emitted by this OpenTelemetry exporter
    # are tagged in Coralogix with the default application and subsystem constants.
    application_name: "${CORALOGIX_APP_NAME}"
    subsystem_name: "${CORALOGIX_SUBSYS_NAME}"

    # (Optional) Timeout is the timeout for every attempt to send data to the backend.
    timeout: 30s

processors:
  batch/traces:
    timeout: 1s
    send_batch_size: 50
  batch/metrics:
    timeout: 60s
  resourcedetection:
    detectors: [env, docker]
    timeout: 5s
    override: true

service:
  pipelines:
    traces:
      receivers: [otlp]
      processors: [transform, batch/traces, batch]
      exporters: [otlp, debug, spanmetrics, coralogix]
    metrics:
      receivers: [hostmetrics, docker_stats, httpcheck/frontend-proxy, otlp, redis, spanmetrics]
      processors: [resourcedetection, batch/metrics, batch]
      exporters: [otlphttp/prometheus, debug, coralogix]
    logs:
      receivers: [otlp]
      processors: [batch]
      exporters: [opensearch, debug, coralogix]
Next edit the following file /src/otelcollector/otelcol-config.yml
connectors:
  spanmetrics:

service:
  pipelines:
    traces:
      receivers: [otlp]
      processors: [transform, batch]
      exporters: [otlp, debug, spanmetrics]
    metrics:
      receivers: [hostmetrics, docker_stats, httpcheck/frontend-proxy, otlp, redis, spanmetrics]
      processors: [batch]
      exporters: [otlphttp/prometheus, debug]
    logs:
      receivers: [otlp]
      processors: [batch]
      exporters: [opensearch, debug]
STEP 3 – Update the OTEL Collector container definition
- Open
docker-compose.ymland update the otelcol container definition to match the environment variables that we defined earlier. Add theenvironmentsection to file, as done in the example below.
# OpenTelemetry Collector
otelcol:
  image: ${COLLECTOR_CONTRIB_IMAGE}
  container_name: otel-col
  deploy:
    resources:
      limits:
        memory: 200M
  restart: unless-stopped
  command: [ "--config=/etc/otelcol-config.yml", "--config=/etc/otelcol-config-extras.yml" ]
  user: 0:0
  volumes:
    - ${HOST_FILESYSTEM}:/hostfs:ro
    - ${DOCKER_SOCK}:/var/run/docker.sock:ro
    - ${OTEL_COLLECTOR_CONFIG}:/etc/otelcol-config.yml
    - ${OTEL_COLLECTOR_CONFIG_EXTRAS}:/etc/otelcol-config-extras.yml
  ports:
    - "${OTEL_COLLECTOR_PORT_GRPC}"
    - "${OTEL_COLLECTOR_PORT_HTTP}"
  depends_on:
    - jaeger
  logging: *logging
  environment:
    - ENVOY_PORT
    - HOST_FILESYSTEM
    - OTEL_COLLECTOR_HOST
    - OTEL_COLLECTOR_PORT_GRPC
    - OTEL_COLLECTOR_PORT_HTTP
    - CORALOGIX_DOMAIN
    - CORALOGIX_APP_NAME
    - CORALOGIX_SUBSYS_NAME
    - CORALOGIX_PRIVATE_KEY
STEP 4 – Launch the sample
- To run the environment, use the following command:
docker compose up --no-build
- If you are using a M1/M2 Mac, you’ll need to build the containers to ensure that they’re using the right architecture. This will take significantly longer (upwards of 20 minutes).
docker compose up --build
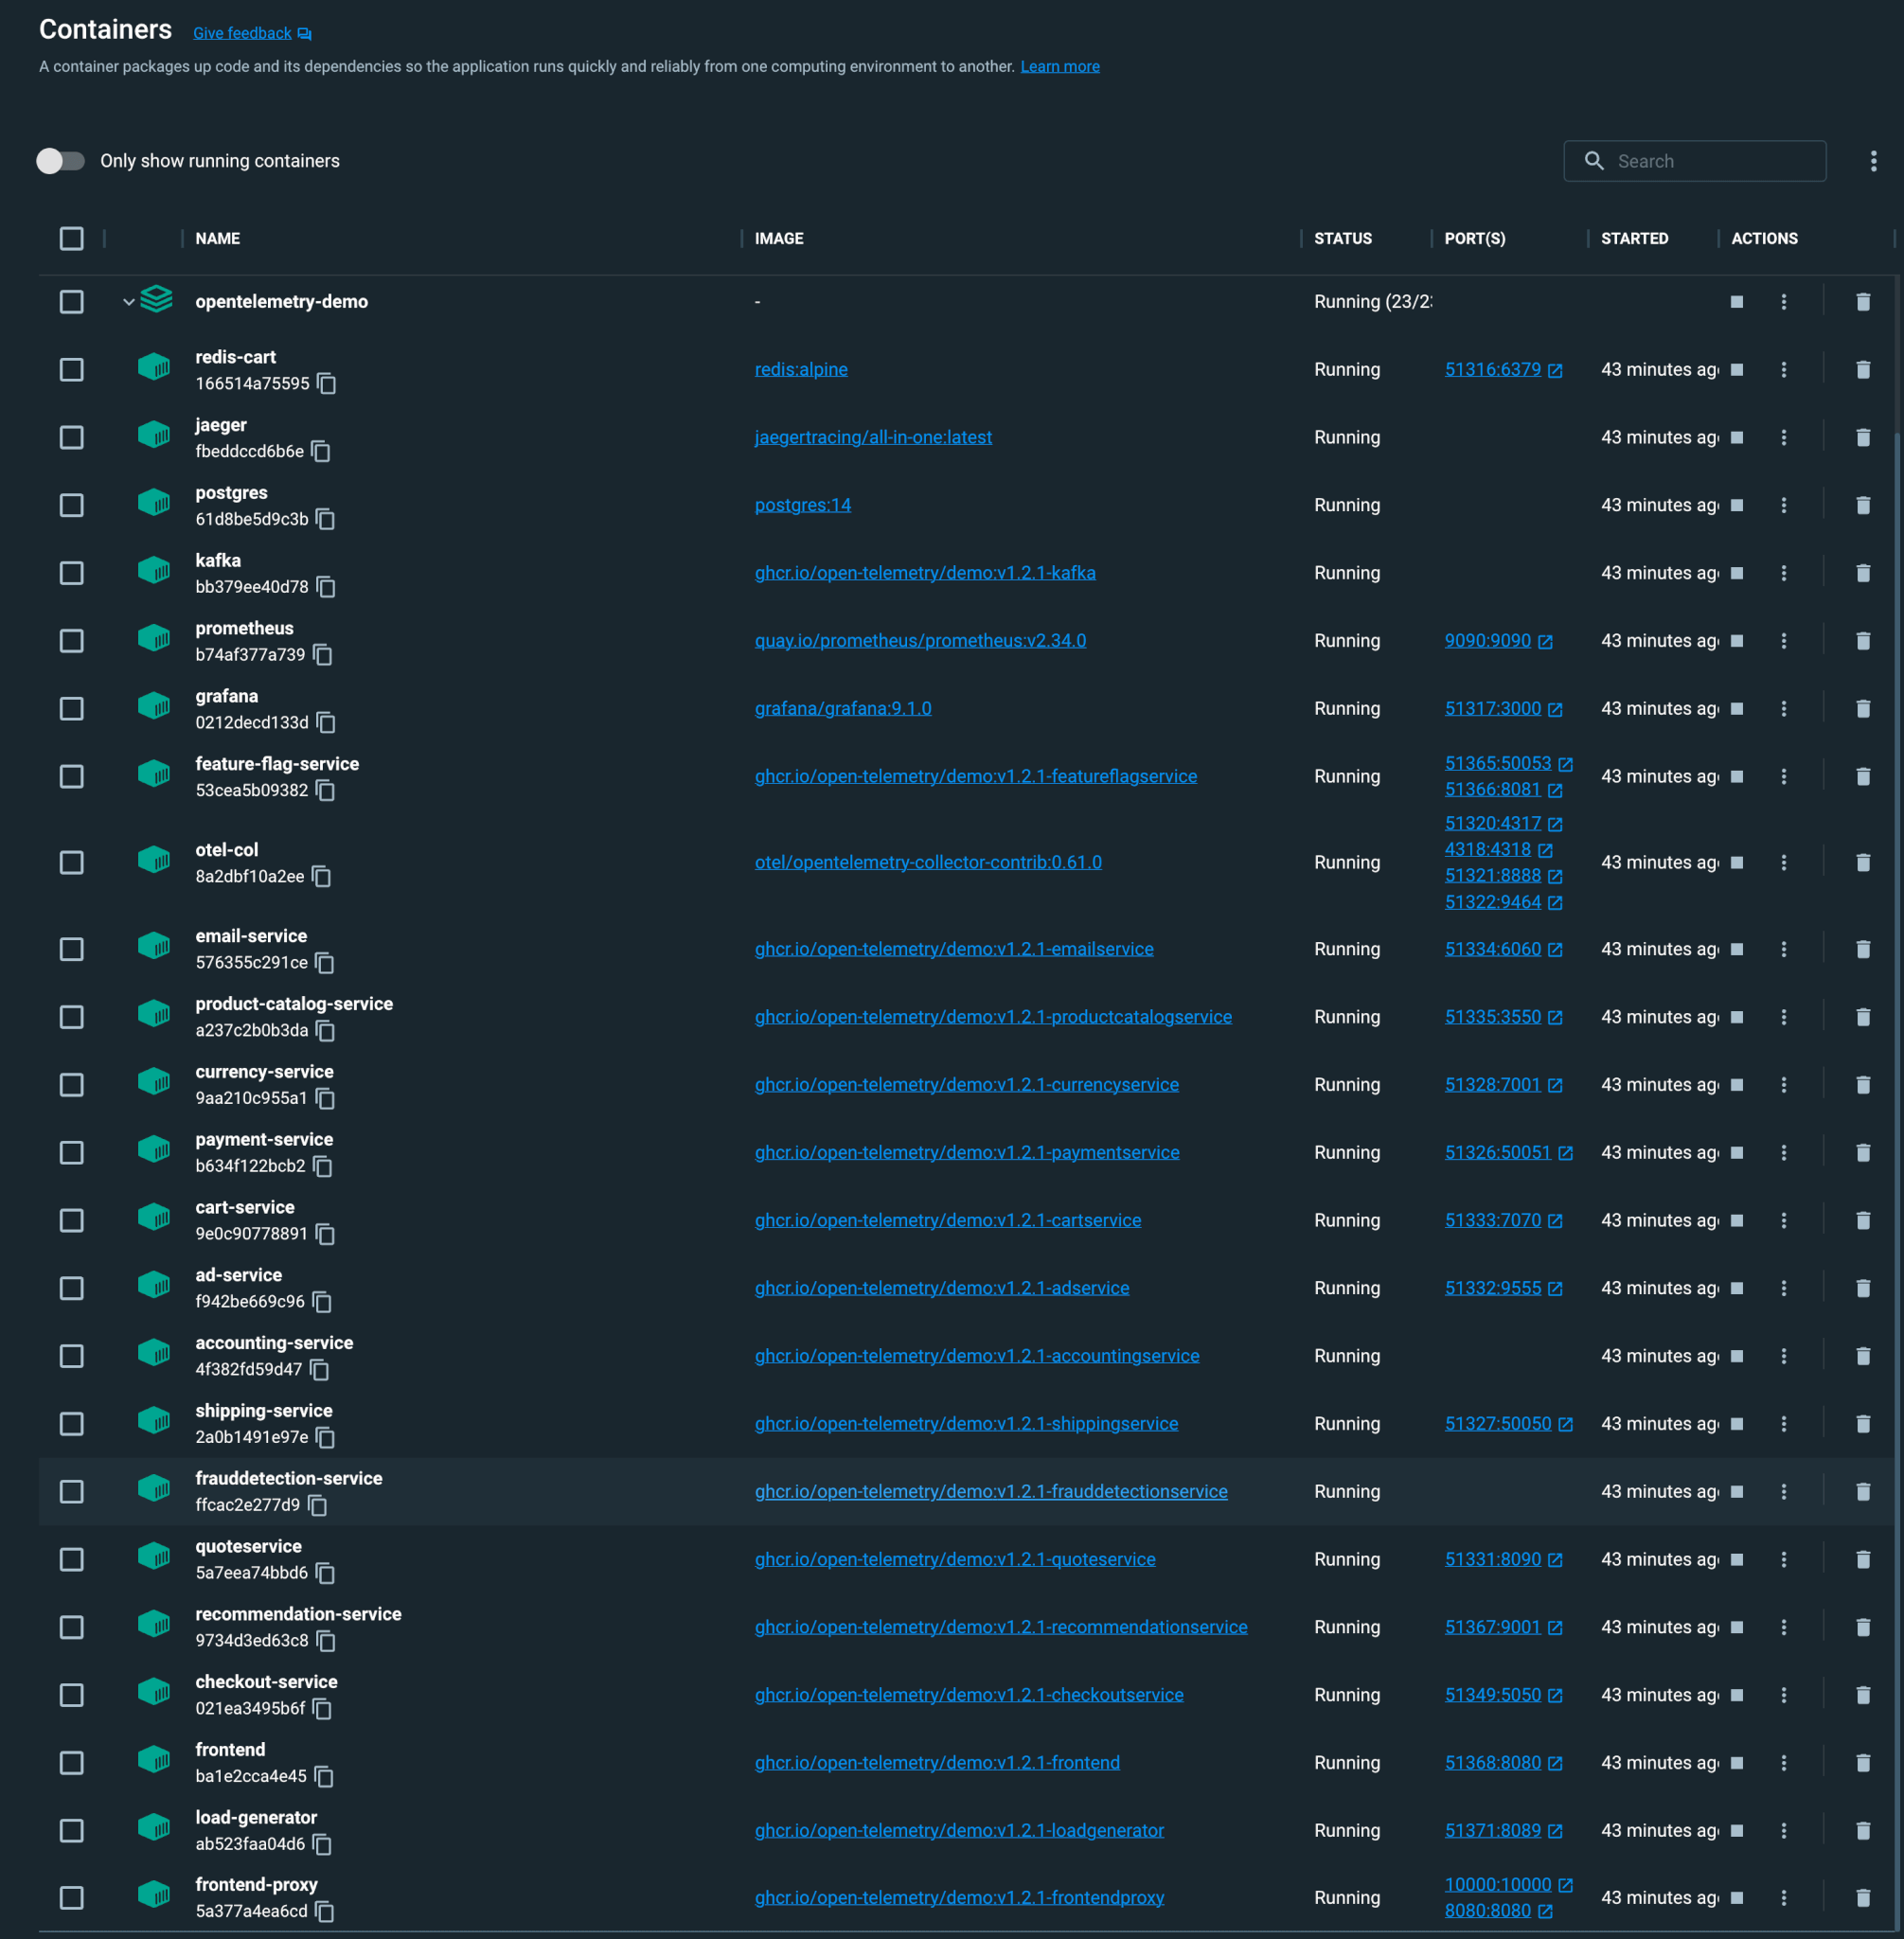
- Here is what your Docker desktop dashboard should look like:
STEP 5 – Welcome to the Webstore!
- Once the images are built and containers are started you can access the webstore at the following URL: https://localhost:8080/.
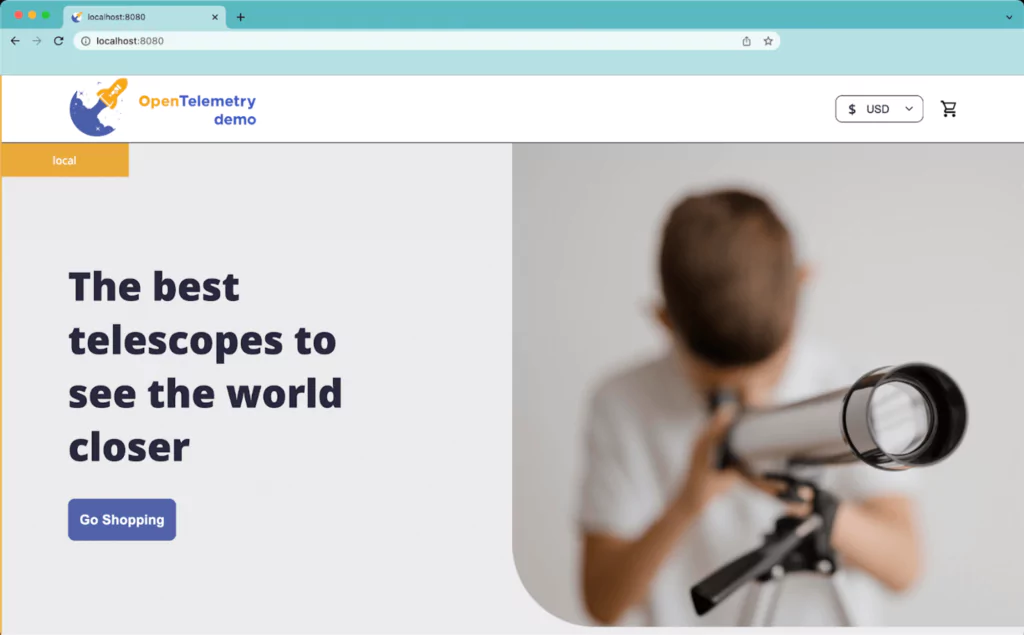
- By default, there is a load generator that simulates 10 users using the webstore. Join them – browse, check out and purchase products on the site! You can view stats on this service at the URL: https://localhost:51371/.
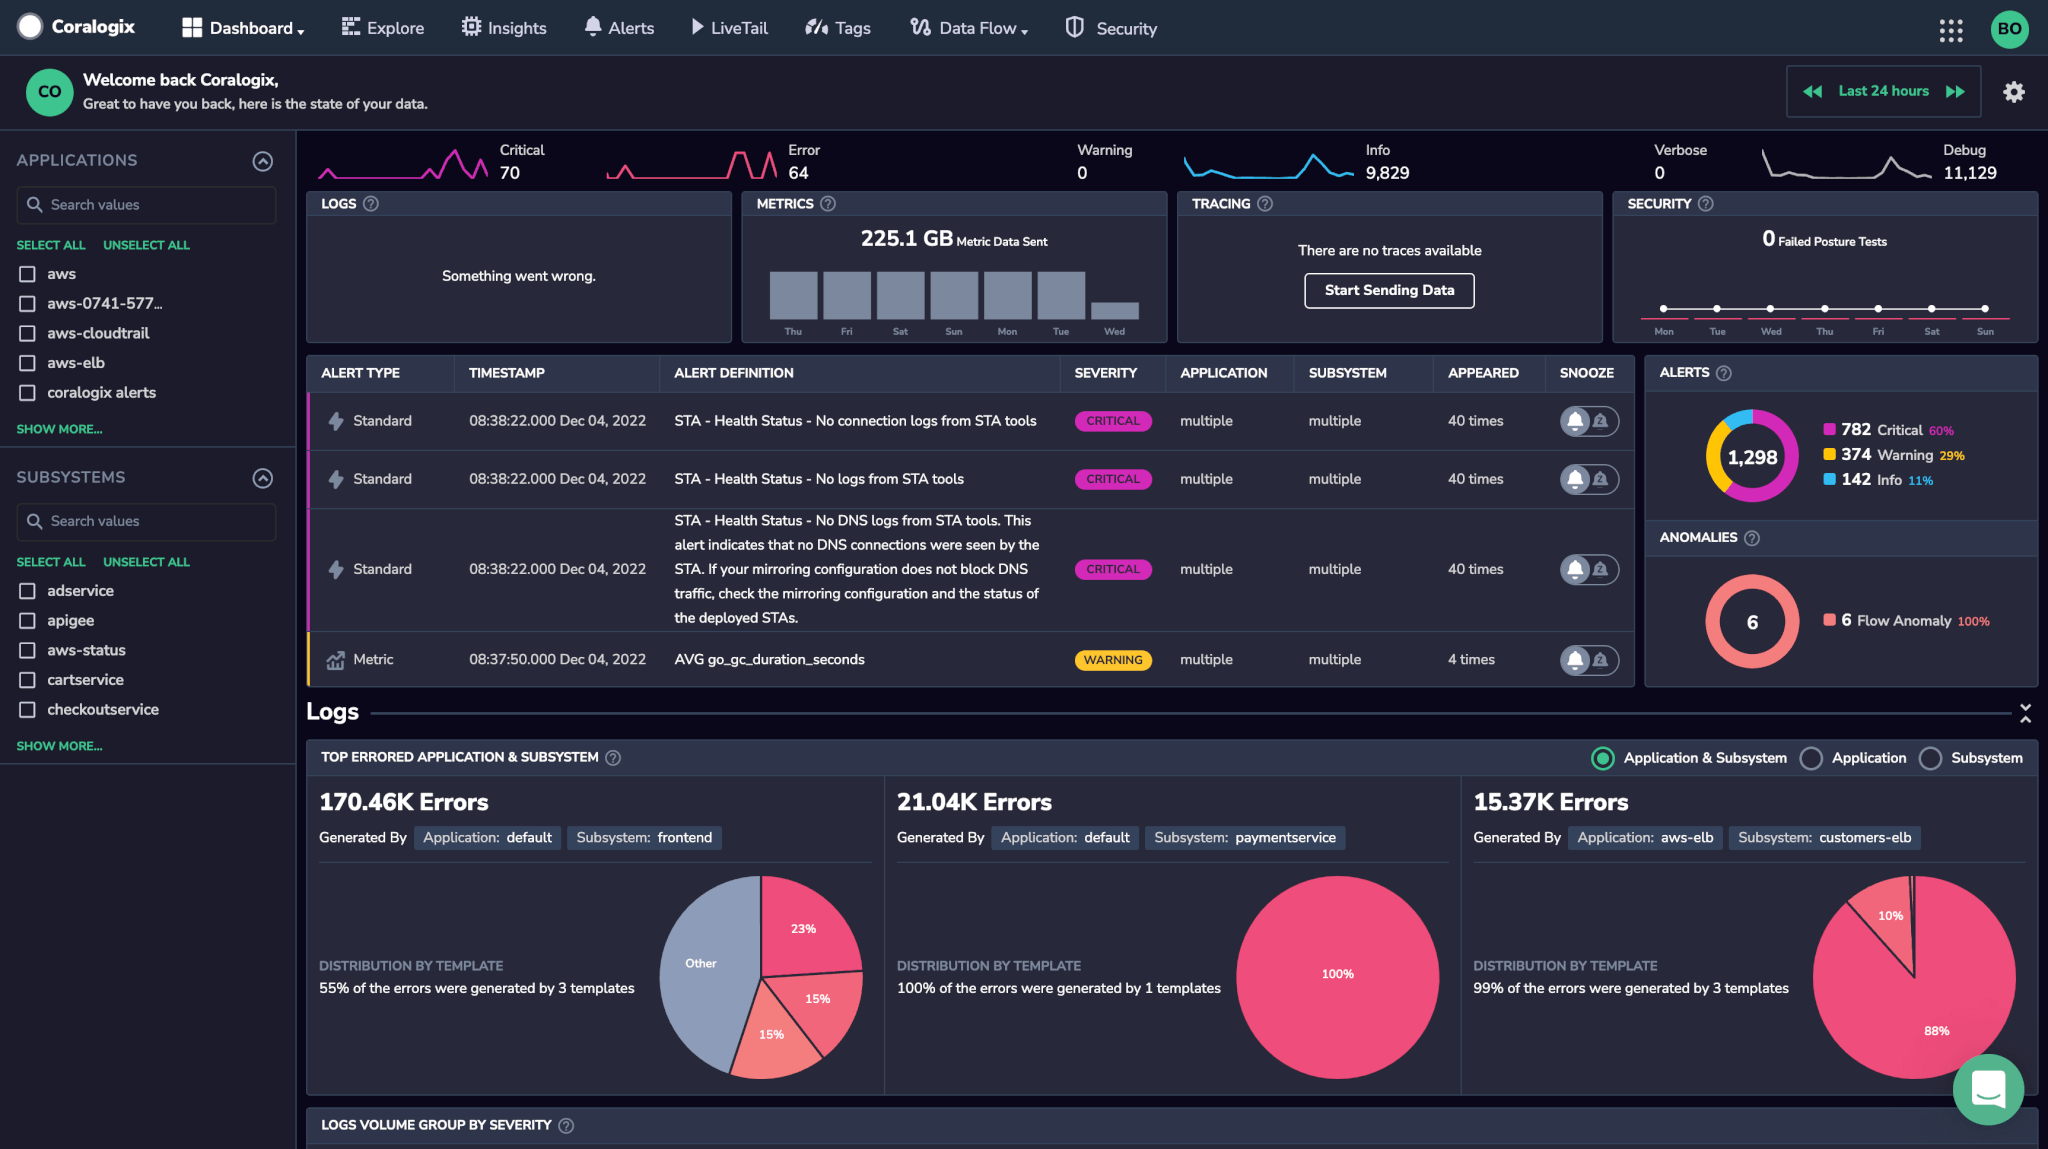
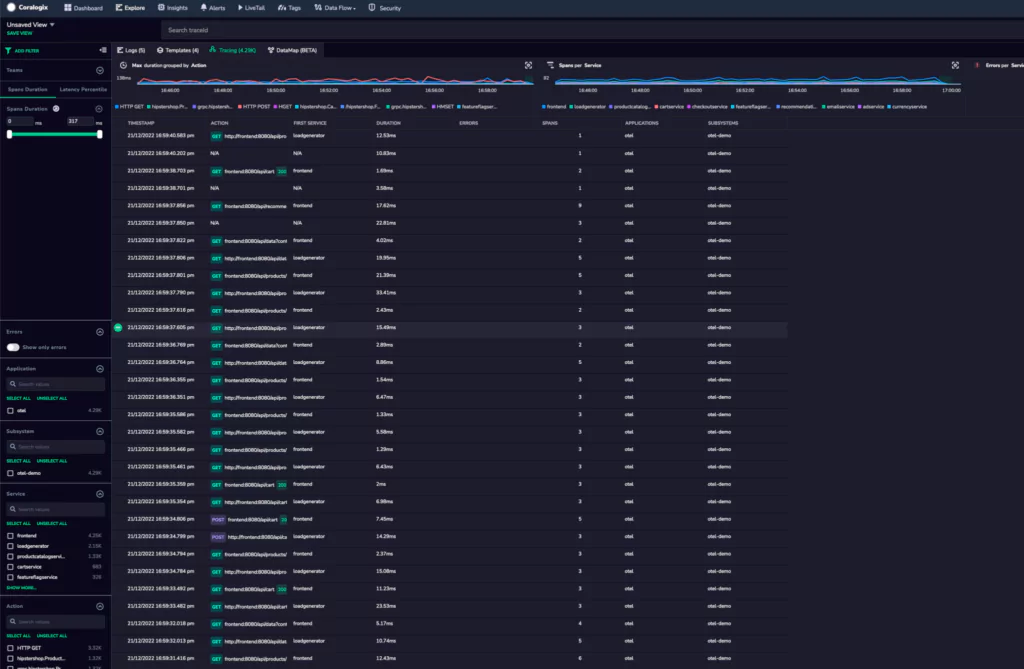
STEP 6 – View your telemetry data on your Coralogix dashboard
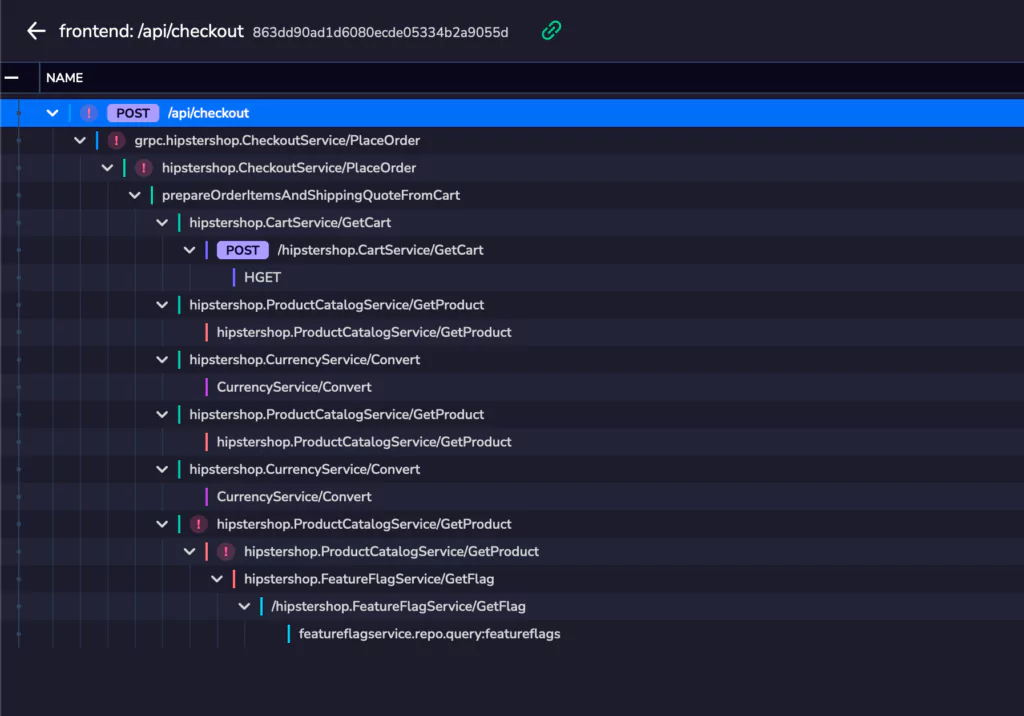
- View the traces generated by the project on Coralogix dashboard.
Explore tab > Tracing
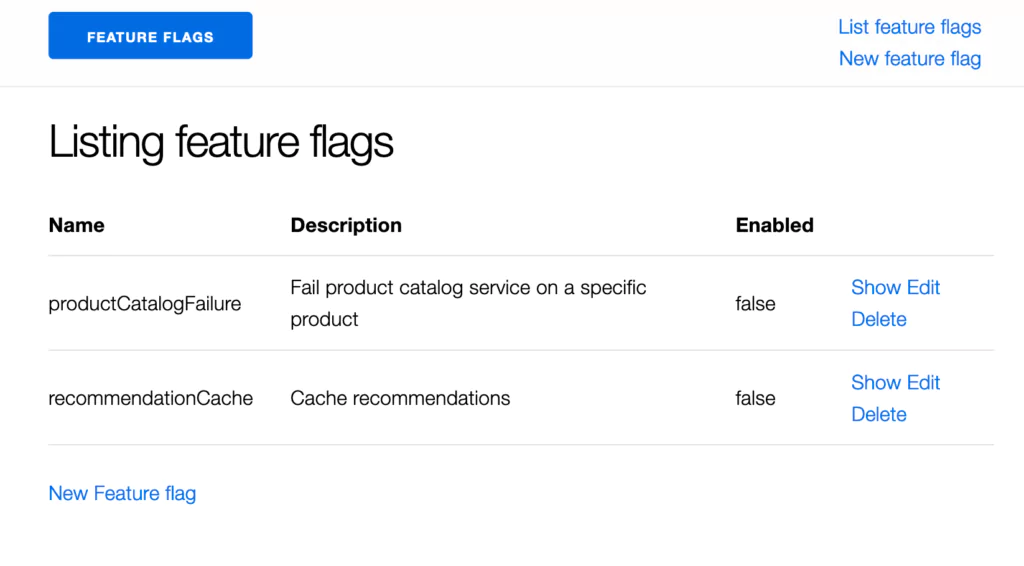
- The OTel Demo has Feature Flags that you can enable to introduce errors into the environment, these flags can be accessed here: https://localhost:8080/feature/featureflags.
- Click on one of these traces in your dashboard to view in greater detail.
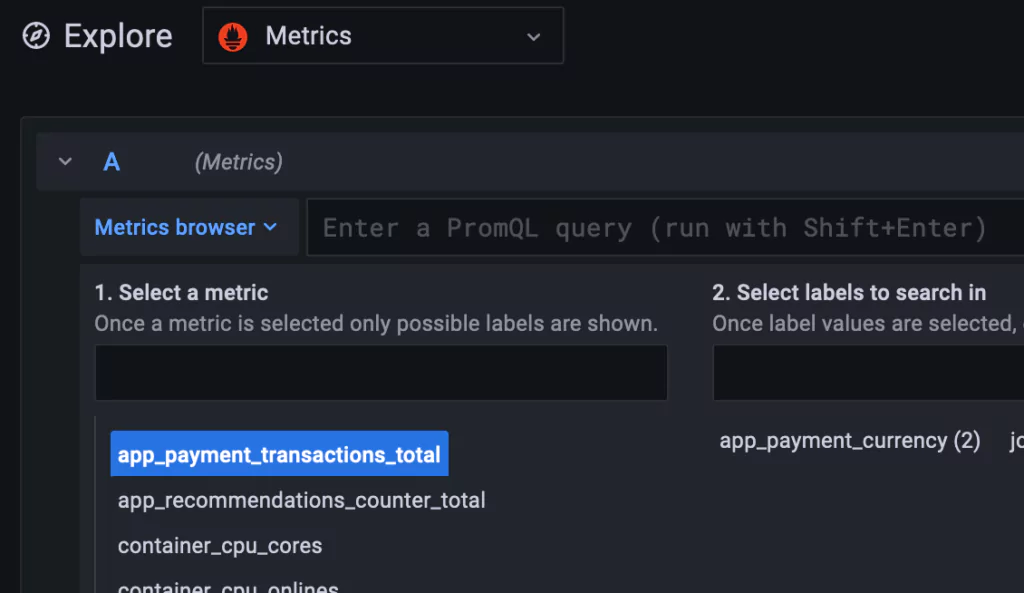
- View the metrics generated by the project accessing Coralogix-hosted Grafana
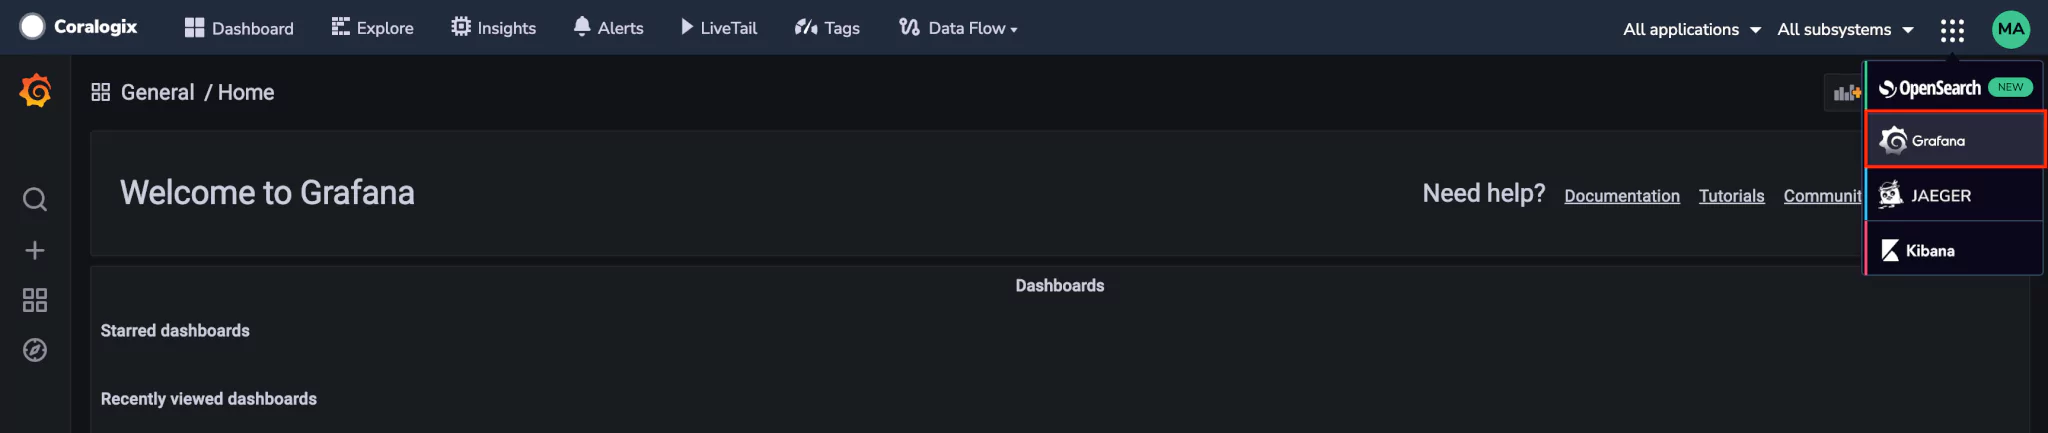
Grafana in the dropdown menu > Select a metric
OTel and Coralogix
The OpenTelemetry Community Demo application is an exciting tool for getting to know OpenTelemetry and its instrumentation best practices. In this blog, we showed how to configure the Demo App to send telemetry data to Coralogix in 6 easy, straightforward steps.
Interested in learning more?
- Dive into our more advanced OTel Demo tutorial: Tail Sampling with Coralogix and OpenTelemetry
- Review the OTel documentation on the Coralogix site
- Check out our awesome, instructional OTel videos
- Here’s a video on how to integrate traces into Coralogix using OpenTelemetry, Kubernetes & Helm
- Here’s another on capturing Kubernetes logs, transform with Logs2Metrics, and render with DataMap
- Contact us! Our world-class customer success team is available 24/7 to walk you through your setup and answer any questions that may come up. Feel free to reach out to us via our in-app chat or by sending us an email at [email protected].