Coralogix vs Cloudwatch: Support, Pricing, Features & More
Cloudwatch is a standard component for any AWS user, with tight integrations into every AWS service. While Cloudwatch initially seems like a cost-effective solution, its lack of functionality and flexibility can result in higher costs. Let’s explore Coralogix vs Cloudwatch.
Summary: Coralogix vs. Cloudwatch
| Feature | Coralogix | Cloudwatch |
| Logs, Metrics & Traces | ✅ | ✅ |
| Alerting | ✅ | ✅ |
| Machine Learning Capabilities | ✅ | ✅ |
| Pricing Model | ✅ Unified Pricing around a Single Unit | ❌ Multiple Pricing Plans based on data type, service, volume, retention, and more |
| Cost per GB Ingested | ✅ Logs: $0.17 – $1.50Metrics: $0.05Traces: $0.75 | ❌ N/A |
| Cost Optimization Toolkit | ✅ | ❌ |
| SIEM & CSPM | ✅ | ❌(CSPM via AWS Security Hub) |
| Remote Archiving | ✅ | ✅With delays of up to 12 hours. |
| Remote Archive Query | ✅ | ❌ |
| Schema on Read & Schema on Write | ✅ | ❌ |
| Support | ✅ All customers get 24/7 support, with 15-second median response times | ❌ Enterprise customers get 15 minute response times for total system outages. |
| Kubernetes Dashboards | ✅ | ✅ Generic functionality available via Cloudwatch Container Insights |
| Serverless Dashboards | ✅ | ✅ |
Logs, metrics, traces, and alerting
Both Coralogix and Cloudwatch offer support for logs, metrics, and traces. A key distinction, however, is that Cloudwatch requires either Cloudwatch specific SDKs to ingest data, with additional features like AWS X-Ray, or the Amazon Distribution for OpenTelemetry (ADOT) distribution.
Coralogix integrates cleanly with any OpenTelemetry distribution because we contribute directly to the repository and offer our exporter.
Data correlation and usability
Cloudwatch famously suffers from a poor user experience. Even with the addition of Cloudwatch Insights (which comes at a cost per query), Cloudwatch still lags behind the rest of the observability market. In comparison, Coralogix seamlessly integrates all customer data into a single, cohesive story that shortens troubleshooting time and speeds up MTTR.
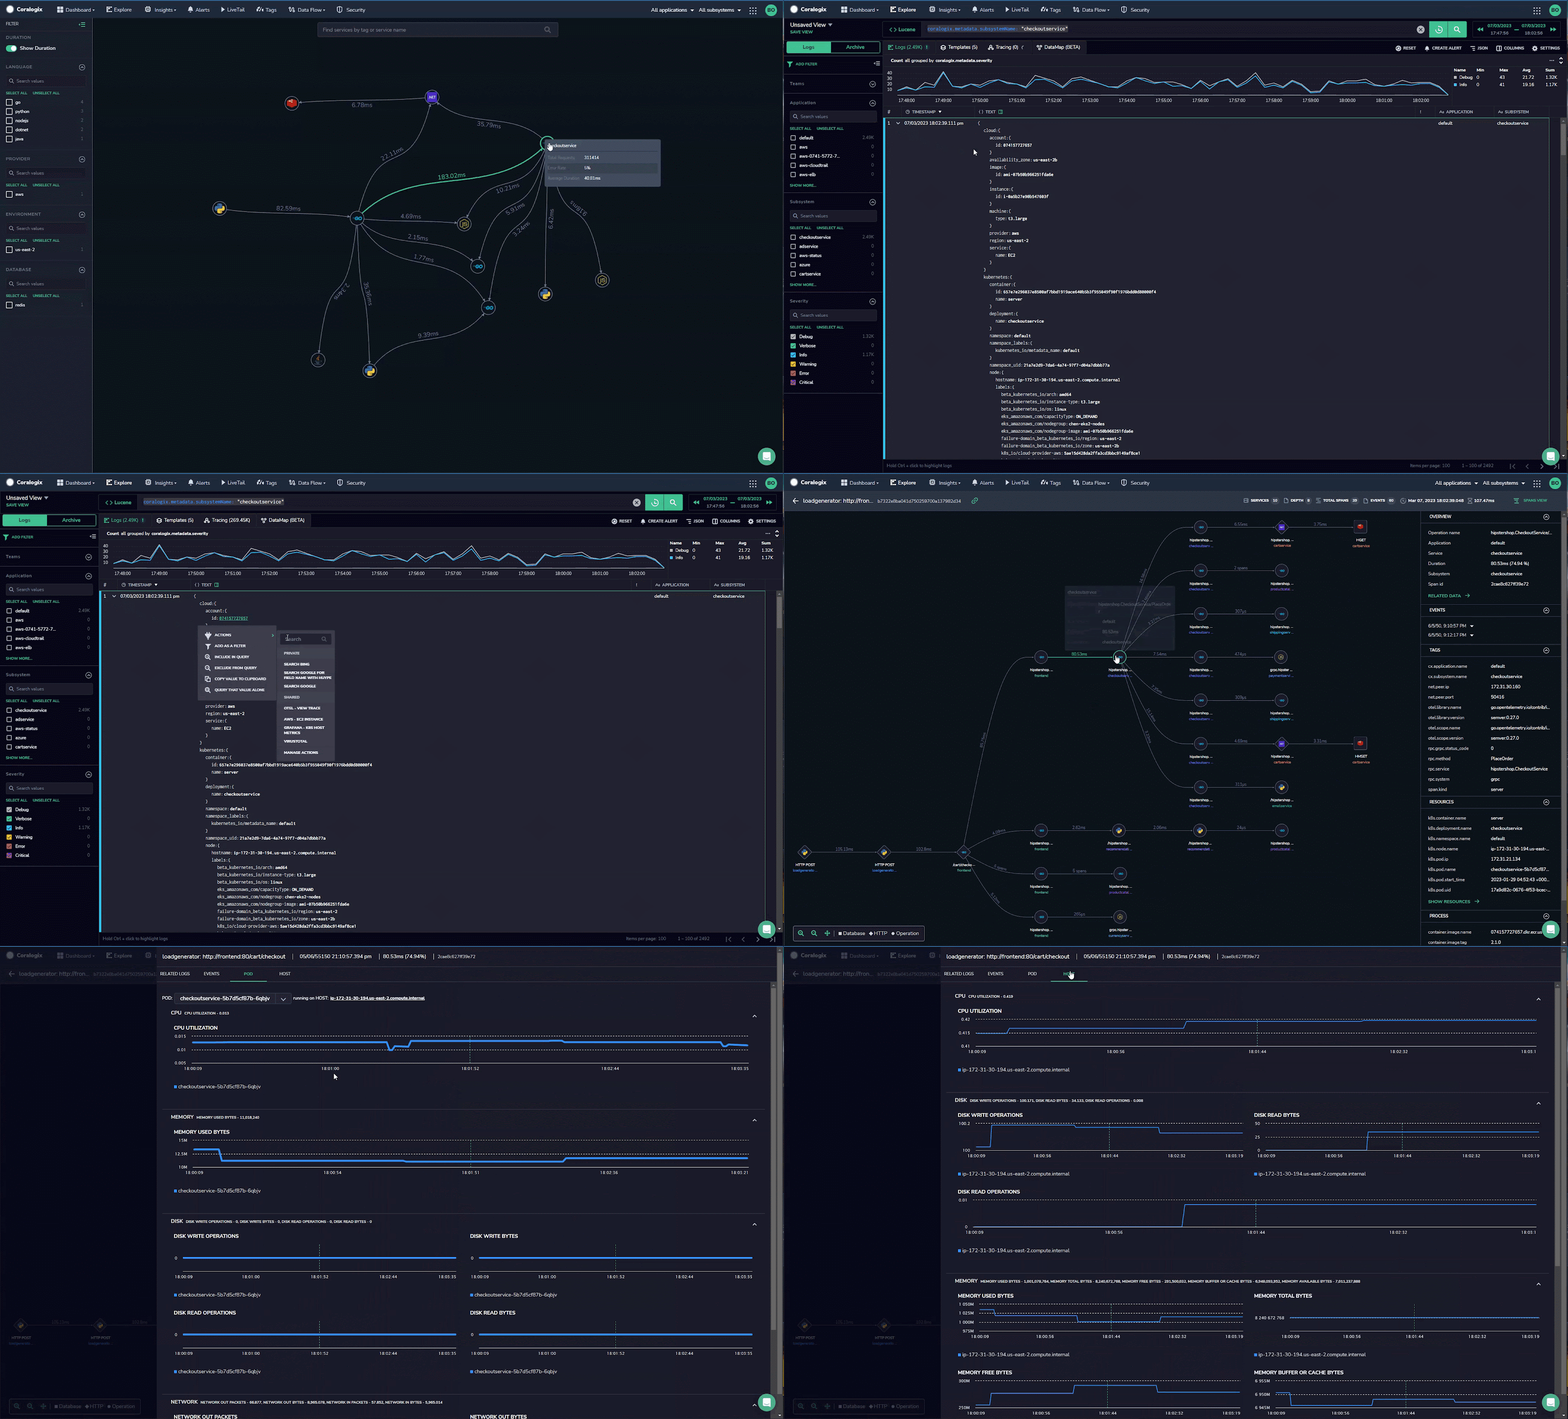
Coralogix Flow Alerts
Coralogix alerting has unique features like Coralogix Flow Alerts, which allow users to orchestrate their logs, metrics, traces, and security data into a single alert that tracks multiple events over time. Using Flow Alerts, customers can track the change in their system.
Machine Learning capabilities
Both Coralogix and Cloudwatch make use of machine-learning capabilities for anomaly detection. This makes for a powerful safety net when your traditional alerts have not picked up on an unexpected issue. This allows customers of both platforms to deal with “unknown-unknowns” effectively.
Coralogix Loggregation – Another Dimension of AIOps
Coralogix Loggregation is another unique feature in the Coralogix toolkit. Loggregation will automatically cluster similar logs together, to form a “template.” This functionality allows users to understand which logs are noisiest and accounting for the most errors and more.
Cloudwatch does not offer a competitive alternative to this feature, and suffers from the same problems that traditional systems do when dealing with large volumes of data.
Archiving and Archive Query
Both Cloudwatch and Coralogix support exporting logs from an indexed view into an S3 archive, however, the archive in Cloudwatch is not as fully featured. It is more commonly used as a bridge between multiple Amazon services, rather than a viable long-term storage solution.
All Coralogix customers, regardless of ingestion amounts, can remotely archive their data into S3. Since Coralogix does not tier its solution, customers who ingest their data into the platform gain immediate access to every single feature.
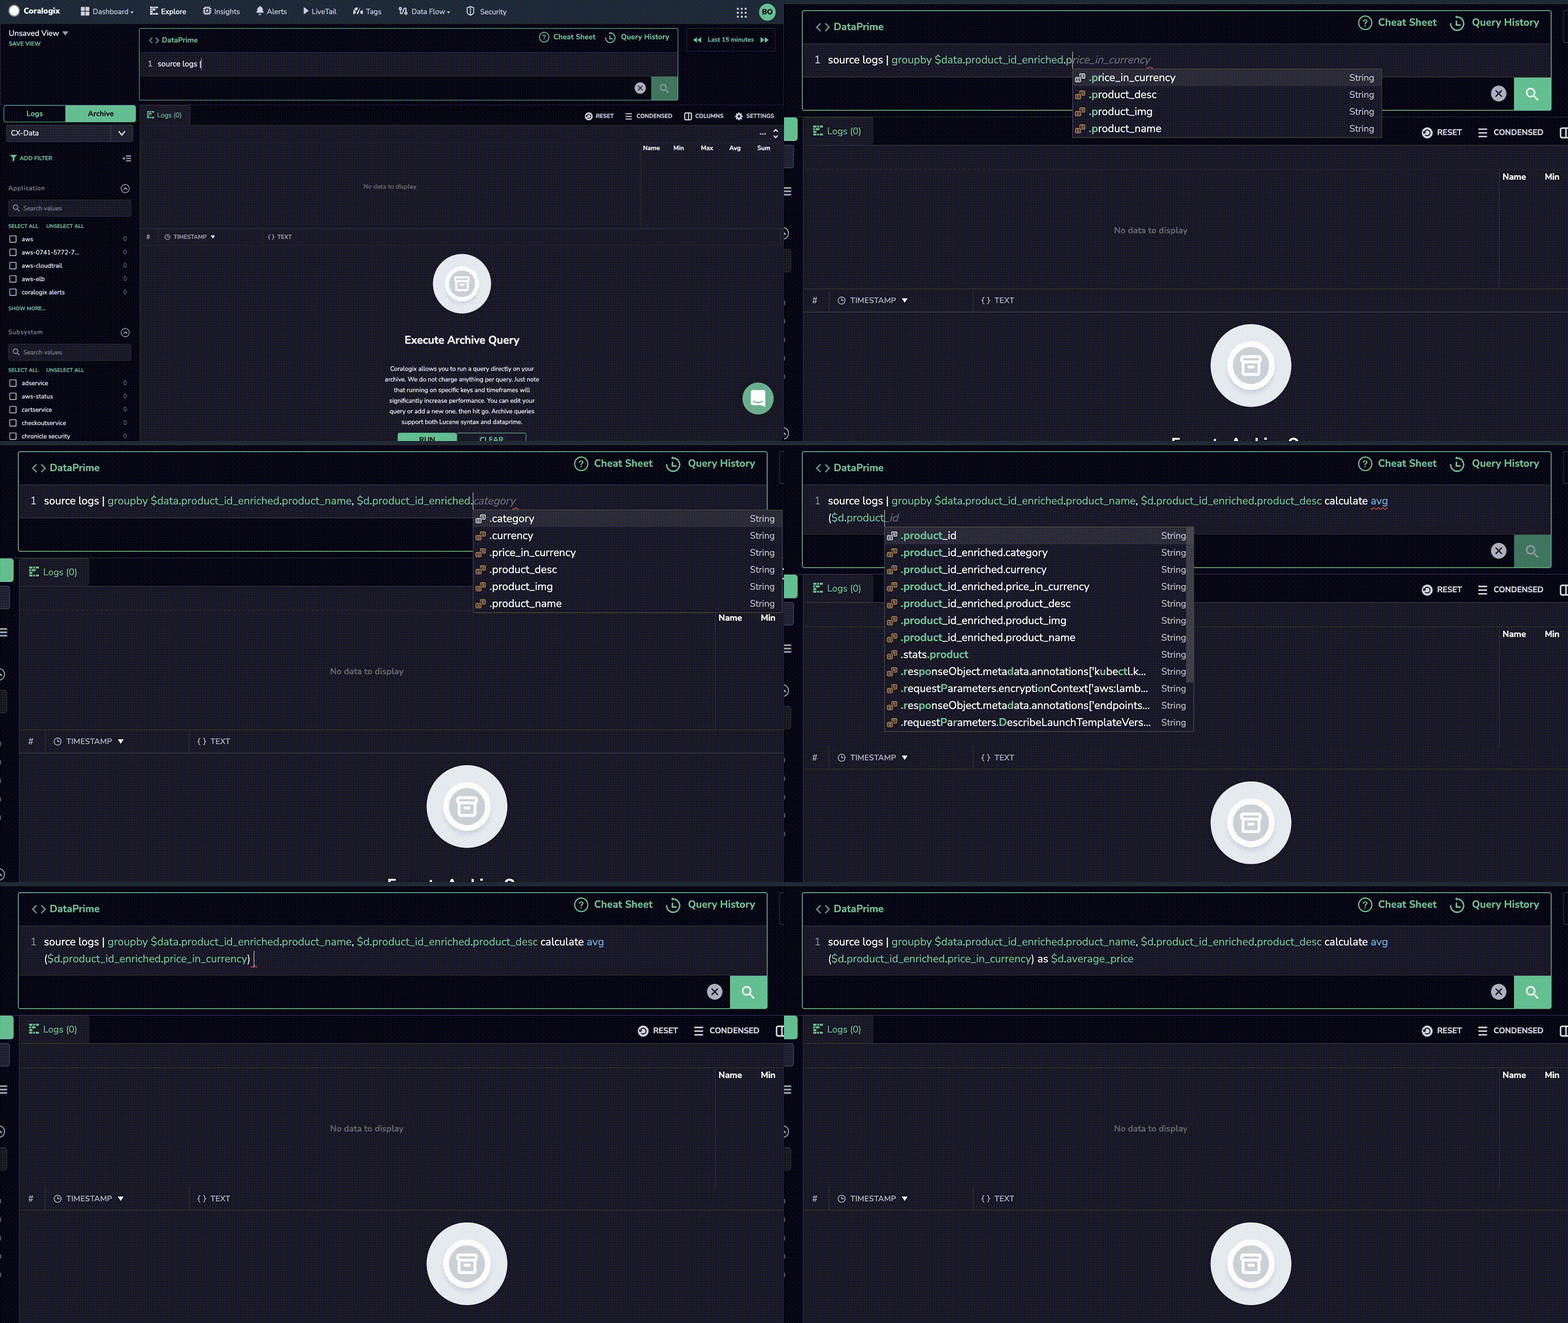
Furthermore, with the Coralogix platform, you can perform remote queries in seconds on archived, unindexed data. Cloudwatch does not offer this feature, and instead relies on its customers to perform the necessary engineering work to join together Amazon Athena, AWS S3, and more. All of this comes at an added cost.
Cost optimizations
- Coralogix: Coralogix users start by indexing the majority of their data, but over time, they tend to transfer more data to the archive. This is because it can be queried in seconds, at no additional cost.
This functionality means customers can store the majority of their data in S3, and pay at most $0.004 / GB for storage. Coupled with the Compliance ingest costs in Coralogix, $0.17 / GB, the GB cost for ingest and storage is $0.174 / GB for the first month.
- Cloudwatch: Cloudwatch advises customers to delete unused resources in order to save cost. This is standard practice across all tools, but is an indication of how little automated support there is for lowering monthly operational cost for observability data.
Coralogix doesn’t charge by cloud resources, but by ingestion volume. More than that, Coralogix allows customers to assign use cases to traces and logs, which drive instant cost savings via the TCO Optimizer. These decisions are flexible and reversible, and entirely risk-free.
Pricing model
The Coralogix pricing model is based entirely on GB ingested with no solution tiering or extra costs for features, making it easy for new customers to predict their costs. In comparison, the Cloudwatch offering is based on a different price per service and data type, meaning it’s going to be very difficult to work out precisely how much you will spend.
Customer support
Cloudwatch support is wrapped up in standard AWS support. This support is broken down by severity and the service tier that the customer has paid for. Their response times vary from 12 hours to 15 minutes for a serious incident, depending on service tier.
Coralogix offers all customers a median 30-second response time, an SLA measured in minutes, and 24/7 support. Coralogix also offers a median resolution time of 43 minutes. Even with the most complete support that Cloudwatch offers, they are acknowledging issues only 25 minutes faster than Coralogix is resolving them.
Out-of-the-box dashboards
Cloudwatch does not bring much in the way of prebuilt dashboards. It has a few solutions targeted towards specific technology, like Container Insights, but it is mostly a task of building your own dashboards. These dashboards also come at a cost of $3.00 per month per dashboard.
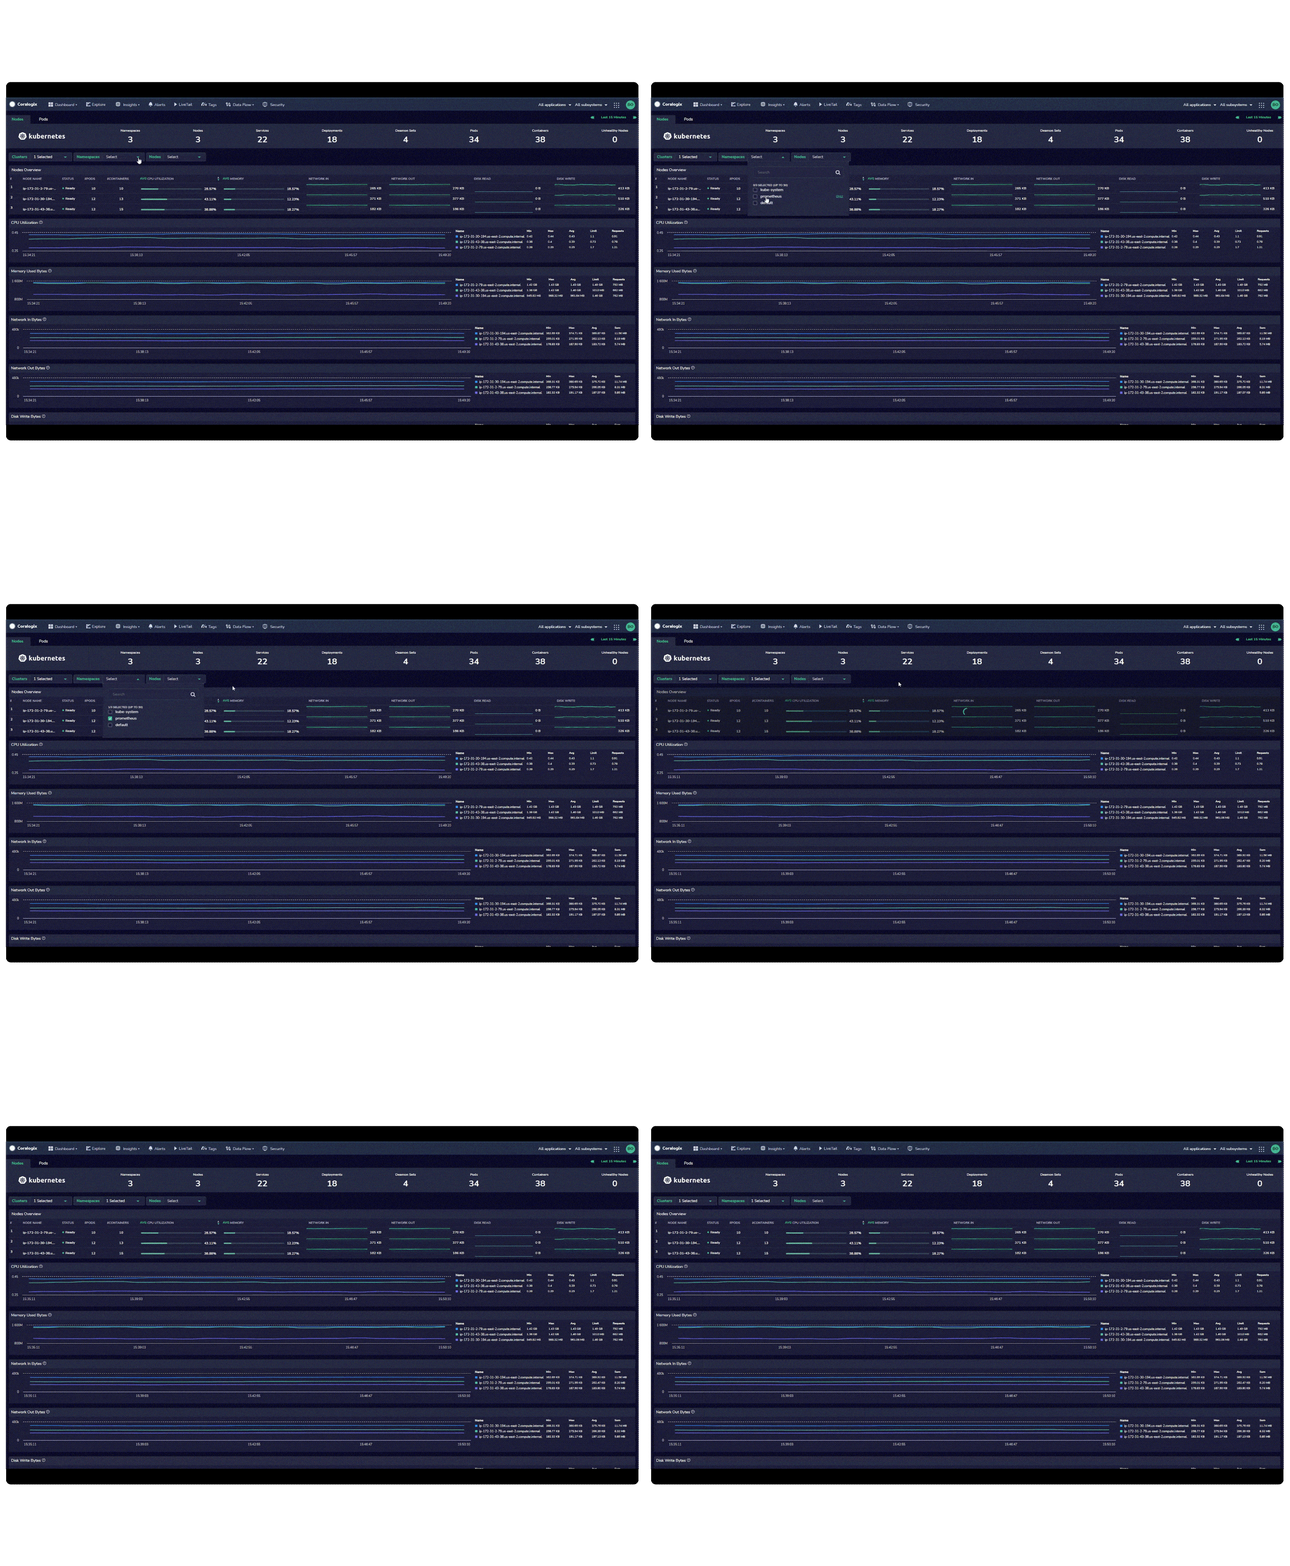
Coralogix has built dashboards for Kubernetes Monitoring, Serverless monitoring, and more, while also supporting open-source dashboarding solutions like Grafana. Coralogix also provides a custom dashboarding solution for Coralogix users. The platform’s reuse of open-source dashboards, like JSON definitions for Grafana, and the time-to-value of premade dashboards make its offerings the best of both worlds, while charging absolutely nothing extra for their use.
All in all…
While Cloudwatch enjoys tight integrations into all major AWS services, its poor user experience, lack of feature depth, complex pricing model, and lack of effective cost-optimization means it falls behind when compared to the features available in the Coralogix platform.


