The new standard of observability is here. Discover Olly, the industry’s first
Dynamic Bad Actor Scoring in Coralogix

Bad bots, hackers, and other malicious agents can be tracked by a huge volume of metrics – session activity, HTTP headers, response times, request volume & cadence, and more. This complexity has created a market for siloed, complex, and extremely expensive tools. In contrast, Coralogix can consume simplistic data, like CDN logs, and derive complex, dynamically changing scores. When coupled with built-in cost optimization and the wider platform features, this makes a very compelling case.
How do you detect a bad actor?
While the individual factors will be unique to a company, there are some very common assessments that almost all companies can utilize, for example:
- Does the HTTP User-Agent header match a known Bot signature?
- Is the user performing requests/actions far more quickly than a normal user?
- Are the user’s mouse movements unnatural, i.e., is the mouse jumping from place to place instead of moving around?
- Has the user scanned any known attack vector endpoints, for example, making GET requests to /.env
While these checks are ubiquitous, the issue for companies is simple: very few solutions exist that will correlate activity in the browser, with Firewall and CDN activity, to create a complete picture of a user session.
The power of the Coralogix platform
Observability, when coupled with the right architecture and feature set, is a powerful solution to common security challenges. Let’s explore how Bot Scoring works in Coralogix.
The data
Coralogix assesses user behavior from multiple dimensions by correlating data sources that would otherwise be completely disconnected:
- Browser activity using the Coralogix RUM SDK.
- Web Traffic activity via well-known CDNs like Cloudfront, Fastly, and so on.
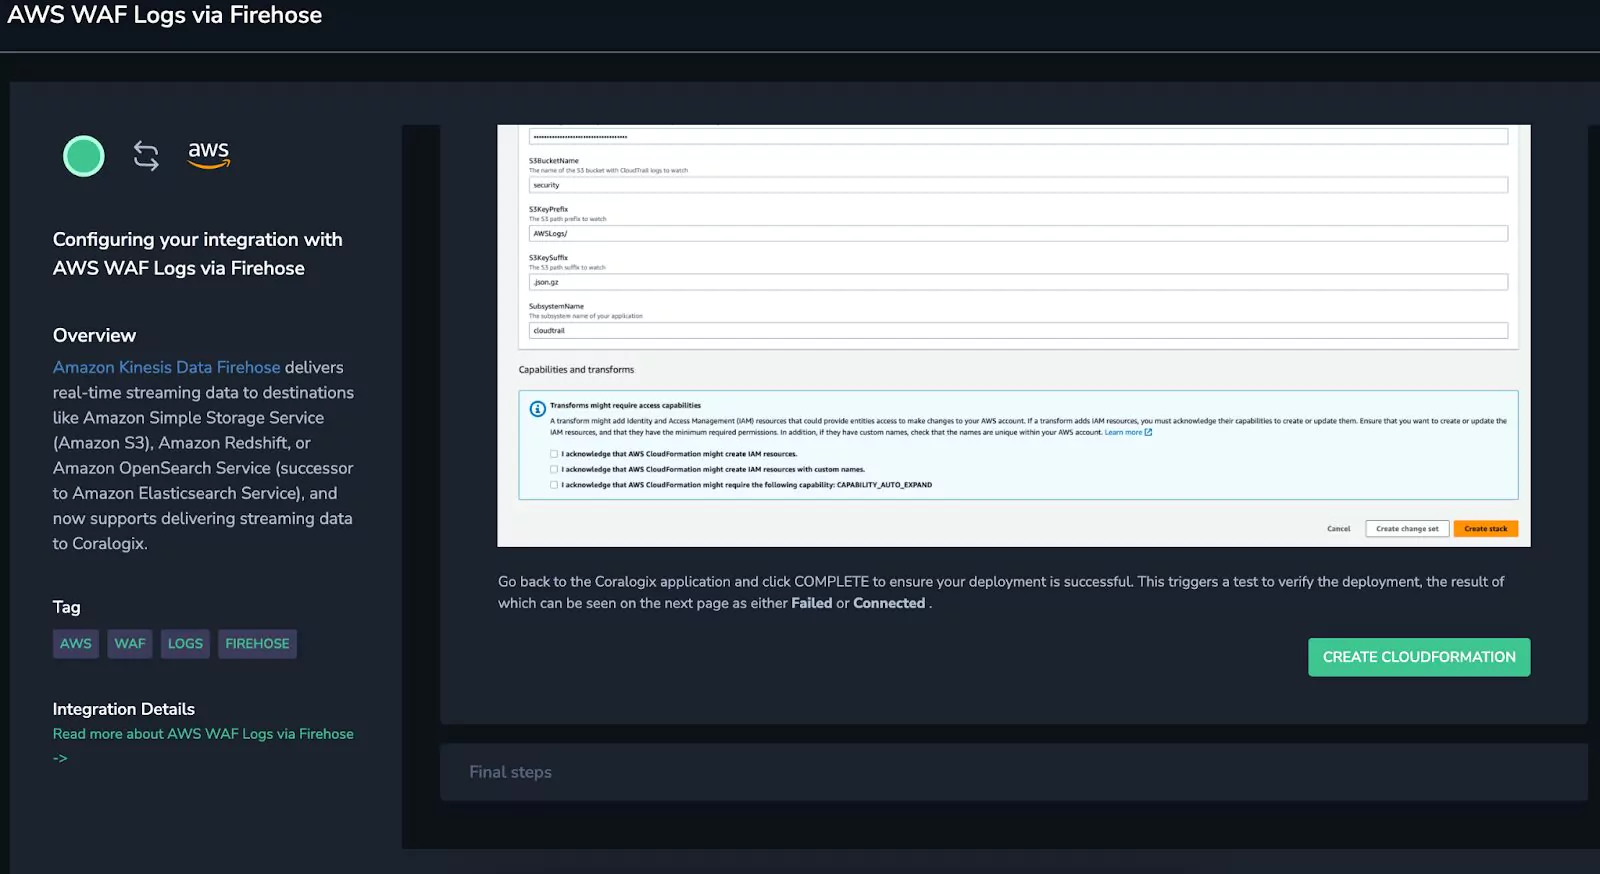
- Firewall activity via common tools like AWS WAF & Fortinet.
The method
First, integrating all of this data was a simple matter of clicking through Coralogix’s guided integrations. This three-click process deployed CloudFormation stacks into an AWS account, and data immediately began to flow.
Once the data was ingested into Coralogix, it was time to optimize observability costs, by defining Coralogix TCO Optimizer rules. These rules are extremely important for this kind of data. CDN and RUM data is very noisy, potentially spiking costs without driving equivalent return on investment. Using the TCO Optimizer, Coralogix customers can define use cases and declare how valuable every log is.
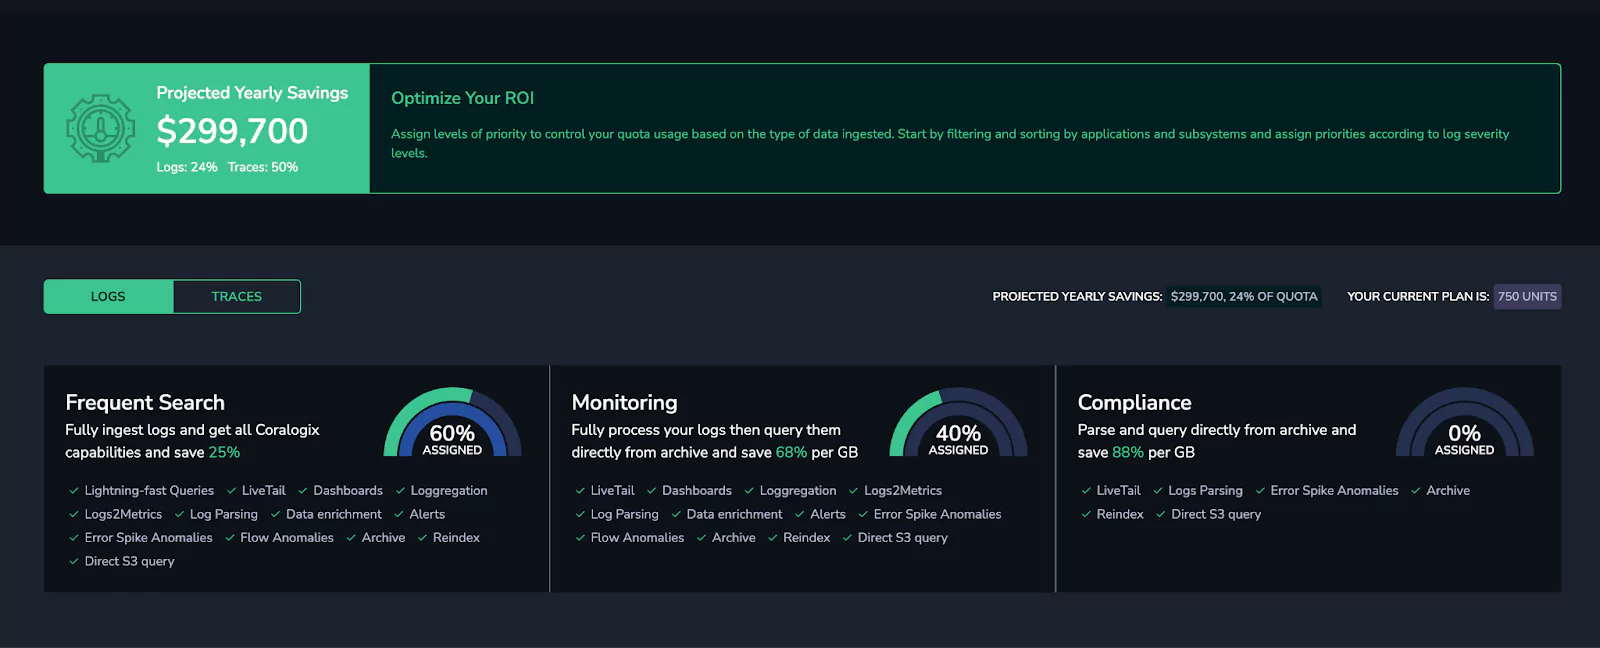
Here, we were able to allocate a huge volume of our data (all RUM & CDN logs) to the monitoring level, which uses 70% less quota, effectively allowing users to ingest triple the volume for the same cost.
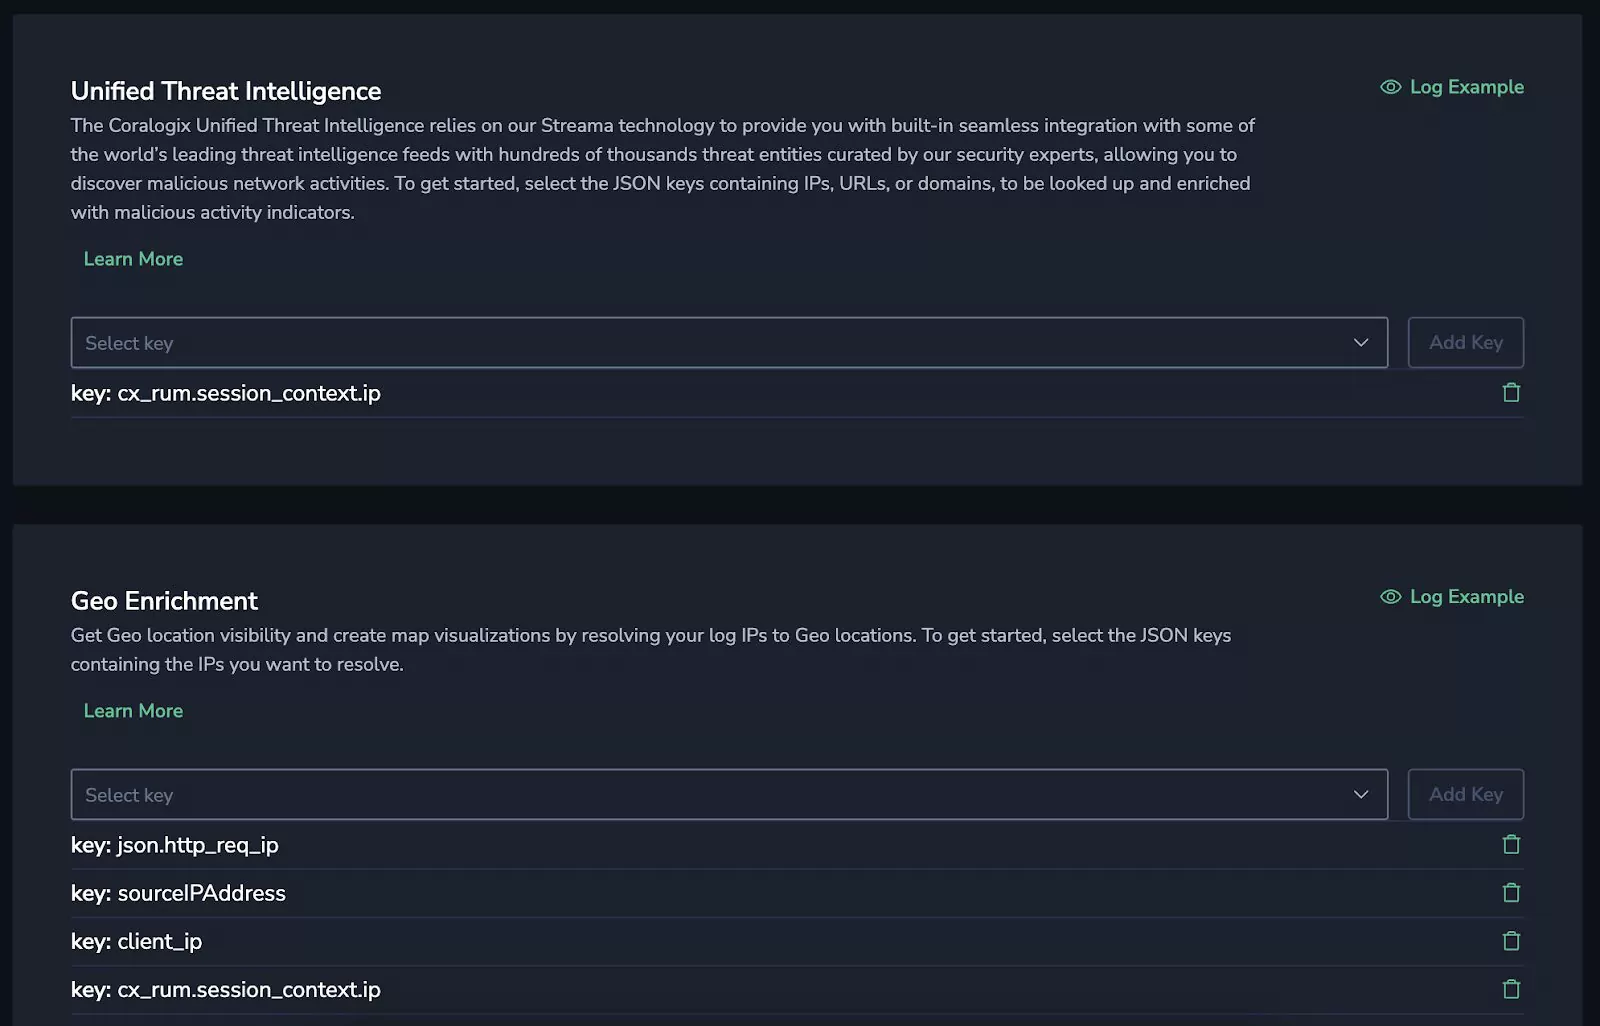
From here, we then enriched our data, using some key information:
- Unified Threat Intelligence – This feed automatically scans IP addresses and domains in logs and decorates them with any threat intelligence information available in the top 15 threat databases.
- Geo Enrichment – Automatically add country, continent, region, latitude and longitude, and more, based on nothing more than an IP address.
This meant our logs now contained some extremely important information. User location and IP reputation are two vital measurements for bad actor detection.
Then, we began generating our metrics. Coralogix supports Events2Metrics, meaning logs that would typically be expensive to hold in high performance, indexed storage for a long time, are converted into metrics, which can be held for a long time (by default, one year) and queried quickly, without the associated costs. Here are just a few of the metrics we generated:
- CX_RUM_Bot_User_Agent_Traffic – Track CDN traffic with a user agent that matches a known bot pattern.
- CX_CF_Suspected_Country – Hacks tend to come from well-known countries. While all users from these countries will not be malicious, it is another heuristic that can be considered.
- CX_CF_Suspected_Ip – Thanks to our data enrichment, we can now generate metrics based only on the IPs marked as suspicious and appearing in one of the top 15 threat databases.
- CX_CF_Suspected_Path – Malicious users tend to scan for common vulnerable paths, like .env or .git. If a user searches for these, it’s potentially a sign of nefarious activity.
- CX_RUM_Low_Recaptcha_Traffic – Users can pass reCaptcha scores via the Coralogix RUM integration. Users with a low score (<0.4) are subsequently tracked as possible bots.
- AWS_WAF_Bot_Blocked_Traffic_Metrics – If AWS WAF blocks a given IP address because a Bot ruleset has triggered, that IP activity is recorded. This is crucial, because we’re leveraging AWS WAF’s detection abilities too, extending our dataset dramatically.
Bringing it all together
This data comes from many different sources, but thanks to the power of Coralogix, it can all be put together and crunched into something tangible. In this case, a “Bad Actor” score is between 0 and 100. 0 indicates that the user has done nothing nefarious, and 100 indicates that they are definitely up to no good.
We did this using Coralogix Recording Rules and some basic PromQL:
clamp_max(sum(
clamp_max(round(max(cx_cf_suspected_country_cx_docs_total) by (ip)), 1) * 20 or on() vector(0),
clamp_max(round(max(cx_cf_suspected_ip_cx_docs_total) by (ip)), 1) * 40 or on() vector(0)
…
) by (ip), 100) > 0
This can be a little confusing to read, but essentially, it can be broken down like this:
- The score can not be higher than 100 (hence the clamp max at the start)
- The score is made up of a series of factors. If a factor is true (clamp_max of 1 means either 0 or 1) then it is multiplied by its weighting. For example, if a user comes from a suspected country, it counts as 20 points. If they have a suspected IP, it’s 40 points, and so on.
- These values are added together to form the score.
The result
Visualizing this data is very easy, now that the metrics are in place:
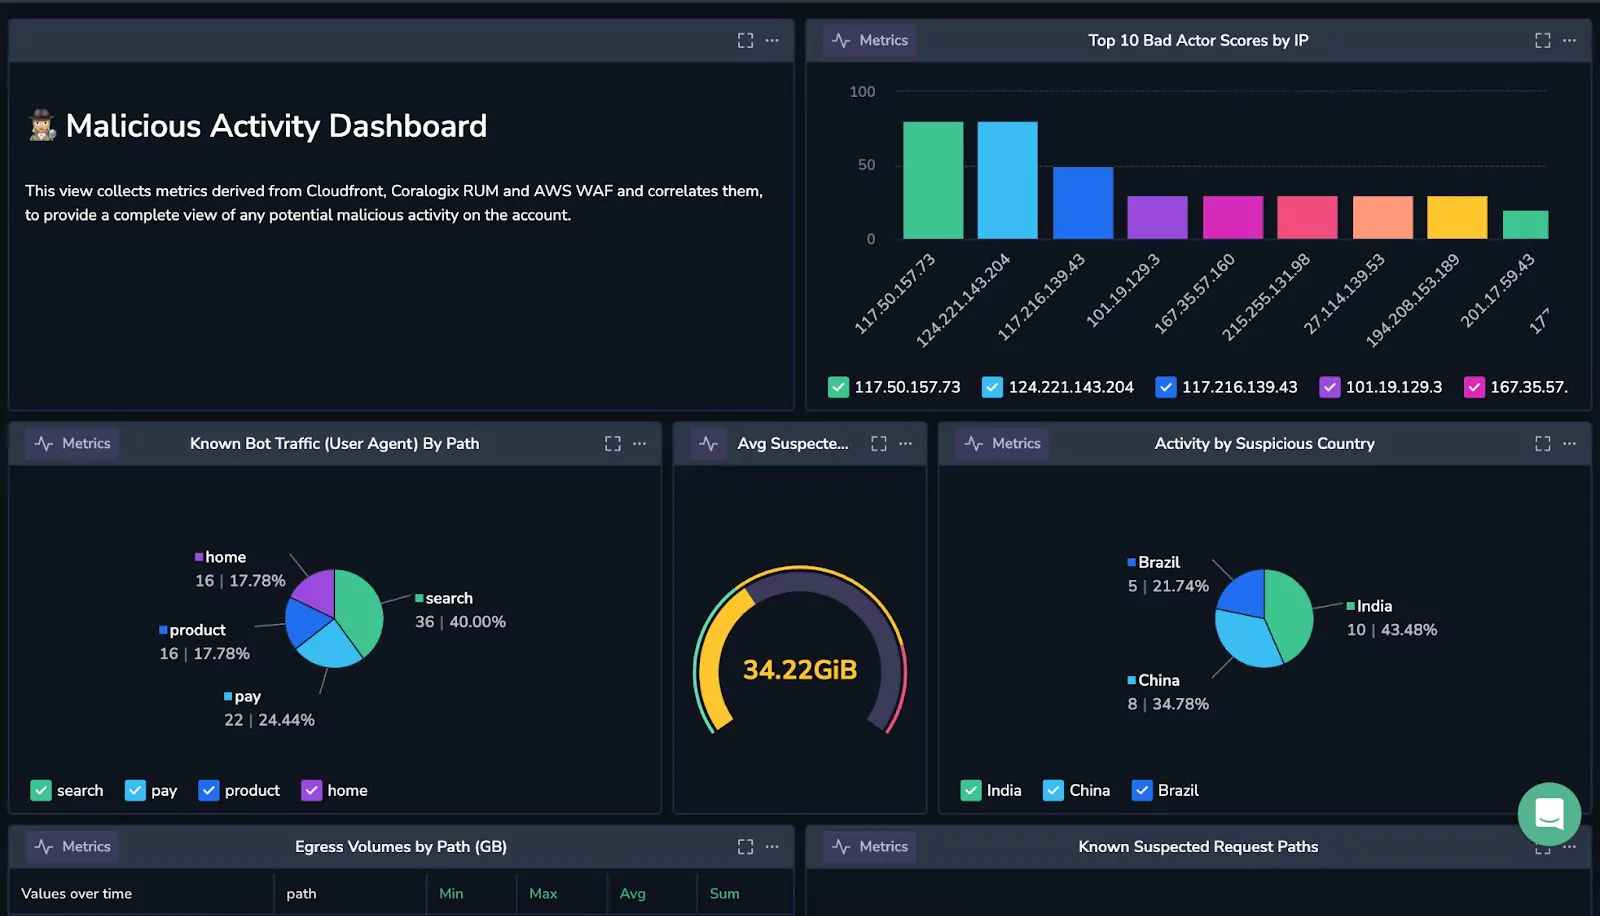
Using these metrics, customers get an extremely detailed (and totally customizable view) of their security posture, and can analyze dangerous users well before they cause a problem.
Efficiency, accuracy, and flexibility
The power of this is very clear. The PromQL will perform well, and generate metrics every minute, and this can be deployed in a single click from a Coralogix extension, but crucially, this is not a black box solution.
Coralogix customers can see, and change, any factors as they need. This, coupled with our 24/7 support with a median response time of 20 seconds, means that this scoring function gives you an amazing framework, without restricting visibility or flexibility, and you’re able to work closely with Coralogix to shape it into exactly what you need.
What does this mean for our customers?
The key value statements for this solution are:
- Enormous cost optimization potential, thanks to the characteristics of CDN & RUM data and the power of Coralogix TCO.
- Historical and operational retention, using Coralogix remote archive query and Events2Metrics
- Correlated 3rd party information using Coralogix Enrichment
- Custom dashboarding to visualize the data as you see fit.
- Total transparency into how the solution works, how weightings are generated and which factors are considered, with total customization available to users who need to tailor Coralogix to fit what they need.
Want to hit the ground running with bad bot detection? Check out Coralogix’s quick start pack for bad bot detection with loads of out-of-the-box dashboards, alerts and more.