The widespread adoption of Agile methodologies in recent years has allowed organizations to significantly increase their ability to push out more high quality software. The new fast-paced CI/CD solutions pipeline and lightweight microservices architecture enable us to introduce new updates at a rate and scale that would have seemed unimaginable just a few years ago.
Previous development practices revolved heavily around centralized applications and infrequent updates that were shipped maybe once a quarter or even once a year.
But with the benefits of new technologies comes a new set of challenges that need to be addressed as well.
While the tools for creating and deploying software have improved significantly, we are still in the process of establishing a more efficient approach to troubleshooting.
This post takes a look at the tools that are currently available for helping teams keep their software functioning as intended, the challenges that they face with advances in the field, and a new way forward that will speed up the troubleshooting process for everyone involved.
Challenges Facing Troubleshooters
On the face of it, the ability to make more software is a positive mark in the ledger. But with new abilities come new issues to solve.
Let’s take a look at three of the most common challenges facing organizations right now.
The Move from the Monolith to Microservices
Our first challenge is that there are now more moving parts where issues may arise that can complicate efforts to fix them quickly and efficiently.
Since making the move to microservices and Kubernetes, we are now dealing with a much more distributed set of environments. We have replaced the “monolith” of the single core app with many smaller, more agile but dispersed apps.
Their high level of distribution makes it more difficult to quickly track down where a change occurred and understand what’s impacting what. As the elements of our apps become more siloed, we lose overall visibility over the system structure.
Teams are Becoming More Siloed
The next challenge is that with more widely distributed teams taking part in the software development process, there are much fewer people who are significantly familiar with the environment when it comes to addressing problems impacting the products.
Each team is proficient in their own domain and segment of the product, but are essentially siloed off from the other groups. This leads to a lack of knowledge sharing across teams that can be highly detrimental when it comes time for someone to get called in to fix an issue stemming from another team’s part of the product.
More Changes, More Often
Then finally for our current review, is the fact that changes are happening far more often than before.
Patches no longer have to wait until it’s Tuesday to come out. New features on the app or adjustments to infrastructure like load balancing can impact the product and require a fix. With all this going on, it is easy for others to not be aware of these changes.
The lack of communication caused by siloes combined with the increase in the number of changes can create confusion when issues arise. Sort of like finding a specific needle in a pile of needles. It’s enough to make you miss the haystack metaphor.
In Search of Context
In examining these challenges, we can quickly understand that they all center around the reality that those tasked with troubleshooting issues lack the needed context for fixing them.
Developers, who are increasingly being called upon to troubleshoot, lack the knowledge of what has changed, by who, what it impacts, or even where to start looking in a potentially unfamiliar environment.
Having made the move to the cloud, developers have at their disposal a wide range of monitoring and observability tools covering needs related to tracing, logs, databases, alerting, security, and topology, providing them with greater visibility into their software throughout the Software Development Lifecycle.
When they get the call that something needs their attention, they often have to begin investigating essentially from scratch. This means jumping into their many tools and dashboards, pouring over logs to try and figure out the source of the problem. While these monitoring and observability tools can provide valuable insights, it can still be difficult to identify which changes impacted which other components.
Some organizations attempt to use communication tools like Slack to track changes. While we love the scroll as much as anyone else, it is far from a comprehensive solution and still lacks the connection between source and impact. Chances are that they will need to call in for additional help in tracking down the root of the problem from someone else on their team or a different team altogether.
In both cases, the person on-call still needs to spend significant and valuable time on connecting the dots between changes and issues. Time that might be better spent on actually fixing the problem and getting the product back online.
Filling in the Missing Part of the DevOps Toolchain
The tooling available to help identify issues are getting much better at providing visibility, including to provide on-call responders with the context that will help them get to the source of the problem faster.
Moving forward, we want to see developers gain a better, holistic understanding of their Kubernetes environments. So even if their microservices are highly distributed, their visibility over them should be more unified.
Fixing problems faster means getting the relevant information into the hands of whoever is called up to address the issue. It should not matter if the incident is in a product that they themselves built or if they are opening it up for the first time.
Reducing the MTTR relies on providing them with the necessary context from the tools that they are already using to monitor their environment. Hopefully by better utilizing our existing resources, we can cut down on the time and number of people required to fix issues when they pop up — allowing us to get back to actually building better products.
Are you building and deploying software manually and would like to change that? Are you interested in learning about building a Jenkins pipeline and better understand CI/CD solutions and DevOps at the same time? In this first post, we will go over the fundamentals of how to design pipelines and how to implement them in Jenkins. Automation is the key to eliminating manual tasks and to reducing the number of errors while building, testing and deploying software. Let’s learn how Jenkins can help us achieve that with hands-on examples with the Jenkins parameters. By the end of this tutorial, you’ll have a broad understanding of how Jenkins works along with its Syntax and Pipeline examples.
What is a pipeline anyway?
Let’s start with a short analogy to a car manufacturing assembly line. I will oversimplify this to only three stages of a car’s production:
Bring the chassis
Mount the engine on the chassis
Place the body on the car
Even from this simple example, notice a few aspects:
These are a series of pipeline steps that need to be done in a particular order
The steps are connected: the output from the previous step is the input for the next step
In software development, a pipeline is a chain of processing components organized so that the output of one component is the input of the next component.
At the most basic level, a component is a command that does a particular task. The goal is to automate the entire process and to eliminate any human interaction. Repetitive tasks cost valuable time and often a machine can do repetitive tasks faster and more accurately than a human can do.
What is Jenkins?
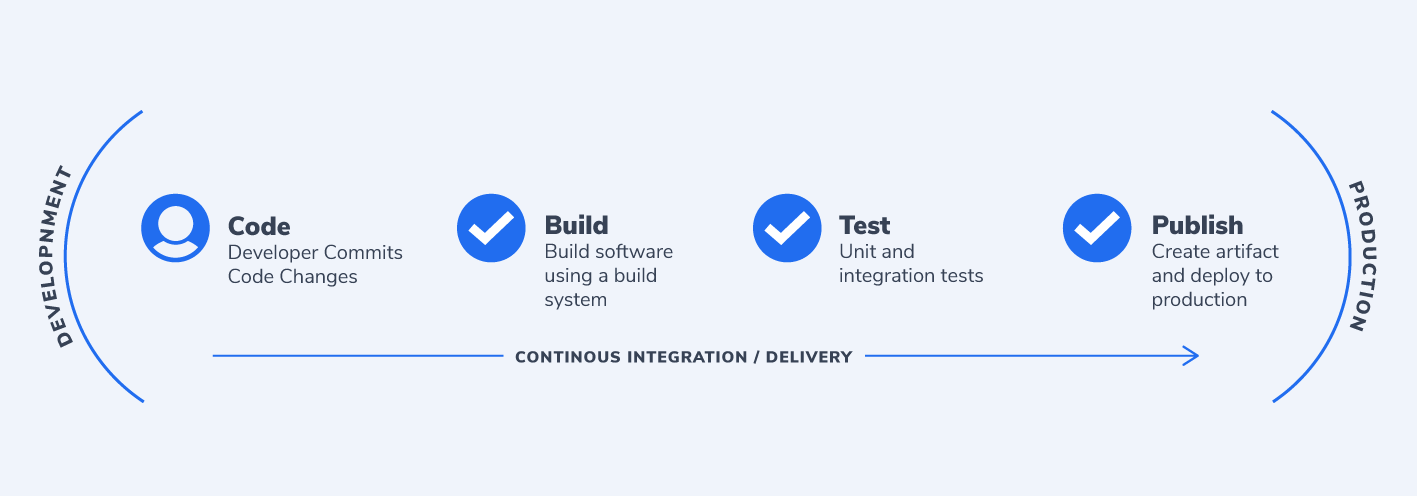
Jenkins is an automation tool that automatically builds, tests, and deploys software from our version control repository all the way to our end users. A Jenkins pipeline is a sequence of automated stages and steps to enable us to accelerate the development process – ultimately achieving Continuous Delivery (CD). Jenkins helps to automatically build, test, and deploy software without any human interaction – but we will get into that a bit later.
If you don’t already have Jenkins installed, make sure that you check this installation guide to get you started.
Create a Jenkins Pipeline Job
Let’s go ahead and create a new job in Jenkins. A job is a task or a set of tasks that run in a particular order. We want Jenkins to automatically execute the task or tasks and to record the result. It is something we assign Jenkins to do on our behalf.
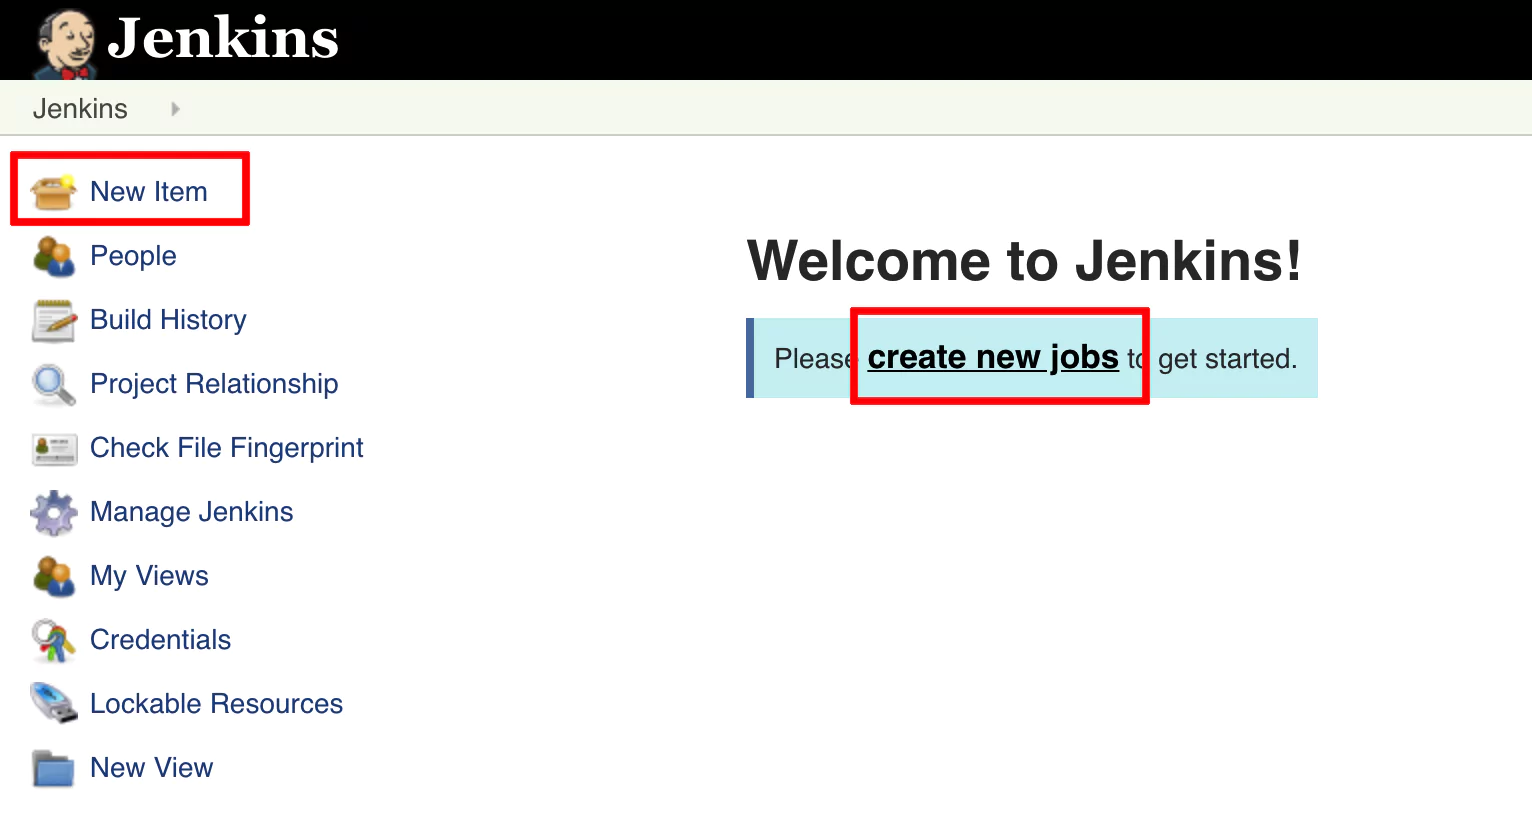
Click on Create new jobs if you see the text link, or from the left panel, click on New Item (an Item is a job).
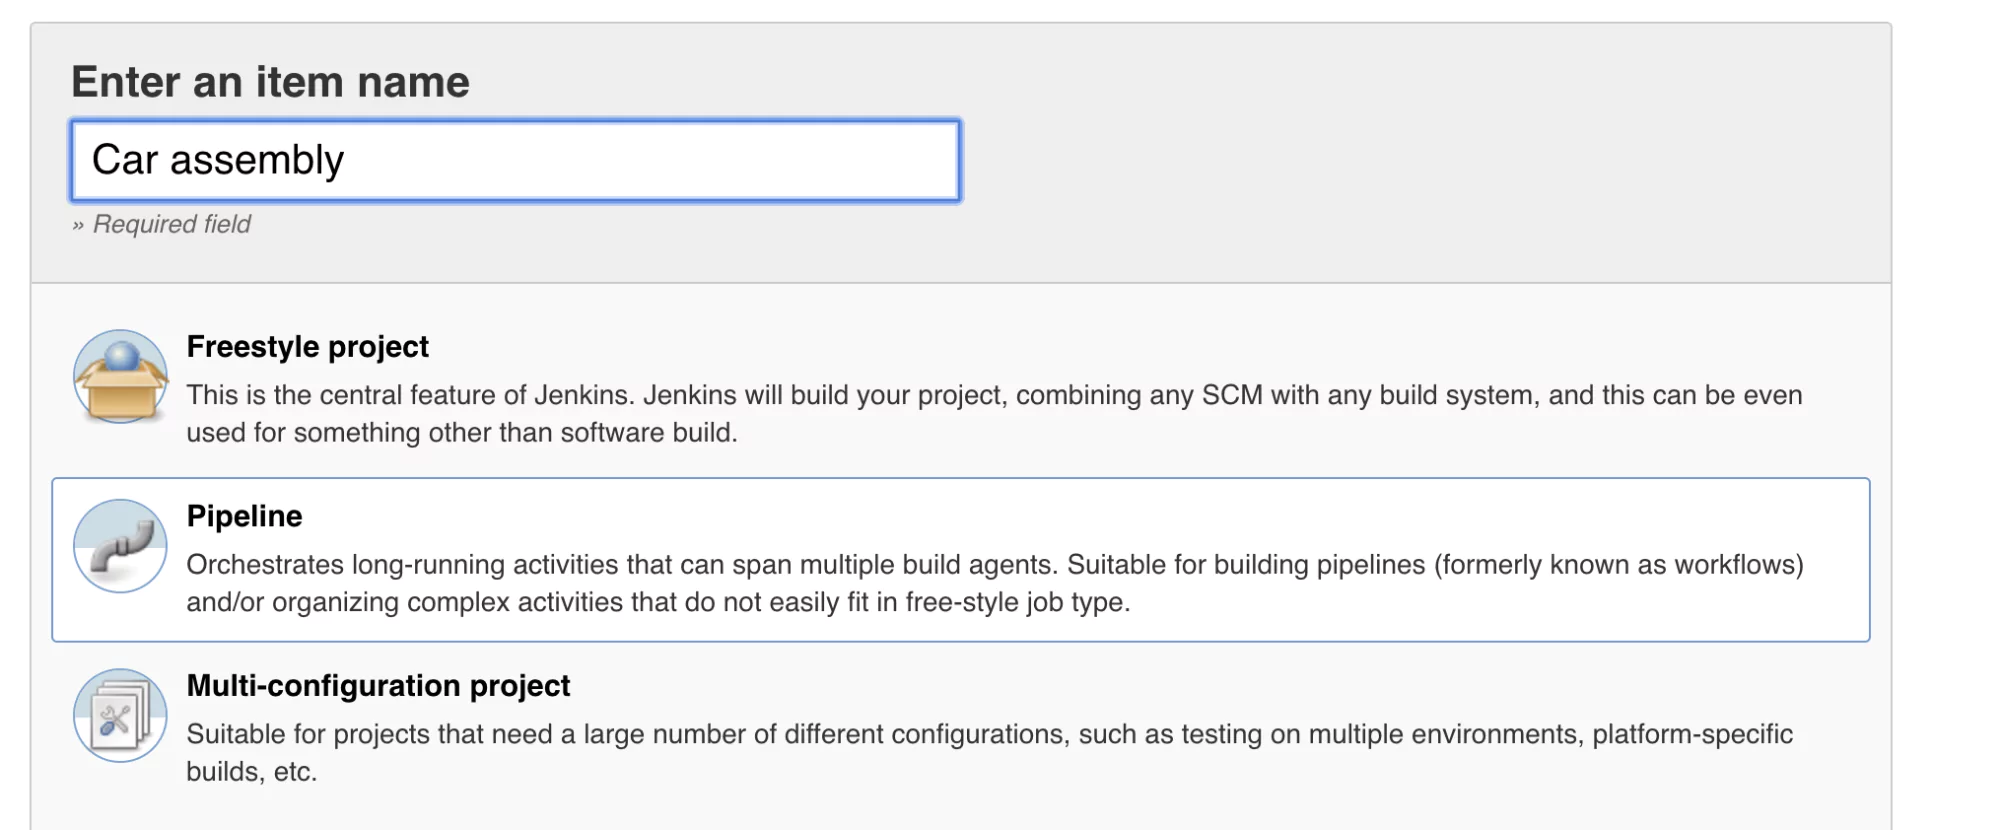
Name your job Car assembly and select the Pipeline type. Click ok.
Configure Pipeline Job
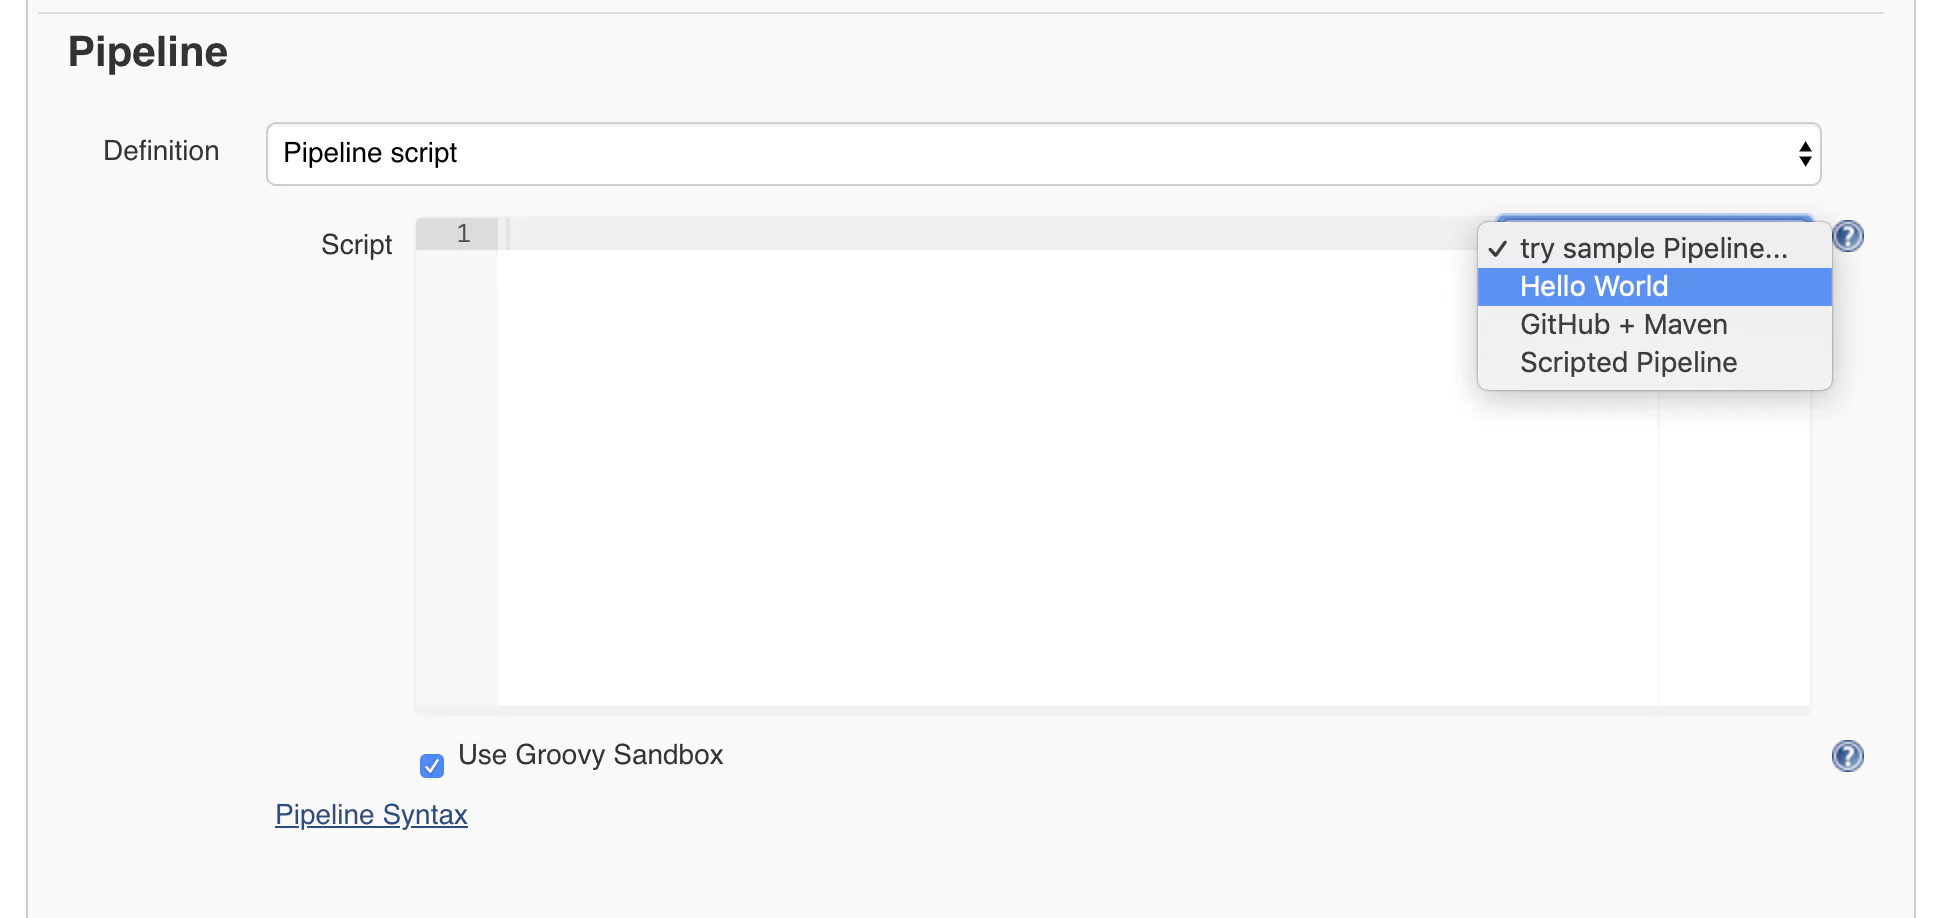
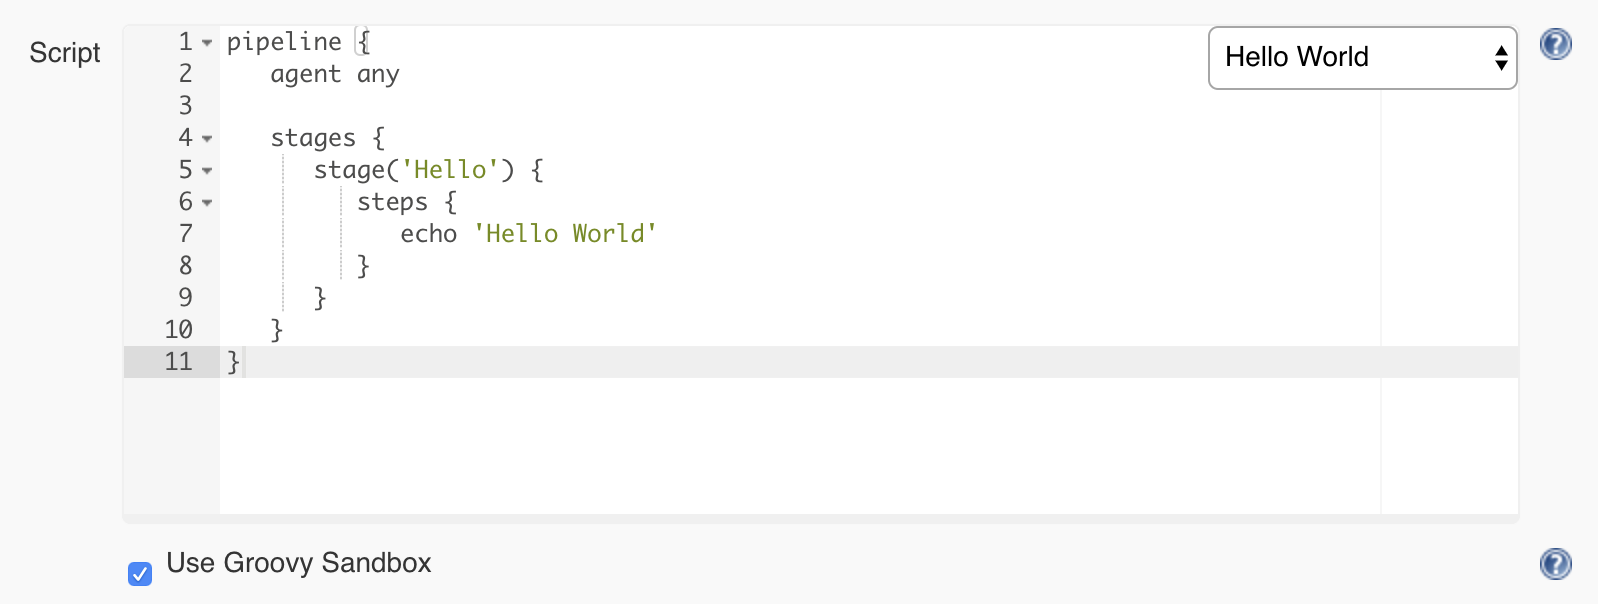
Now you will get to the job configuration page where we’ll configure a pipeline using the Jenkins syntax. At first, this may look scary and long, but don’t worry. I will take you through the process of building Jenkins pipeline step by step with every parameter provided and explained. Scroll to the lower part of the page until you reach a part called Pipeline. This is where we can start defining our Jenkins pipeline. We will start with a quick example. On the right side of the editor, you will find a select box. From there, choose Hello World.
You will notice that some code was generated for you. This is a straightforward pipeline that only has one step and displays a message using the command echo ‘Hello World’.
Click on Save and return to the main job page.
Build The Jenkins Pipeline
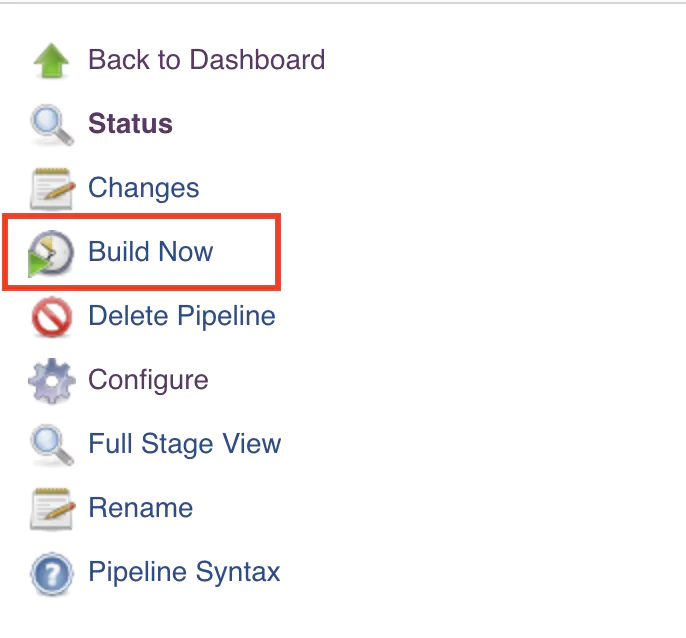
From the left-side menu, click on Build Now.
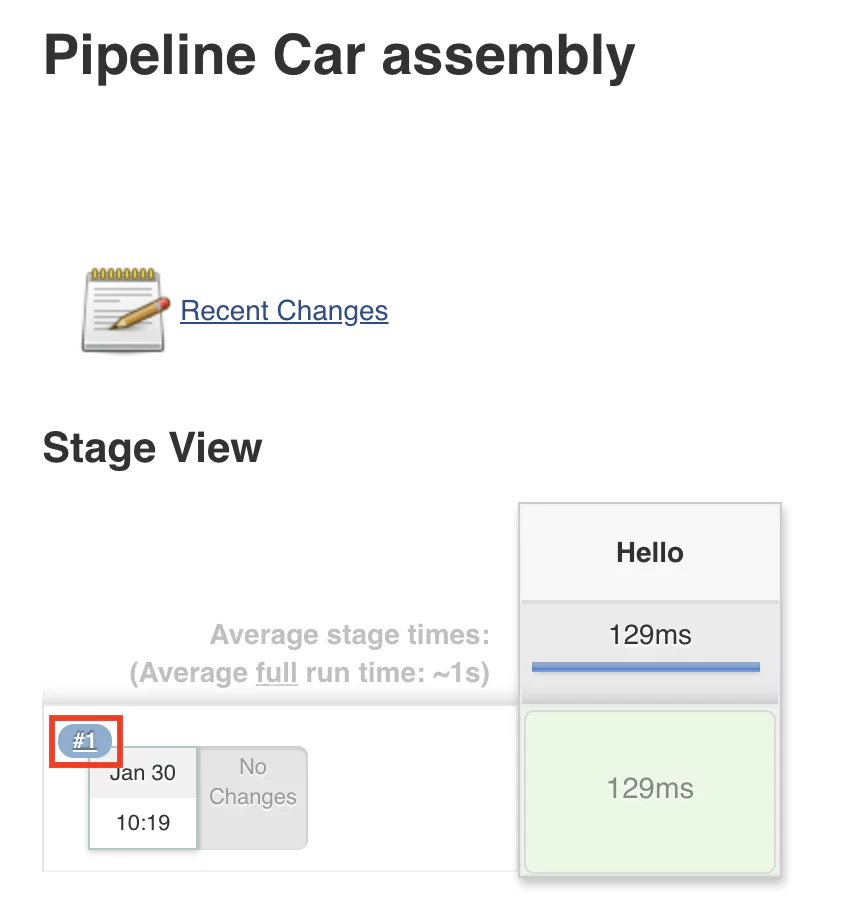
This will start running the job, which will read the configuration and begin executing the steps configured in the pipeline. Once the execution is done, you should see something similar to this layout:
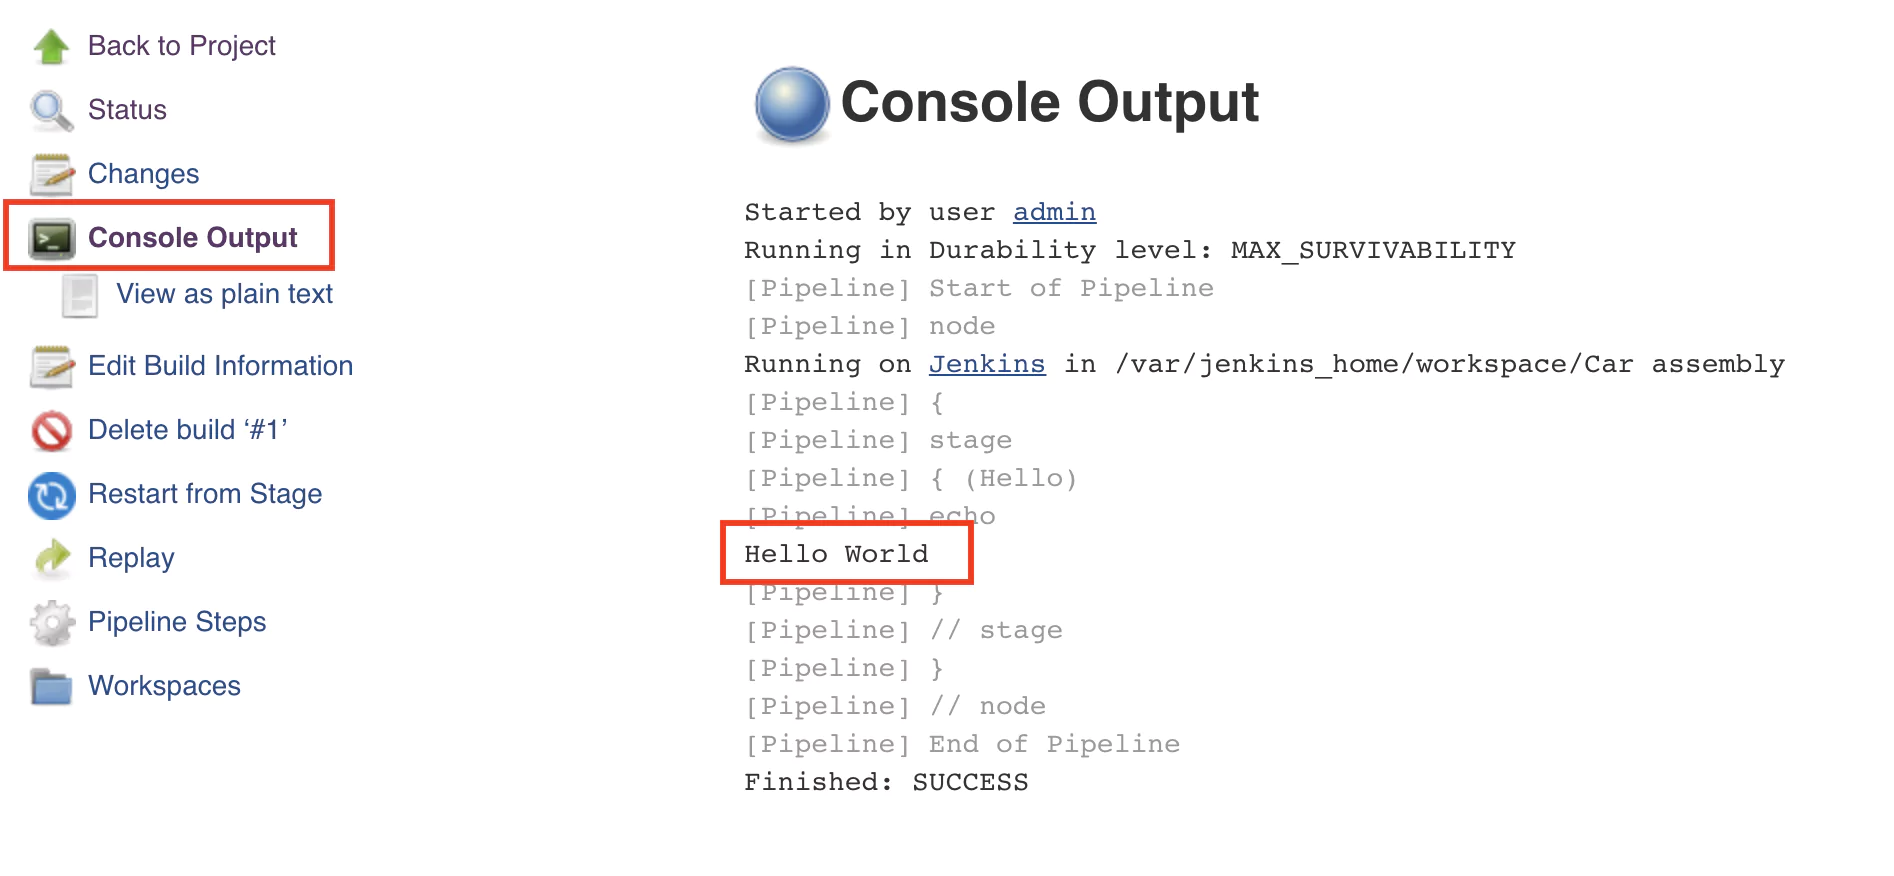
A green-colored stage will indicate that the execution was successful and no errors where encountered. To view the console output, click on the number of the build (in this case #1). After this, click on the Console output button, and the output will be displayed.
Notice the text Hello world that was displayed after executing the command echo ‘Hello World’.
Congratulations! You have just configured and executed your first pipeline in Jenkins.
A Basic Pipeline Build Process
When building software, we usually go through several stages. Most commonly, they are:
Build – this is the main step and does the automation work required
Test – ensures that the build step was successful and that the output is as expected
Publish – if the test stage is successful, this saves the output of the build job for later use
We will create a simple car assembly pipeline but only using folders, files, and text. So we want to do the following in each stage:
Build
create a build folder
create a car.txt file inside the build folder
add the words “chassis”, “engine” and “body” to the car.txt file
Test
check that the car.txt file exists in the build folder
words “chassis”, “engine” and “body” are present in the car.txt file
Publish
save the content of the build folder as a zip file
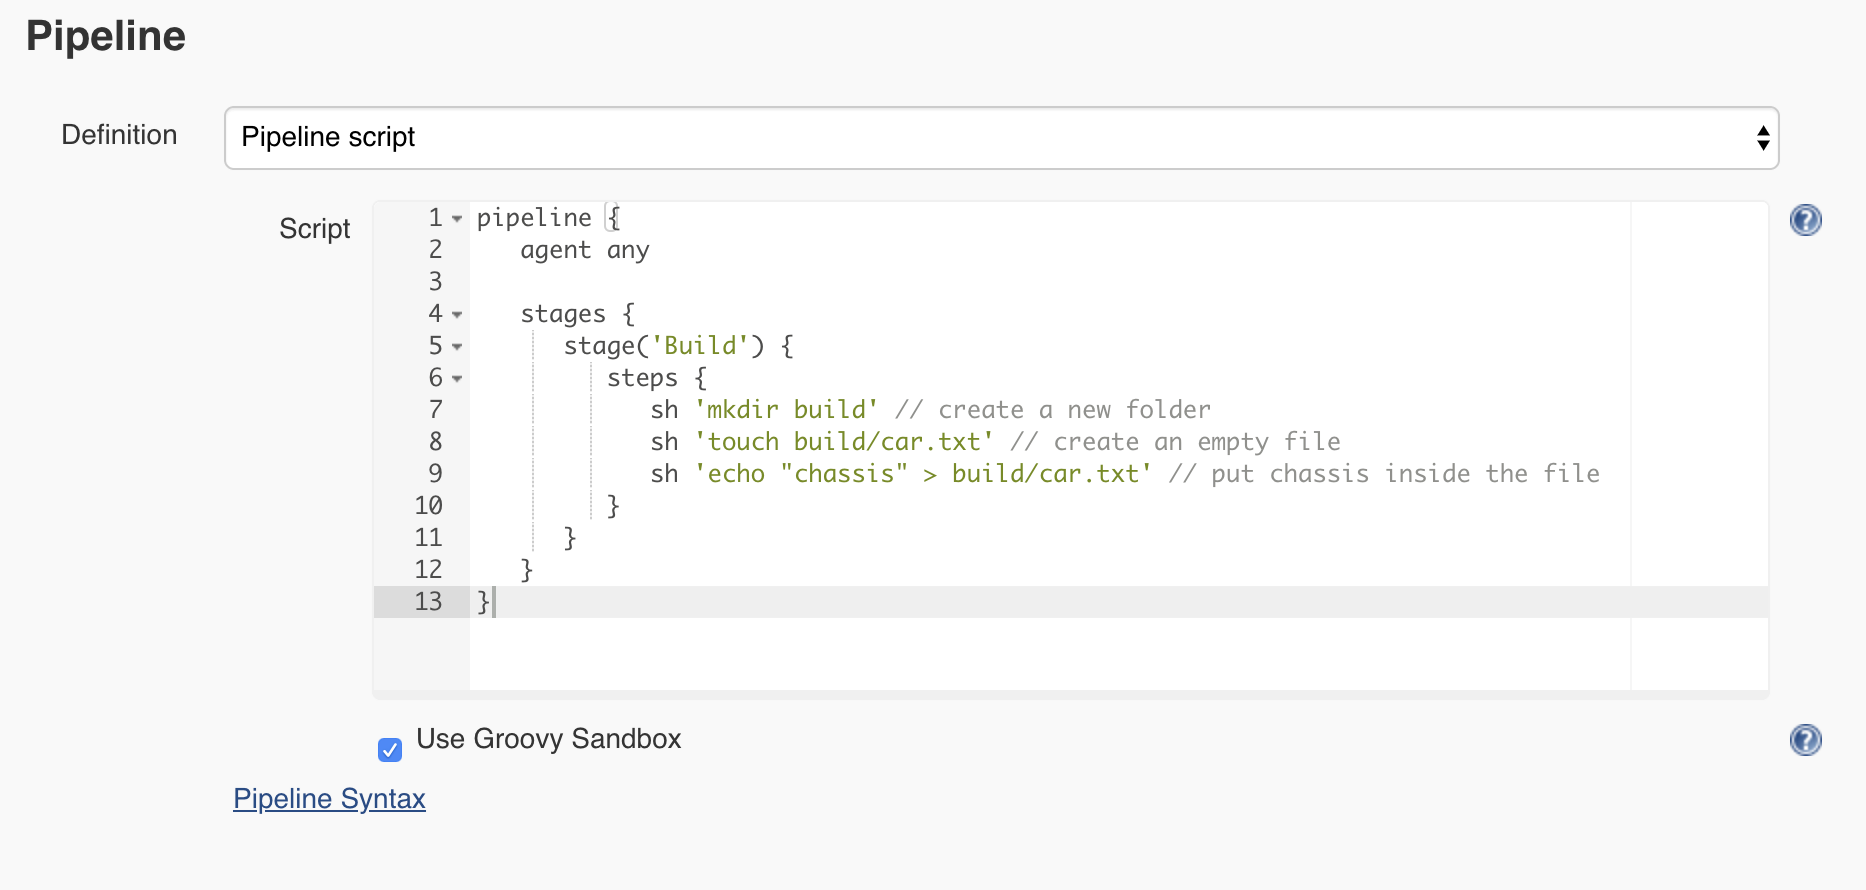
The Jenkins Build Stage
Note: the following steps require that Jenkins is running on a Unix-like system. Alternatively, the Windows system running Jenkins should have some Unix utilities installed.
Let’s go back to the Car assembly job configuration page and rename the step that we have from Hello to Build. Next, using the pipeline step sh, we can execute a given shell command. So the Jenkins pipeline will look like this:
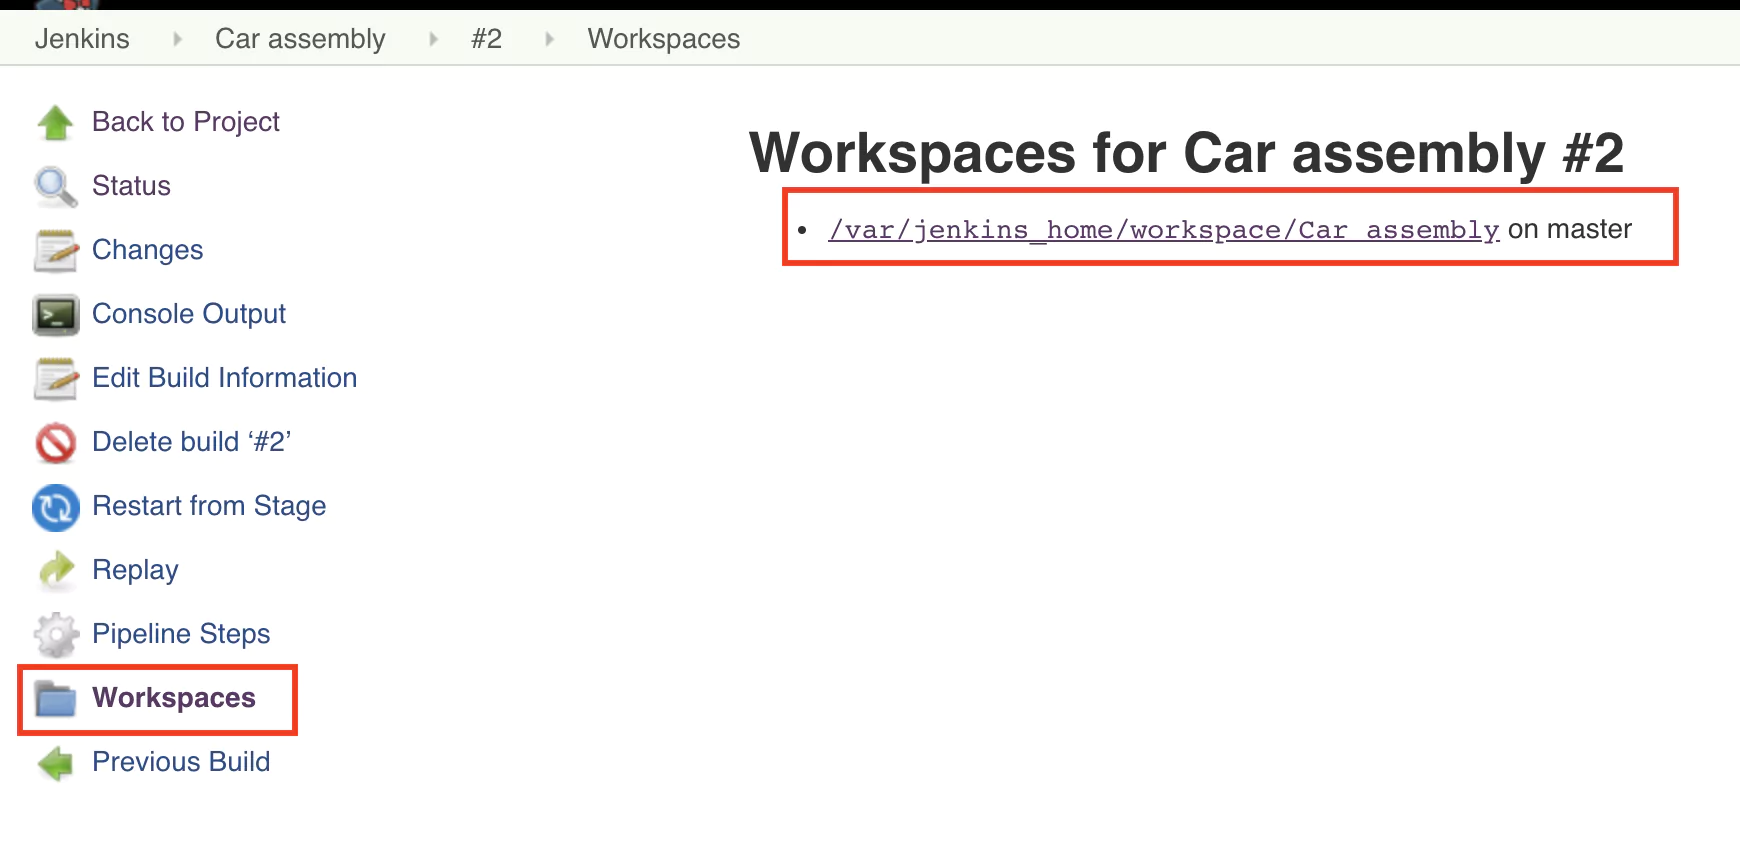
Let’s save and execute the pipeline. Hopefully, the pipeline is successful again, but how do we know if the car.txt file was created? Do inspect the output, click on the job number and on the next page from the left menu select Workspaces.
Click on the folder path displayed and you should soon see the build folder and its contents.
The Jenkins Test Stage
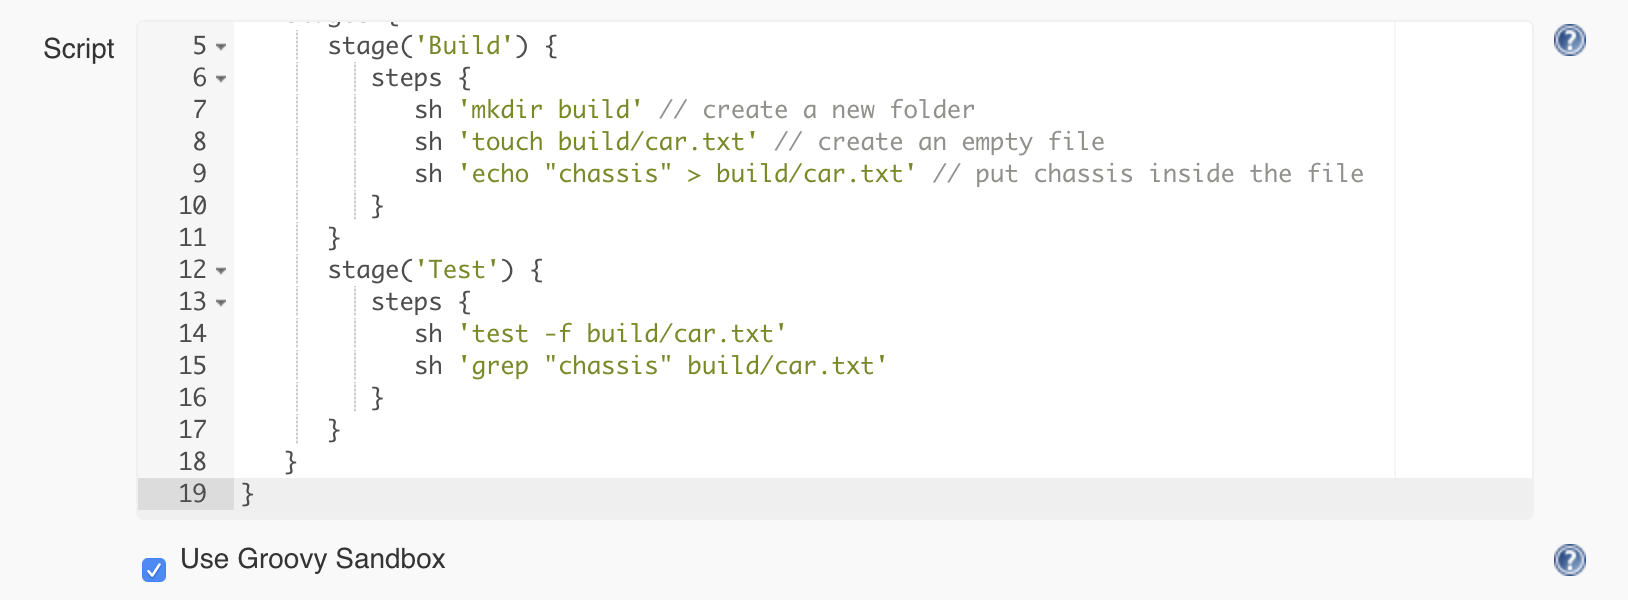
In the previous step, we manually checked that the folder and the file were created. As we want to automate the process, it makes sense to write a test that will check if the file was created and has the expected contents.
Let’s create a test stage and use the following commands to write the test:
the test command combined with the -f flag allows us to test if a file exists
the grep command will enable us to search the content of a file for a specific string
So the pipeline will look like this:
Why did the Jenkins pipeline fail?
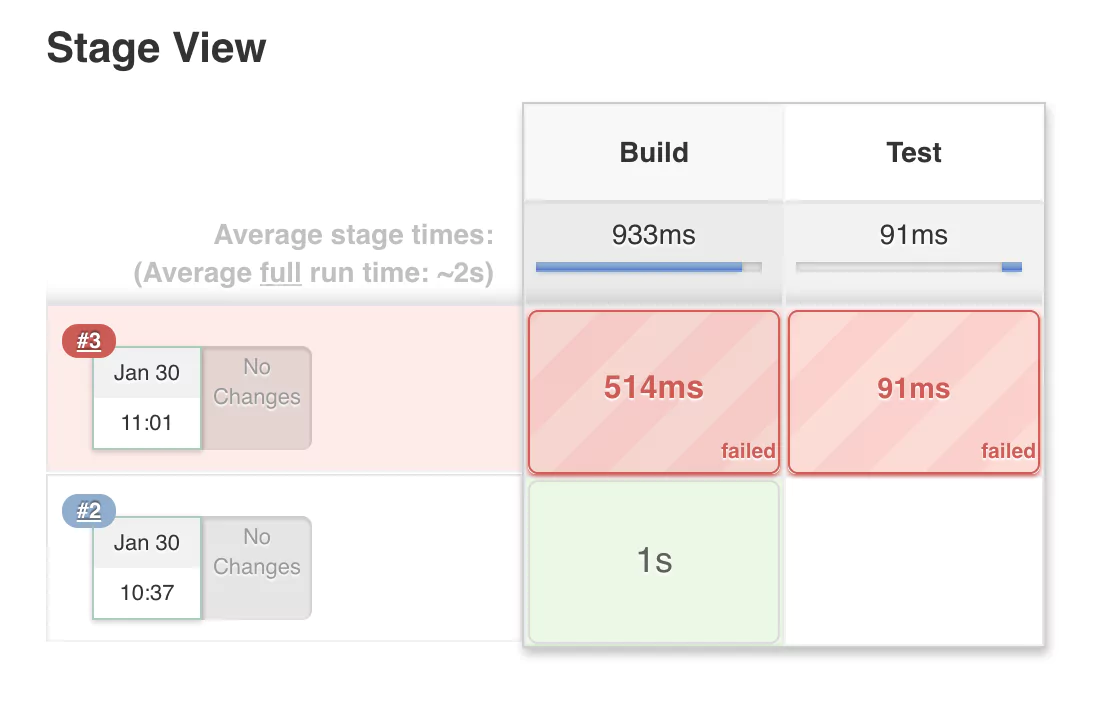
If you save the previous configuration and run the pipeline again, you will notice that it will fail, indicated by a red color.
The most common reasons for a pipeline to fail is because:
The pipeline configuration is incorrect. This first problem is most likely due to a syntax issue or because we’ve used a term that was not understood by Jenkins.
One of the build step commands returns a non-zero exit code. This second problem is more common. Each command after executing is expected to return an exit code. This tells Jenkins if the command was successful or not. If the exit code is 0, it means the command was successful. If the exit code is not 0, the command encountered an error.
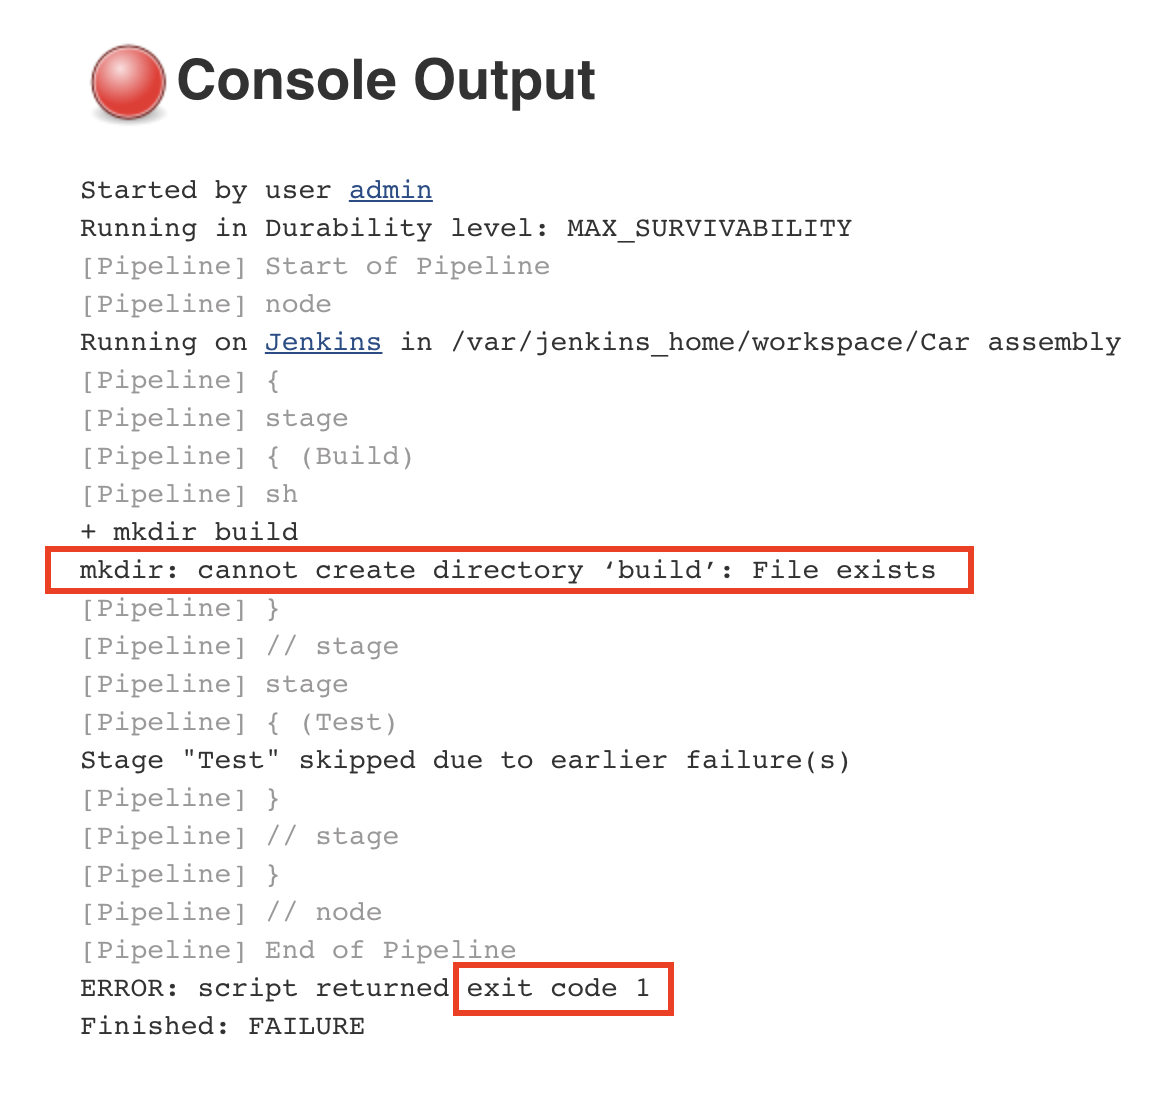
We want to stop the execution of the pipeline as soon as an error has been detected. This is to prevent future steps from running and propagating the error to the next stages. If we inspect the console output for the pipeline that has failed, we will identify the following error:
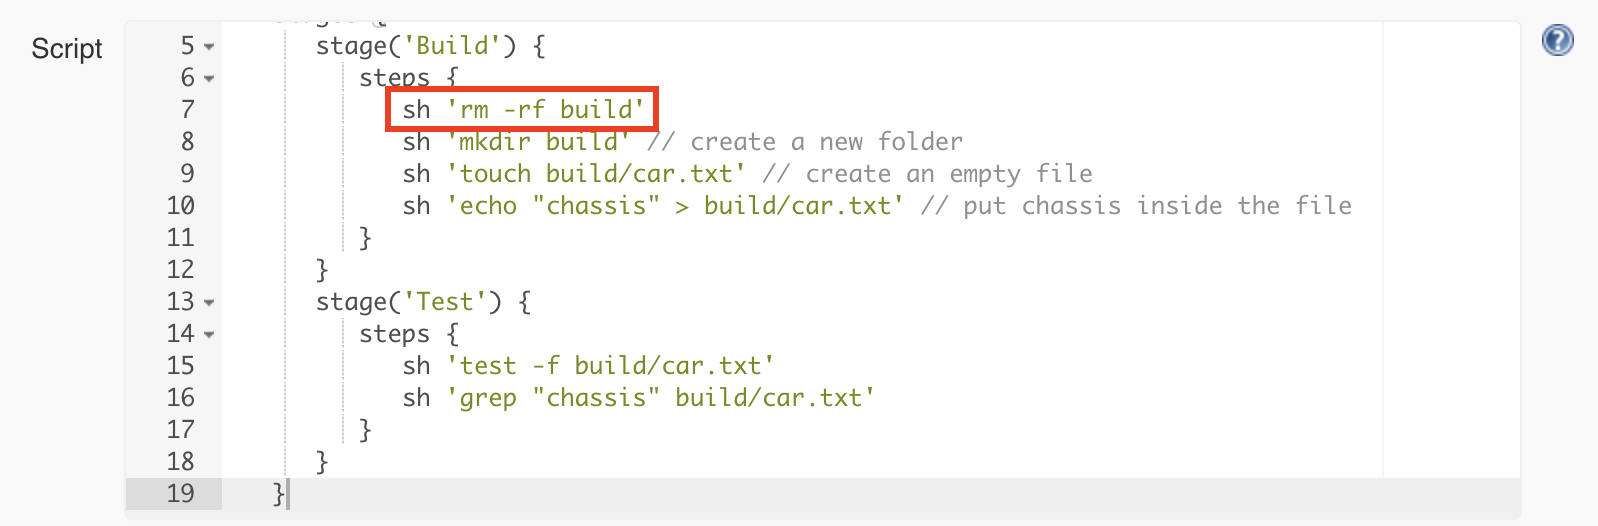
The error tells us that the command could not create a new build folder as one already exists. This happens because the previous execution of the pipeline already created a folder named ‘build’. Every Jenkins job has a workspace folder allocated on the disk for any files that are needed or generated for and during the job execution. One simple solution is to remove any existing build folder before creating a new one. We will use the rm command for this.
This will make the pipeline work again and also go through the test step.
The Jenkins Publishing Stage
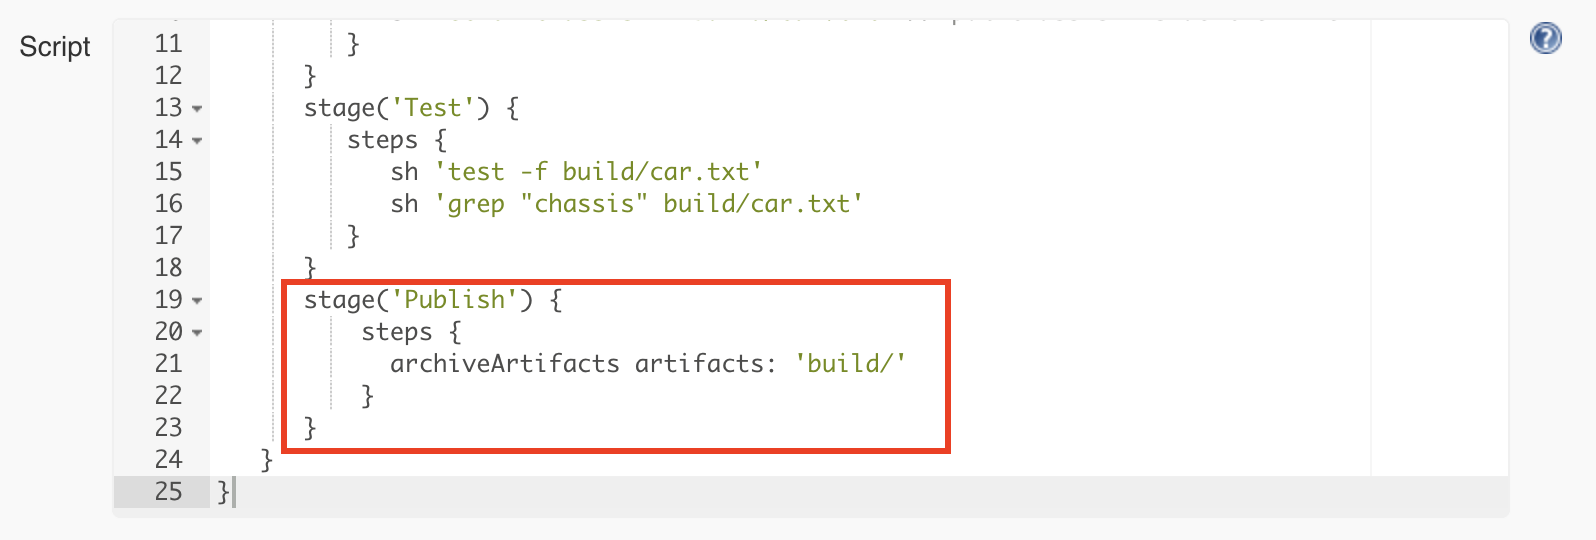
If the tests are successful, we consider this a build that we want to keep for later use. As you remember, we remove the build folder when starting rerunning the pipeline, so it does not make sense to keep anything in the workspace of the job. The job workspace is only for temporary purposes during the execution of the pipeline. Jenkins provides a way to save the build result using a build step called archiveArtifacts.
So what is an artifact? In archaeology, an artifact is something made or given shape by humans. Or in other words, it’s an object. Within our context, the artifact is the build folder containing the car.txt file.
We will add the final stage responsible for publishing and configuring the archiveArtifacts step to publish only the contents of the build folder:
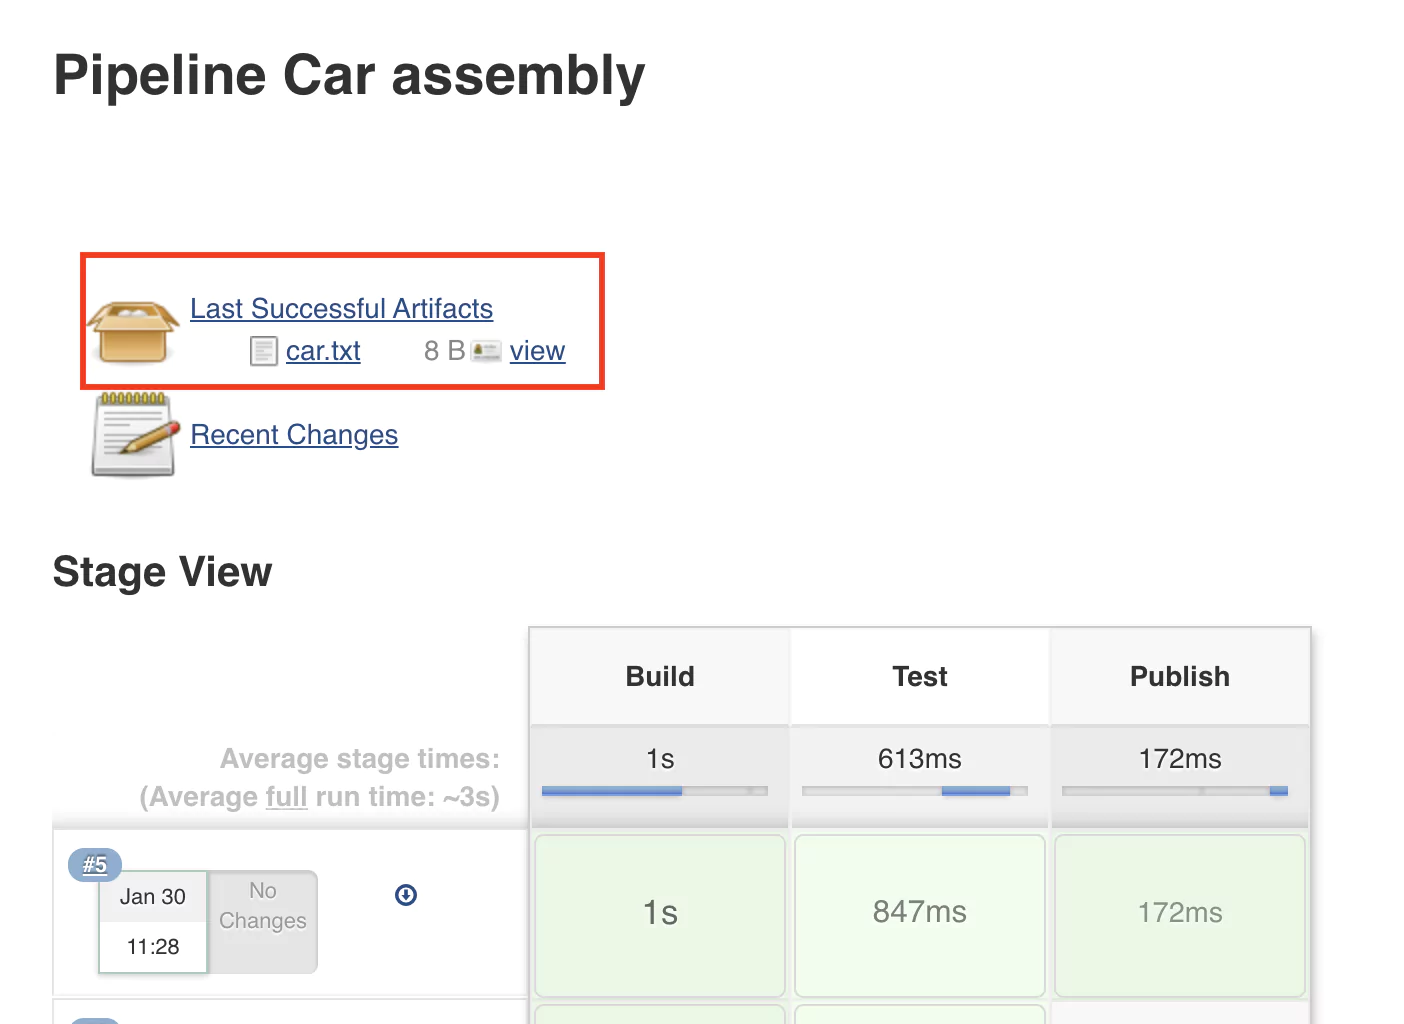
After rerunning the pipeline, the job page will display the latest successful artifact. Refresh the page once or twice if it does not show up.
(17-last-artifact.png)
Complete & Test the Pipeline
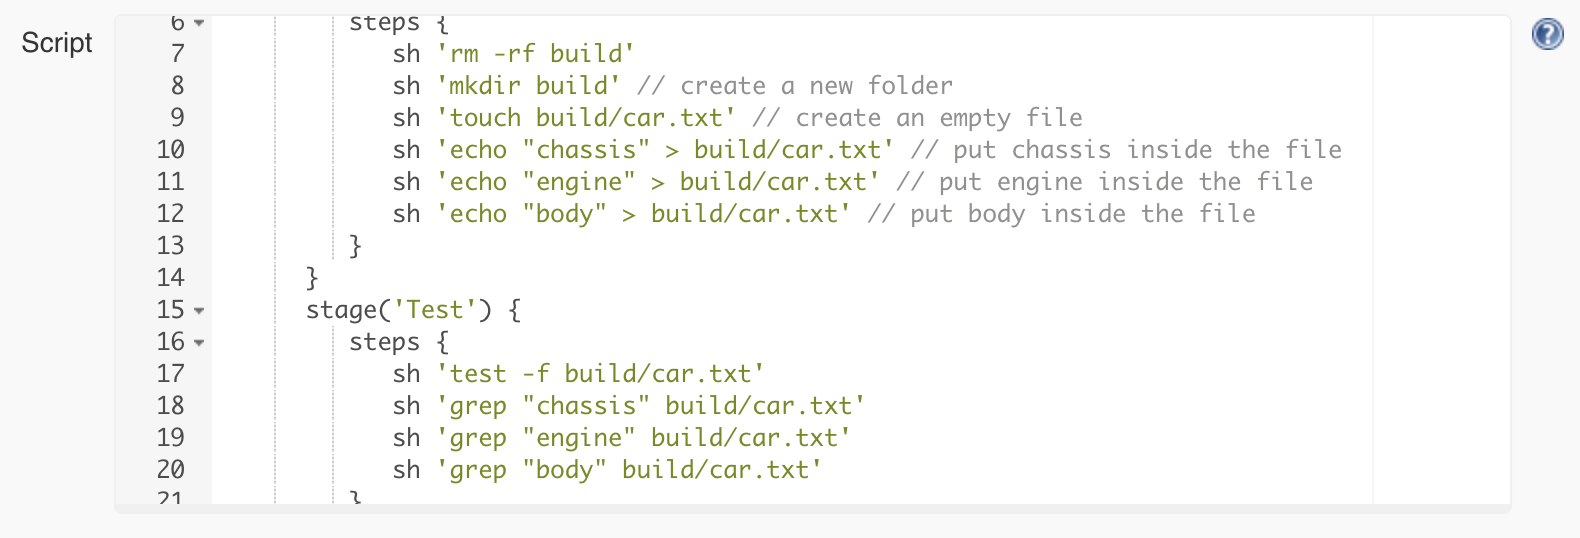
Let’s continue adding the other parts of the car: the engine and the body. For this, we will adapt both the build and the test stage as follows:
pipeline {
   agent any

   stages {
      stage('Build') {
         steps {
            sh 'rm -rf build'
            sh 'mkdir build' // create a new folder
            sh 'touch build/car.txt' // create an empty file
            sh 'echo "chassis" > build/car.txt' // add chassis
            sh 'echo "engine" > build/car.txt' // add engine
            sh 'echo "body" > build/car.txt' // body
         }
      }
      stage('Test') {
          steps {
              sh 'test -f build/car.txt'
              sh 'grep "chassis" build/car.txt'
              sh 'grep "engine" build/car.txt'
              sh 'grep "body" build/car.txt'
          }
      }
   }
}
Saving and rerunning the pipeline with this configuration will lead to an error in the test phase.
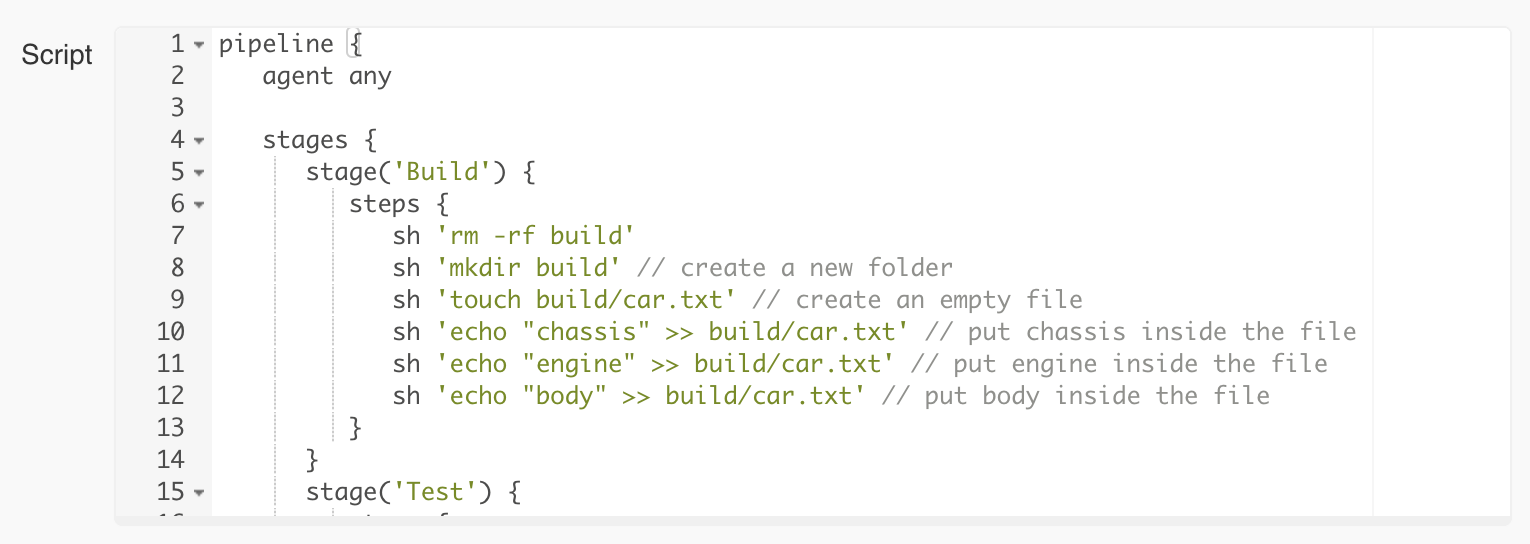
The reason for the error is that the car.txt file now only contains the word “body”. Good that we tested it! The > (greater than) operator will replace the entire content of the file, and we don’t want that. So we’ll use the >> operator just to append text to the file.
pipeline {
   agent any

   stages {
      stage('Build') {
         steps {
            sh 'rm -rf build'
            sh 'mkdir build'
            sh 'touch build/car.txt'
            sh 'echo "chassis" >> build/car.txt'
            sh 'echo "engine" >> build/car.txt'
            sh 'echo "body" >> build/car.txt'
         }
      }
      stage('Test') {
          steps {
              sh 'test -f build/car.txt'
              sh 'grep "chassis" build/car.txt'
              sh 'grep "engine" build/car.txt'
              sh 'grep "body" build/car.txt'
          }
      }
   }
}
Now the pipeline is successful again, and we’re confident that our artifact (i.e. file) has the right content.
Pipeline as Code
If you remember, at the beginning of the tutorial, you were asked to select the type of job you want to create. Historically, many jobs in Jenkins were and still are configured manually, with different checkboxes, text fields, and so on. Here we did something different. We called this approach Pipeline as Code. While it was not apparent, we’ve used a Domain Specific Language (DSL), which has its foundation in the Groovy scripting language. So this is the code that defines the pipeline.
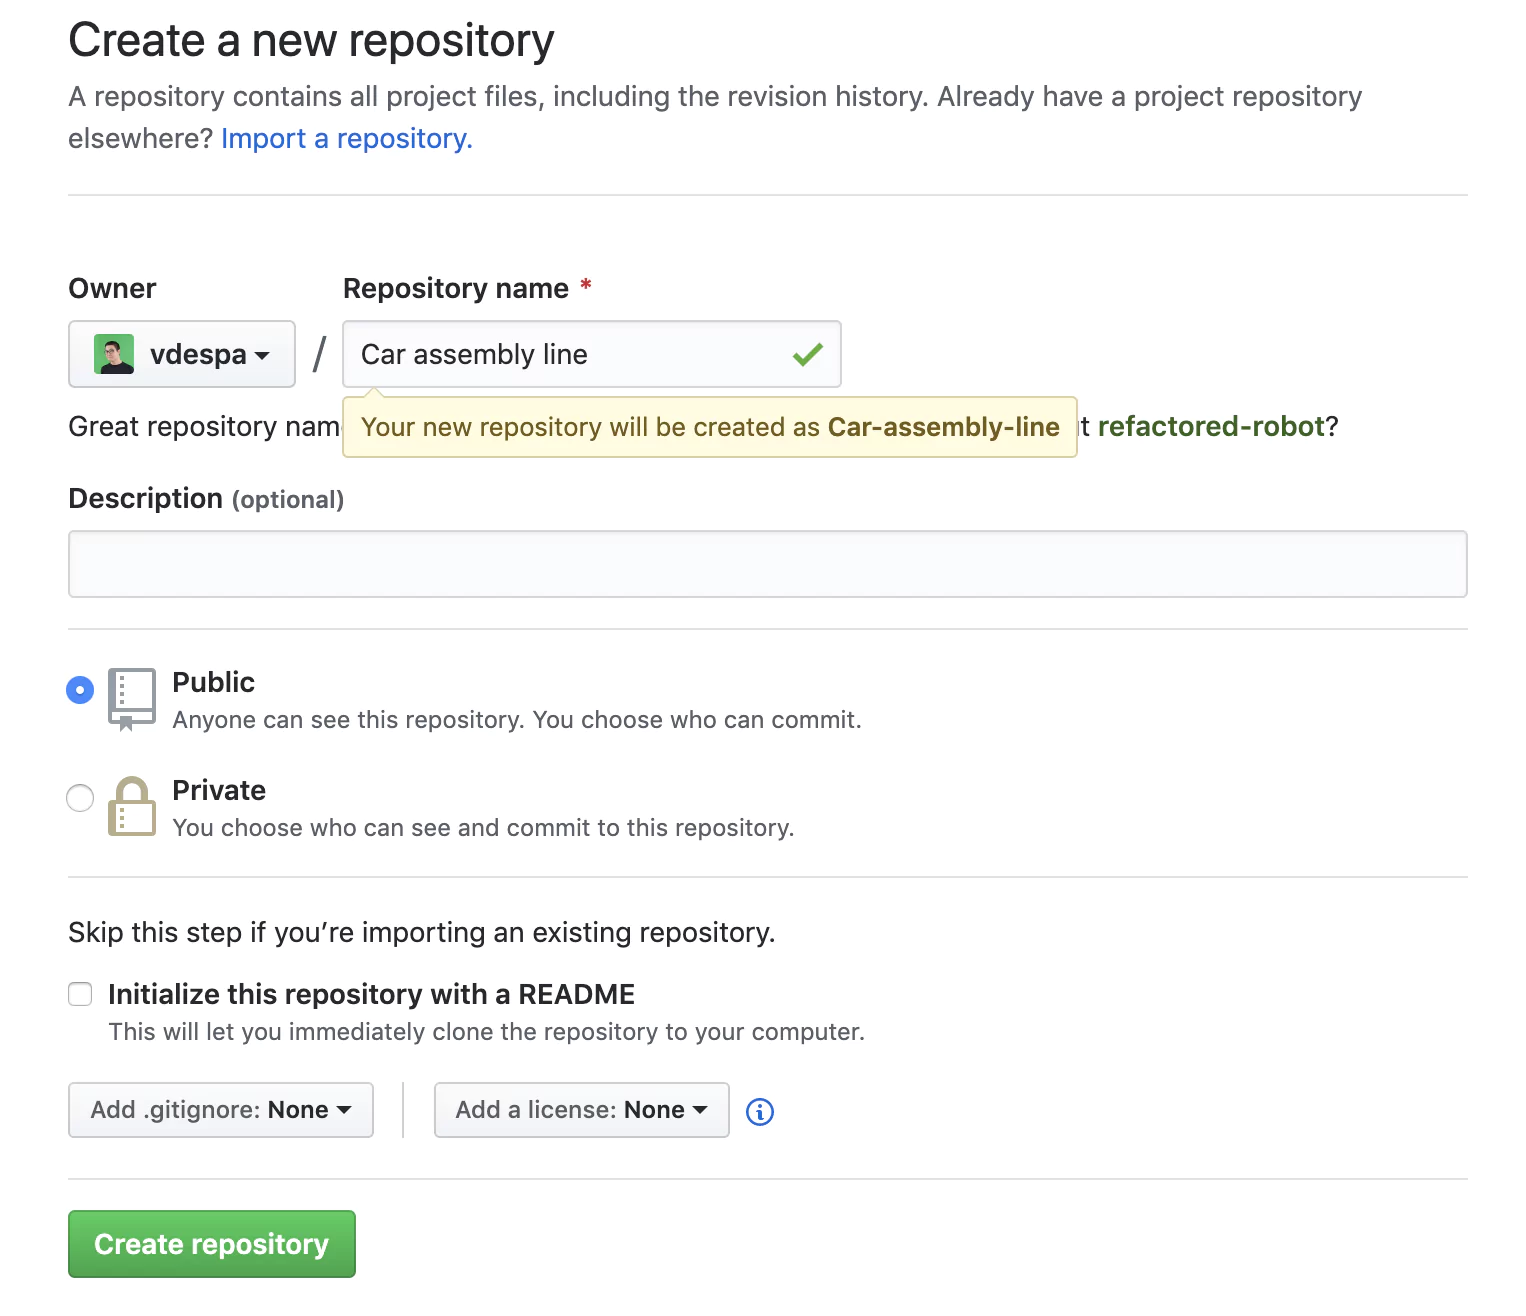
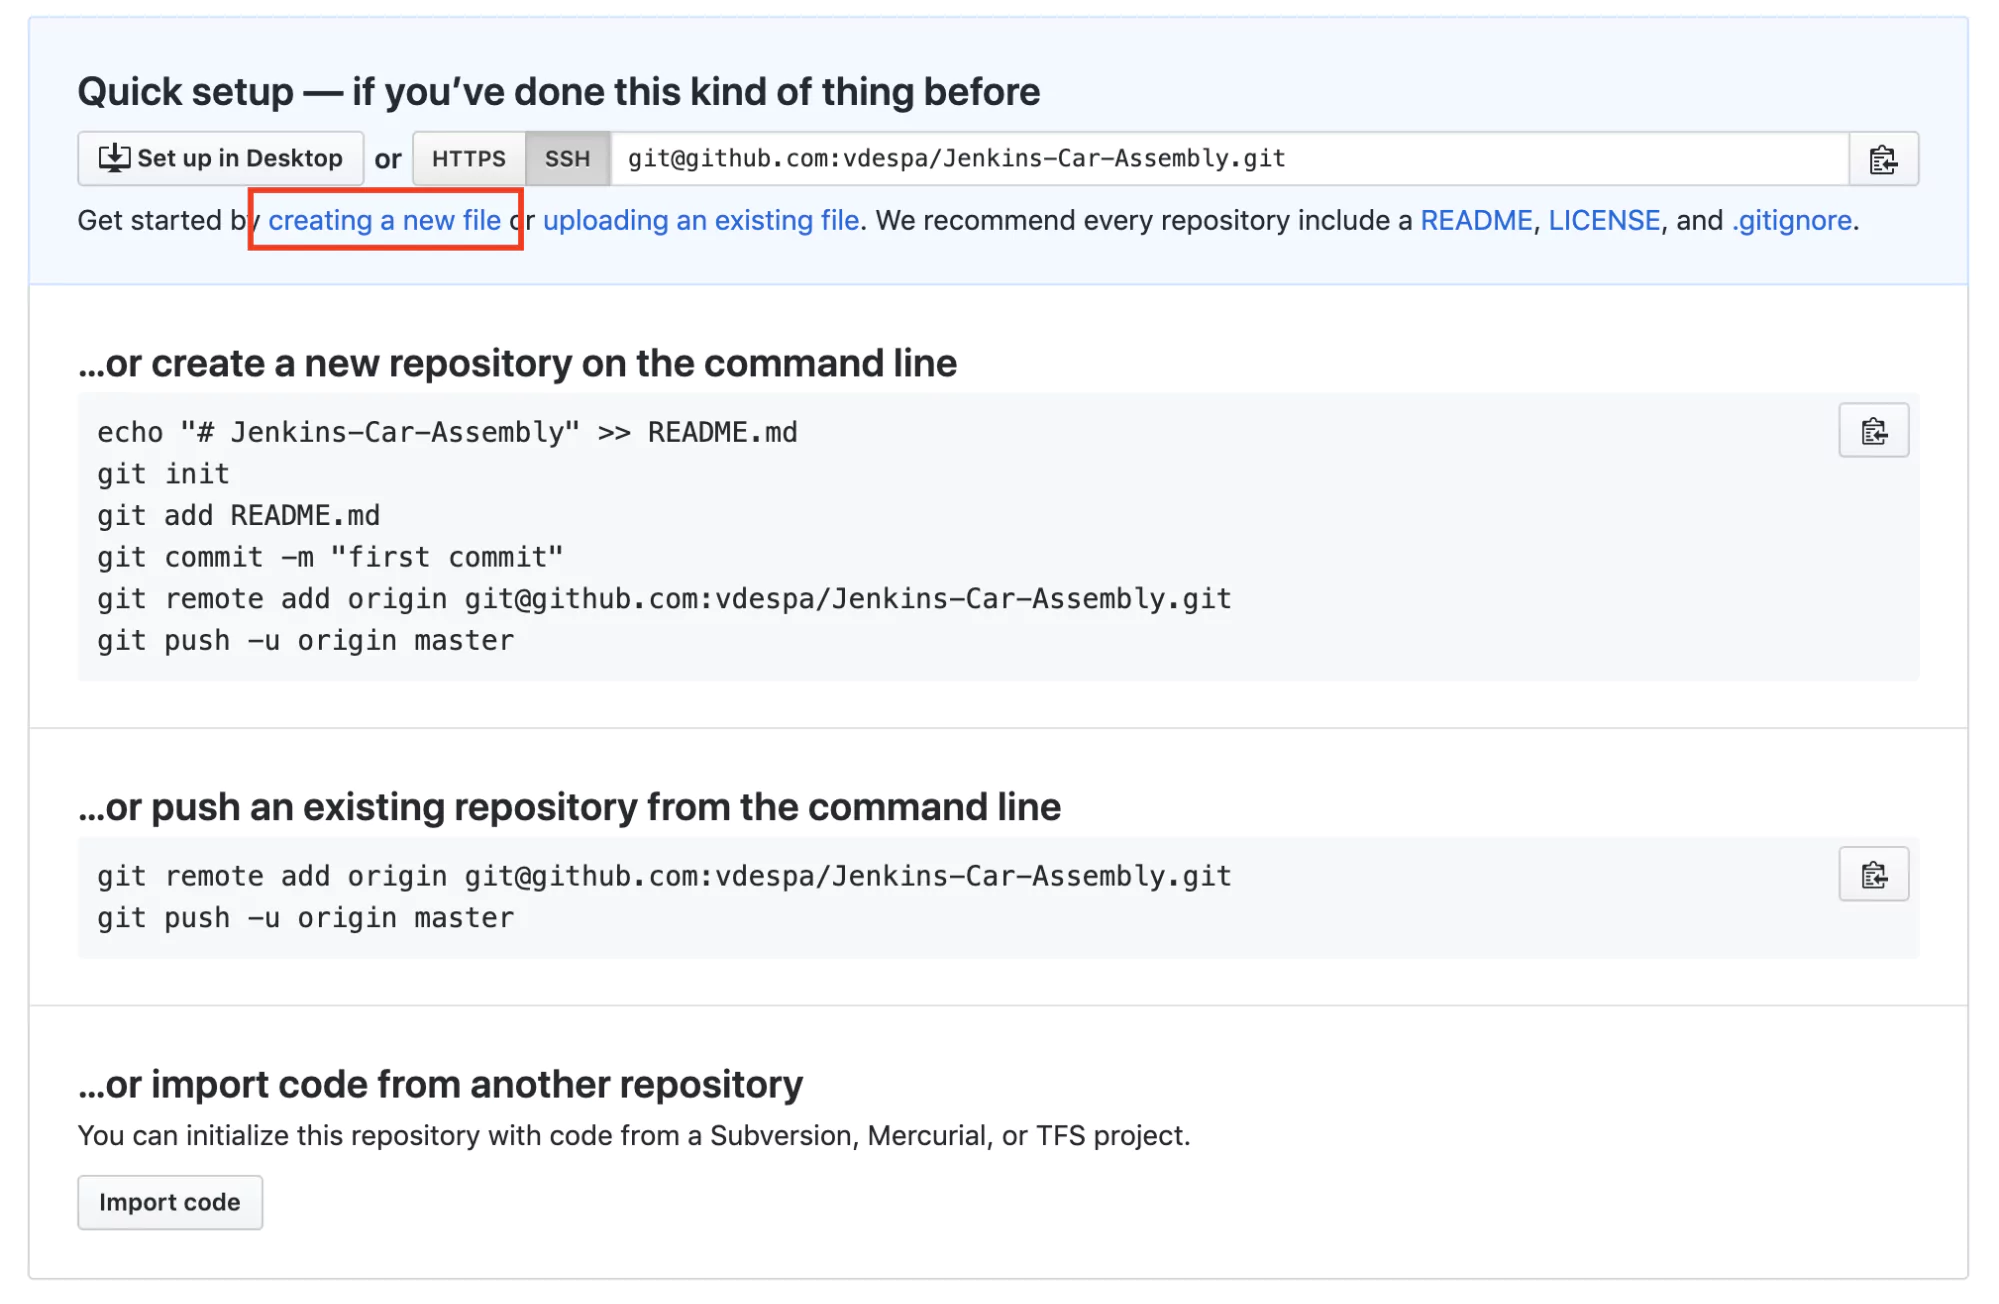
As you can observe, even for a relatively simple scenario, the pipeline is starting to grow in size and become harder to manage. Also, configuring the pipeline directly in Jenkins is cumbersome without a proper text editor. Moreover, any work colleagues with a Jenkins account can modify the pipeline, and we wouldn’t know what changed and why. There must be a better way! And there is. To fix this, we will create a new Git repository on Github.
To make things simpler, you can use this public repository under my profile called Jenkins-Car-Assembly.
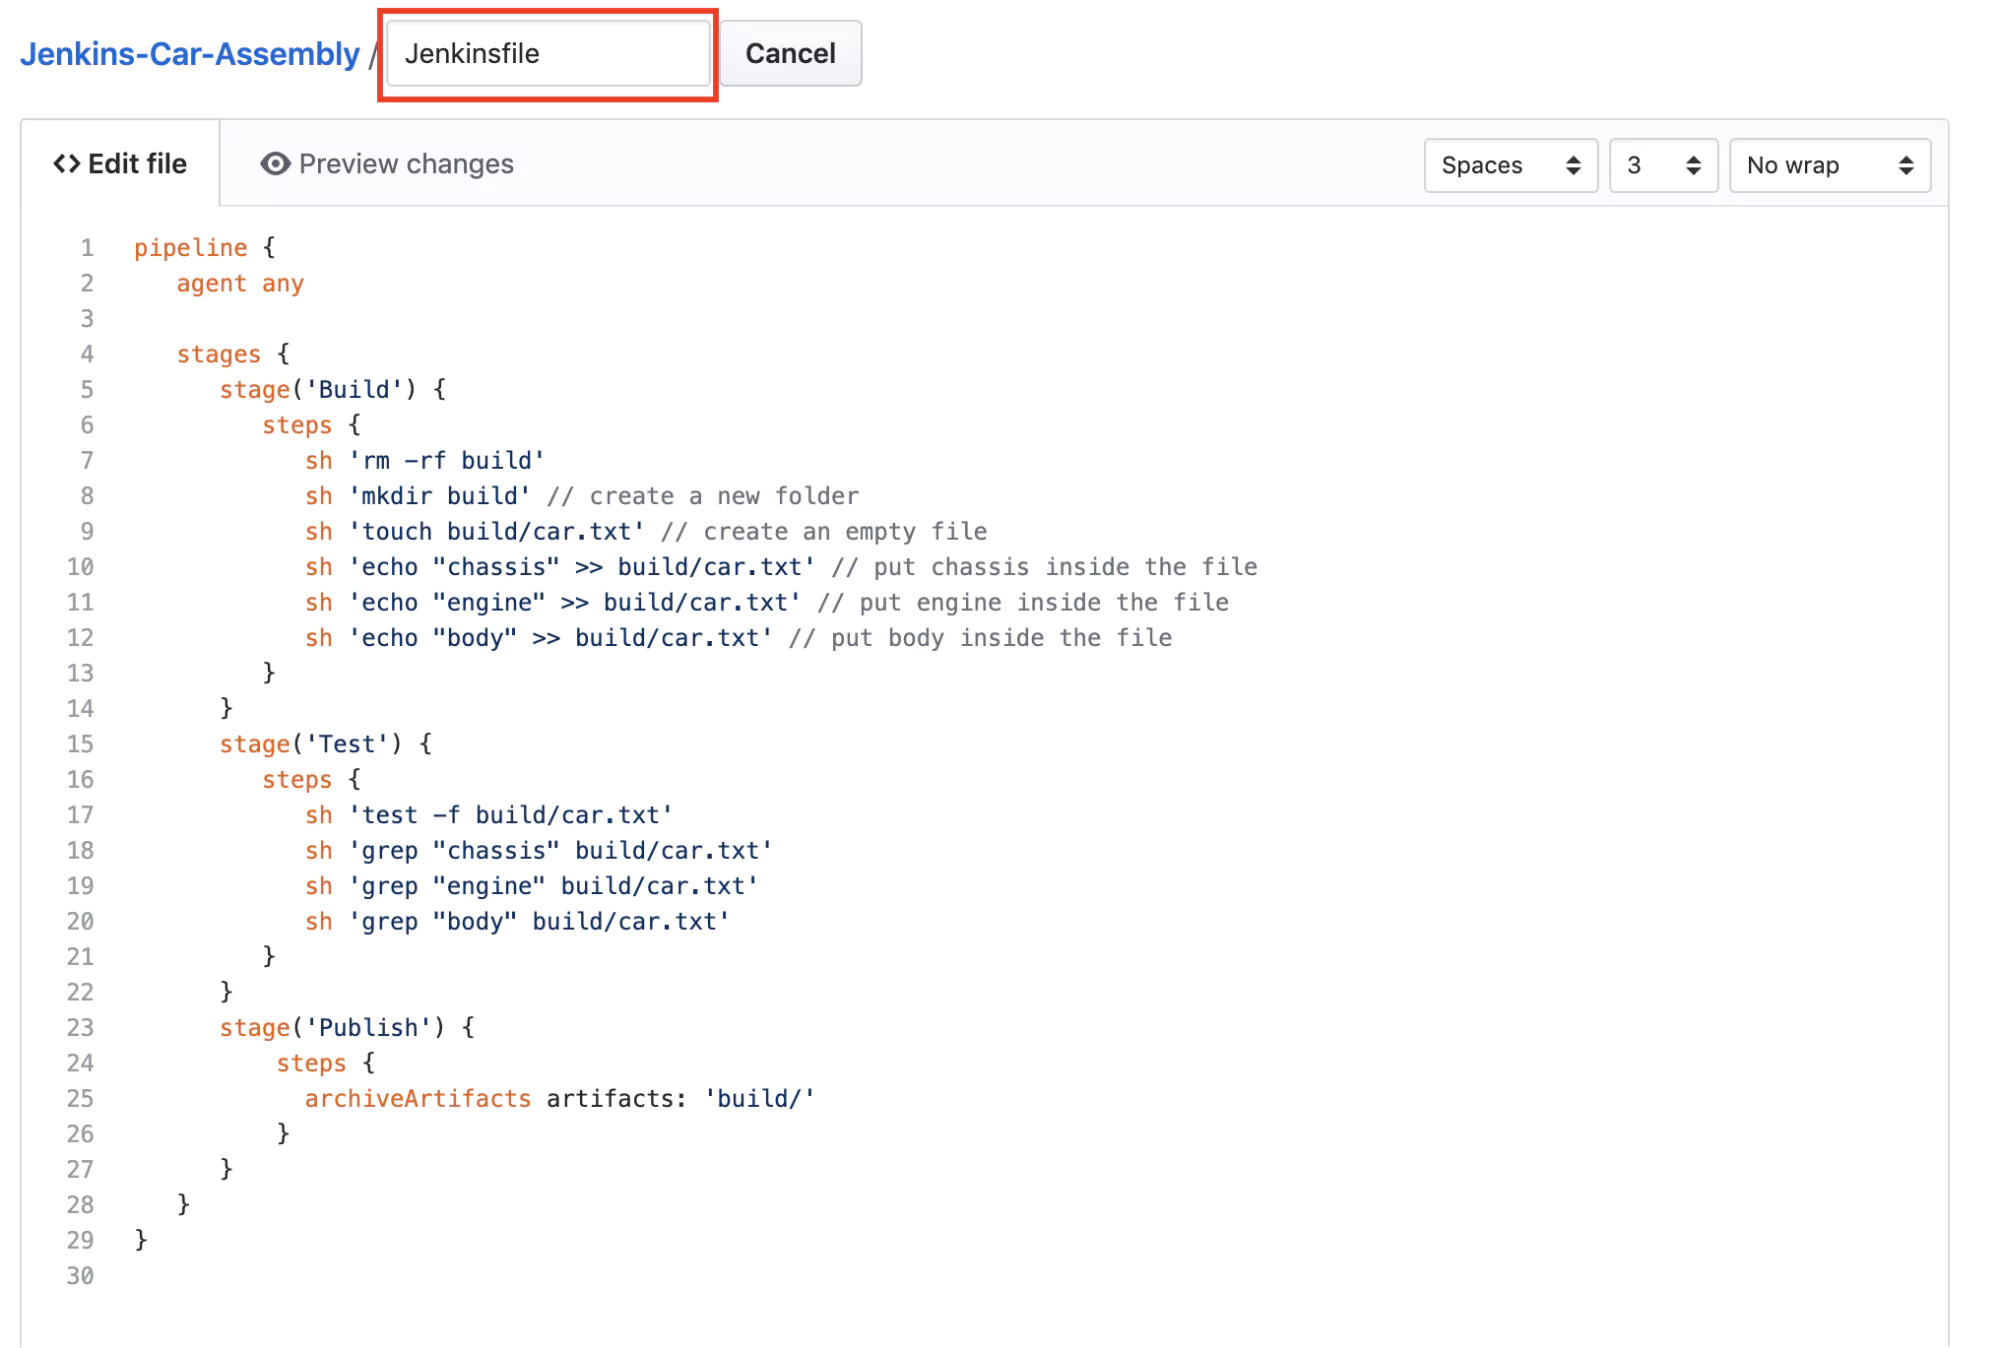
Jenkinsfile from a Version Control System
The next step is to create a new file called Jenkinsfile in your Github repository with the contents of the pipeline from Jenkins.
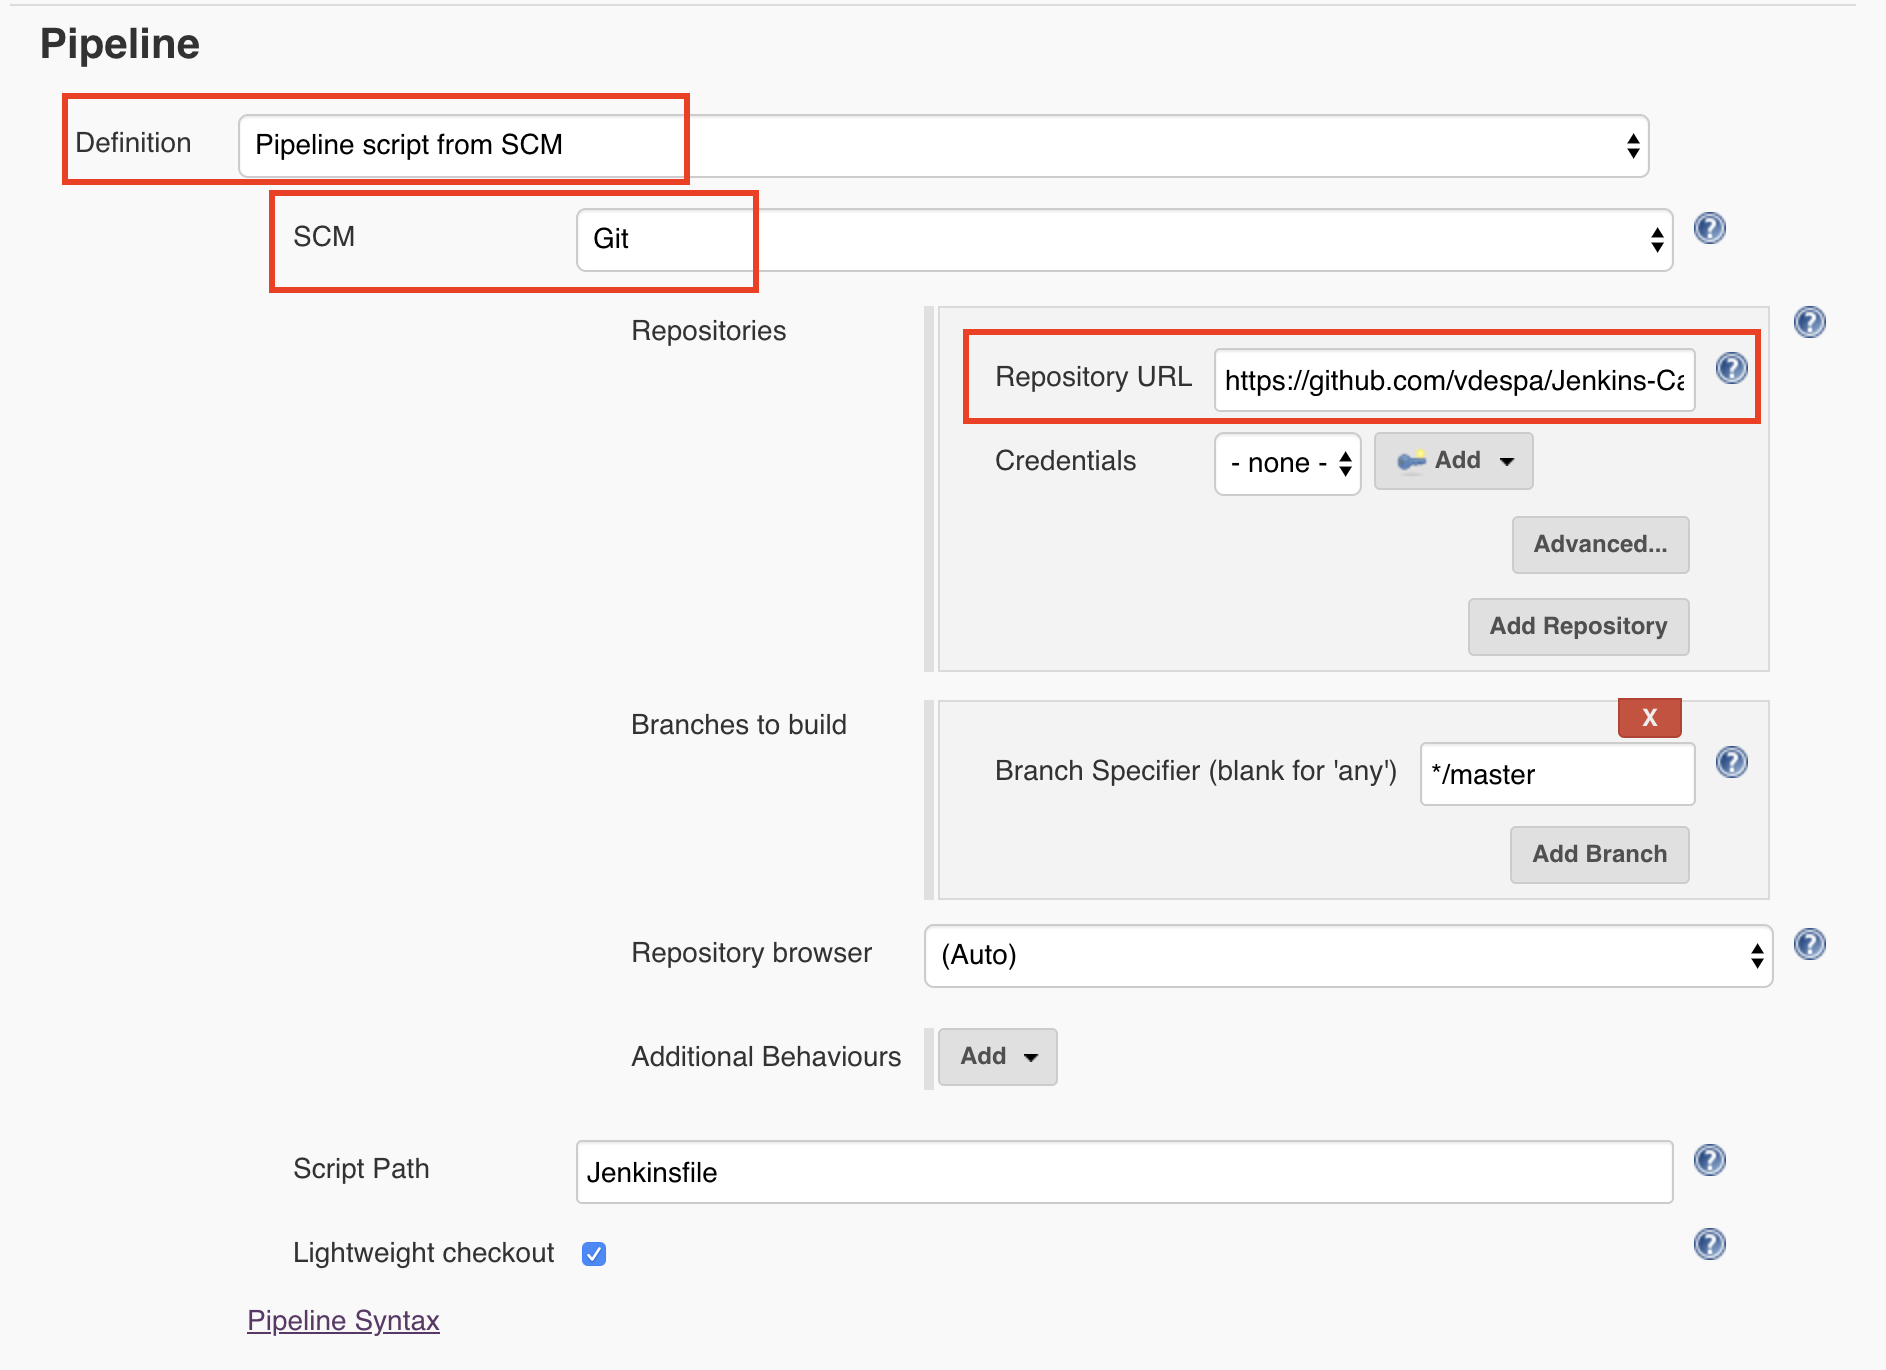
Read Pipeline from Git
Finally, we need to tell Jenkins to read the pipeline configuration from Git. I have selected the Definition as Pipeline Script from SCM which in our case, refers to Github. By the way, SCM stands for Source code management.
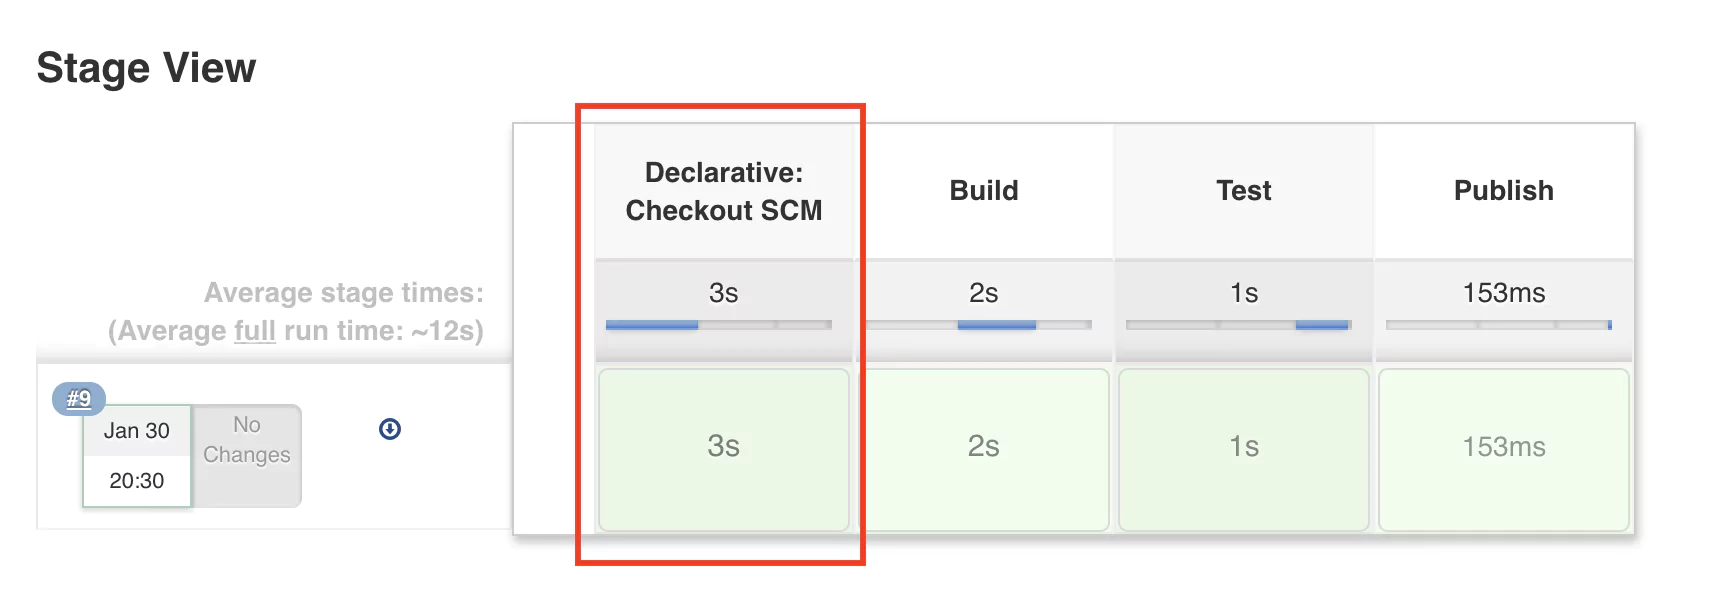
Saving and rerunning the pipeline leads to a very similar result.
So what happened? Now we use Git to store the pipeline configuration in a file called Jenkinsfile. This allows us to use any text editing software to change the pipeline but now we can also keep track of any changes that happen to the configuration. In case something doesn’t work after making a Jenkins configuration change, we can quickly revert to the previous version.
Typically, the Jenkinsfile will be stored in the same Git repository as the project we are trying to build, test, and release. As a best practice, we always store code in an SCM system. Our pipeline belongs there as well, and only then can we really say that we have a ‘pipeline as code’.
Conclusion
I hope that this quick introduction to Jenkins and pipelines has helped you understand what a pipeline is, what are the most typical stages, and how Jenkins can help automate the build and test process and ultimately deliver more value to your users faster.
For your reference, you can find the Github repository referenced in this tutorial here:
So much of our world has moved away from the slow and methodical, towards the agile and iterative. In transport, for example, everything is “on demand”, constantly changing and adaptable. The same is true for developers. With movements and philosophies such as CI/CD solutions, everything is about moving quickly, yet smartly.
Test automation is an integral part of this development philosophy. We’ll take a look at 3 popular test automation tools, and help you decide which one is the right fit for your organization.
The Importance of Test Automation
Before we jump into the 2 testing tools, a quick note on the importance of test automation. Automated testing frameworks can “help quality assurance engineers define, execute, and automate various types of tests that can help development teams know whether a software build passes or fails.” In the CI/CD environment, test automation literally becomes part of the continuous flow and cycles of development.
Let’s take a look at the 3 platforms:
Test.ai
Test.ai is a machine learning-based platform that has been trained to recognize common user scenarios and execute test cases. The platform leverages AI to identify the various screens and elements in your app, and to execute user scenarios to enable you to test on-demand whenever you’re ready. It also recognizes elements, so that things don’t break even when they change.
Test.ai is relatively quick and easy to set up, requires no programming knowledge for more basic functions, and the platform can execute tests even when the user interface or certain flows in the app change.
Even though the company has been around since October 2015, and has raised around $17m, there is a definite lack of quality peer reviews available. This is concerning as most companies of this size would have multiple reviews available, from different companies and roles, giving an indication of the level of robustness of the solution, as well as insights into which types of projects the platform is better suited to.
Test.ai claim “larger unnamed partners that ‘make app stores’ or devices…working at the stratospheric level having to verify tens of thousands of apps to ensure that everything is in working order”.
Testcraft.ai
Testcraft bills itself as “codeless Selenium with ai maintenance”, for automated manual testing with no framework or maintenance. It is primarily a platform for web apps, and is a complete SaaS solution, with a shallow learning curve (and no coding required).
Its automation platform includes regression and continuous testing capabilities, a drag-and-drop interface, and the ability to run tests on multiple browsers and work environments at the same time. TestCraft promises faster test creation, execution, and maintenance, through its dynamic test model that can be updated to reflect changes to your app. Its interface is simple and easy to use.
Areas, where there could be an improvement, are an occasional lack of responsiveness, some issues with urls from outside of the app itself, changing datasets can be confusing, and there are quite a few bugs that still need to be ironed out.
Testim.io
Testim.io leverages machine learning for the authoring, execution, and maintenance of automated test cases. The platform uses dynamic locators and learns with every execution. The outcome is super fast authoring and stable tests that actually learn and improve, eliminating the need to continually maintain tests with every code change.
Well known companies such as Netapp, Verizon Wireless, Wix.com, and others run over 500,000 tests every month using Testim.io. The platform has gained acclaim for significantly shortening the time from development to production, to minutes in some cases. It allows the testing of new features with full regression test coverage. Test stability is known to be high, with easy-to-understand results. The platform is also easy to connect to your chosen CI and discover and fix bugs, with helpful screenshots along the way. Customer support is known to be excellent.
But, there are some issues that have been brought up for improvement, such as image verification, but these are being dealt with according to company communications, and barely detract from what is otherwise an excellent product.
Comparison
Most reviews conclude with some form of a “we cannot recommend one product, it all depends on your needs”. In this case, however, we have found testim.io to be a top performer in most categories, and feel compelled to recommend it.
This choice is further enhanced by the numerous positive reviews and big names using the platform.
Continuous Improvement
When it comes to continuous integration and continuous delivery, areas like automated testing and automated log insights become essential, integrated tools – not merely welcome additions.
For machine learning-powered log analytics, look no further than Coralogix. With Coralogix, you get virtually endless seamless integrations, dashboards and live streams, view hours of data in seconds and get automated insights into any log issues. CI/CD has found the perfect log partner.
The way we think about development and CI/CD solutions started with Waterfall – sequential, solid, conservative – moved to Agile, whose origins can be traced back to a somewhat romantic story at a ski resort in Utah, and is now heavily influenced by DevOps.
This progression, from a stage-by-stage process that often meant reaching the “end” of a project only to begin the herculean task of debugging, then to a world of Scrums and sprints, and finally to a full DevOps culture, has led to the adoption of Continuous Integration.
What is CI?
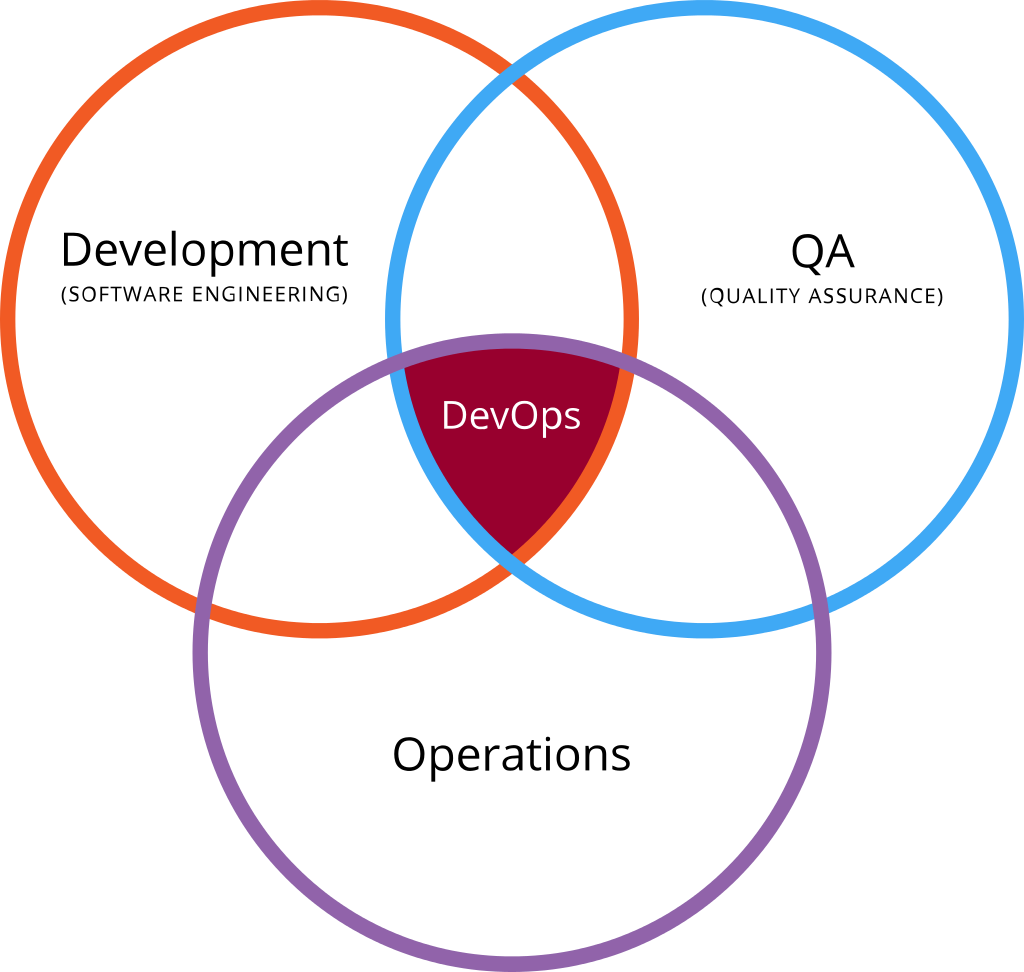
This new approach is consistent with the values of collaboration, quicker release cycles, and the integrated disciplines of development, QA, and Operations.
Continuous Integration solutions (related to Continuous Delivery and Continuous Deployment) is a development practice where developers integrate code into a shared repository regularly, often several times a day. These check-ins are verified by an automated build, which allows teams to detect problems early.
Through this regular approach, errors can be detected quickly, located more easily, last-minute pre-release chaos is averted, the most current build is always available, feedback on changes is immediate – with all of this saving time, money, and other resources, and contributing to a more efficient organizational culture.
While there are caveats; the CI approach may not be efficient for smaller projects, the automated test suite may require a significant cost/time investment, and larger teams may encounter queueing issues, overall this method is seen by many as the most valuable of all the software development practices today.
We’ll look at 2 popular CI platforms, to help decision makers when it comes time to choose the right one for different projects or organizations.
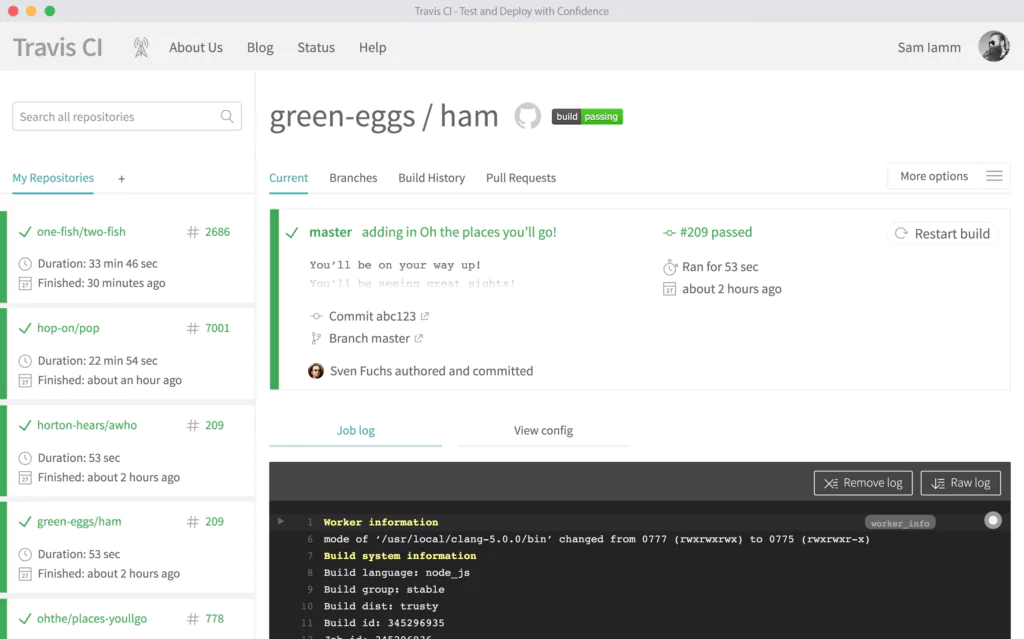
Travis CI
Travis CI is a hosted distributed continuous integration service used to build and test software, and is known for its easy integrations and quick setup.
Originally designed for open source projects (and still free for these), Travis CI has now expanded to closed source projects.
Travis bills itself as “The simplest way to test and deploy your projects”. This is not far from the truth, as using Travis CI can be as easy as logging in with GitHub, instructing Travis CI to test a project, and then pushing to GitHub.
When you run a build, Travis CI clones your GitHub repository into a new virtual environment. It then carries out a series of tasks to build, and then test, your code. If none of these tasks fail, the build is considered passed (well done!), and Travis CI is able to deploy your code. If one of these tasks fails, the build is considered broken.
You can have Travis watch tests as they run and easily integrate with tools like Slack to keep your team up-to-date with any build issues.
More details about builds, jobs, stages, and phases can be found in the documentation depository. The Travis CI documentation is generally excellent, providing guidance and advice to experts and novices alike.
Travis CI supports most programming languages, including Android, C, C#, C++, Clojure, Crystal, Dart, Erlang, Elixir, Go, Groovy, Haskell, Haxe, Java, JavaScript (with Node.js), PHP, Python, Ruby, Scala and Visual Basic.
Complaints from users about Travis CI often refer to clunky UI, slowness at times, and the relatively steep pricing for the paid version.
In terms of Circleci pricing, the first 100 builds are free, no matter what plan you’re on. As mentioned, open source projects are always free, and closed source projects are billed based on the number of concurrent jobs, from the Bootstrap package at $69 per month (1 concurrent job), to the Premium package at $489 a month (10 concurrent jobs). All packages come with unlimited build minutes, unlimited repositories and unlimited collaborators.
There is also an enterprise option, an on-premises product for companies wanting the regular features of Travis CI, but with additional on-site security needs.
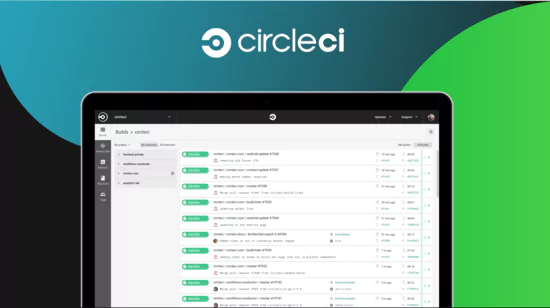
CircleCI
Like Travis, CircleCI is a continuous integration and delivery platform that automates the software development process and is used by the likes of Facebook, Kickstarter, and Spotify.
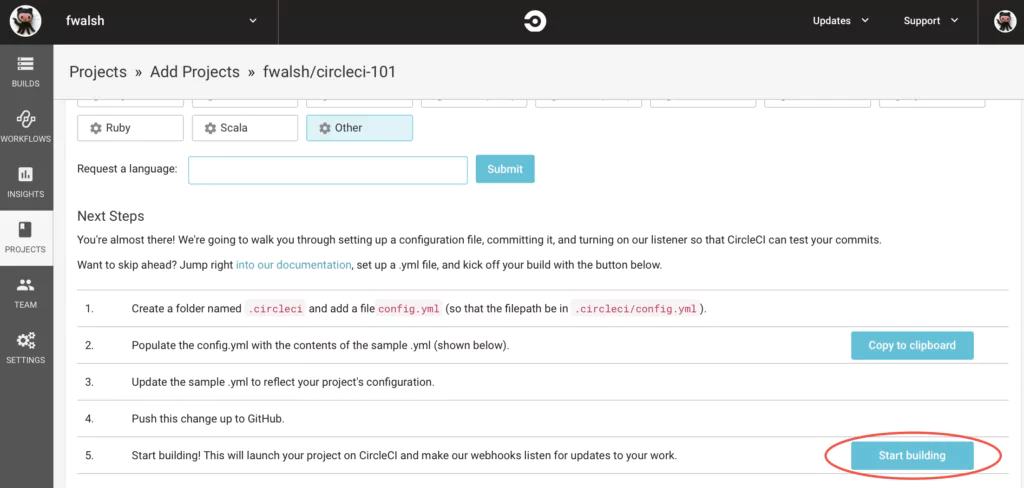
CircleCI integrates with GitHub, GitHub Enterprise, and Bitbucket, creating a build every time you commit code It then automatically tests your build in a clean container or virtual machine, notifying you of build fails that issues can be addressed as quickly as possible. Once a build has passed, it is deployed to various environments.
Other integrations include Fastlane, Azure, Jira, Slack, and many others depending on an organization’s specific needs, and is known for its Docker support.
CircleCI can be hosted on the cloud or run behind a firewall on an organization’s private infrastructure. Any language that builds on Linux or macOS is supported, including C++, Javascript, .NET, PHP, Python, and Ruby. CircleCI also emphasizes their security credentials, including LDAP for user management, full-level virtual machine isolation, and audit logging.
In terms of user feedback, many users prefer the config set up in Travis, a confusing dashboard, and there have been complaints of slowness but this is probably project-dependent.
Pricing is offered as a cloud plan or a server plan. On the cloud plan, Linux is billed per container, with the first container being free, and each additional container is costing $50 a month. For macOS, pricing is calculated based on concurrency and build minutes and starts at $39 a month. The server plan is priced at $35 per user per month, with a 10 user minimum.
Comparison
Choosing the right tool will depend on factors such as your chosen programming language and application architecture, your team’s skills, experience and preferences, and your roadmap in terms of growth and scaling.
CircleCI has a whole page dedicated to its advantages over Travis CI, and while many points are valid, there are some Travis CI advantages that are not presented.
Right now, Travis CI seems to have the edge when it comes to open-source or smaller projects, while CircleCI is generally seen to be the better option for larger teams and projects. Both, however, have been successfully used in large and small projects, and in this case, the desired option will probably come down to personal preference.
In today’s competitive world of software development, one of the key factors for a company’s success is the R&D capability of releasing and monitoring multiple high quality versions in order to provide top notch services to their customers.
With software systems becoming more complex and distributed, the need for version delivery and software monitoring grew. This caused an explosion of new startup companies targeting these markets. With these new companies, came various solutions for the different stages of the development and delivery process of software systems. These solutions attempt to enhance and make these stages more efficient.
Roughly, this quality cycle can be divided into 5 main sections. Below, we’ll walk you through the essence of each stage and share a few tools that stand out.
Static code analysis: A static code analysis tool checks the source code in order to verify compliance with the predefined rules and best practices set by the tool provider per coding language. Static code analysis is great for preemptively detecting code defects and inconsistencies especially in large code bases with newly created and legacy code.
Code analysis tools worth mentioning:
KlockworkInsight: a thorough static code analysis solution for various purposes that detects vulnerabilities and defects on the fly while you code.
Checkmarx: A security oriented code analysis tool that helps identifying, tracking and fixing technical and logical security flaws from the root. Checkmarx provides a broad support for various coding languages
Parasoft: A strong rule based code analysis, with integrations to automation and load testing, which allows the building of an E2E flow – supports C#, Java, C++.
QA automation: QA automation is a powerful supplement to manual QA testing. It ensures a thorough test procedure and verifies behavioral consistencies. QA automation tools are able to playback pre-recorded actions, compare the results to the defined expected behavior and report success or failure to the QA engineer. After a small investment of creating these automated tests, they can be easily repeated and perform testing tasks that are impossible for manual testers.
QA automation tools worth mentioning:
Ranorex: A testing platform for Web, Desktop and mobile applications, capable of testing UI, Data driven tests, and functional tests. Provides a unified dashboard with the test results.
LoadRunner: One of the firsts in the market – a performance oriented automation tool that detects bottlenecks across the E2E flow.
Selenium: An open source project for browser automation, which provides various adjustable tools for recording and executing test on web platforms.
As selenium alone is not considered to be very intuitive, we recommend trying browser automation tools that rely on selenium engine, for example: the great https://www.testim.io solution.
Continuous delivery: Continuous delivery is a novel approach that is aimed to help large organizations become as lean and agile as startups and be able to adapt their software in line with user feedback. By releasing multiple small versions, companies can improve their quality and customer satisfaction dramatically and in case of need even shift business focus.
Continuous delivery tools worth mentioning:
Jenkins: a continuous delivery enabler that provides both a continuous integration system, which allows developers to easily integrate changes into their project, and monitoring capabilities for externally running jobs (even on remote machines)
Travis: A Github oriented solution, although not as flexible as Jenkins, relies on common practices to enable a very simple integration (1 file in the root of your code), which makes the continuous integration and delivery almost seamless. If you are not using Github, Travis is probably not the tool for you.
Bamboo: a paid service (unlike the other tools listed in this category), which provides a very simple integration and user interface, but lacks the flexibility and plug-in variety of Jenkins.
APM – Application performance monitoring: 2 critical parts of the quality chain are the application performance and the application availability. APM tools integrate with software systems and understand the system’s infrastructure to detect availability issues, slow response times and other performance oriented problems.
APM tools worth mentioning:
New Relic: New relic provides a deep view into the system, with real time performance and availability overview, real time alerting mechanism, and an API for personal custom performance monitoring apps
Datadog: DataDog provides a search and visualization mechanism that allows the user to drill into the heaps of data collected by DataDog. In addition, DataDog also offer a way to overlay data of different sources in order to find correlations between separate components (e.g web server & web application)
Raygun: Raygun is a more disaster-oriented tool. Once an application crashes, Raygun collects the exceptions and crash reports and alerts its users.
Log Analytics & Management : This is an emerging market with huge demand. Log Analytics & Log Management tools enable the development, QA, and operations to get a hold of their log data and understand the system that flows from it. Moreover, Log Analytics & Management tools are crucial for monitoring production systems and understanding the root cause of software problems.
Splunk: Splunk is a powerful tool that can index and visualize an entire organization, from various IT services to any machine data, which is being emitted from its customer’s servers. Splunk works in an unstructured manner and is agnostic to the data that is being sent to it. Splunk offer both SaaS (Splunk Storm) and on premise services.
Sumo Logic: SumoLogic offers a Log Analytics solution that is in many ways very close to Splunk. On top of the log collection and indexing capabilities, SumoLogic offers its “LogReduce” feature to aggregate log query results, and transactions tracking capabilities
Logentries: Logentries is a relatively new player in the market of Log Analytics & Management, which brings a fresh approach towards the integration process with simple plug-ins. In terms of Analytic capabilities, it does not bring too many new capabilities to the table besides the log tagging mechanism that can be helpful if you have a small defined set of logs generated from your software.
Coralogix brings a new actionable approach to the Log Analytics & Management. By analyzing every log that is generated by the software, Coralogix learns the system’s flow, automatically detects broken Log patterns, and provides their root cause in a single click. Coralogix finds the patterns of broken vs. correct behavior and returns a few log entries, which is a lot more manageable than the millions of log entries that Log Analytics users have to deal with today.
To get a 1/1 online demo of Coralogix and join the growing movement of companies that are shifting towards meaningful results in the world of Log Analytics & Management, simply “Book a demo” .
Be Our Partner
Complete this form to speak with one of our partner managers.
Thank You
Someone from our team will reach out shortly. Talk to you soon!
 The new standard of observability is here. Discover Olly, the industry’s first