3 Metrics to Monitor When Using Elastic Load Balancing

One of the benefits of deploying software on the cloud is allocating a variable amount of resources to your platform as needed. To do this, your platform must be built in a scalable way. The platform must be able to detect when more resources are required and assign them. One method of doing this is the Elastic Load Balancer provided by AWS. 

Elastic load balancing will distribute traffic in your platform to multiple, healthy targets. It can automatically scale according to changes in your traffic. To ensure scaling has appropriate settings and is being delivered cost-effectively, developers need to track metrics associated with the load balancers. 

Available Elastic Load Balancers

AWS elastic load balancers work with several AWS services. AWS EC2, ECS, Global Accelerator, and Route 53 can all benefit from using elastic load balancers to route traffic. Monitoring can be provided by AWS CloudWatch or third-party analytics services such as Coralogix’s log analytics platform. Each load balancer available is used to route data at a different level of the Open Systems Interconnection (OSI) model. Where the routing needs to occur strongly determines which elastic load balancer is best-suited for your system.

Application Load Balancers

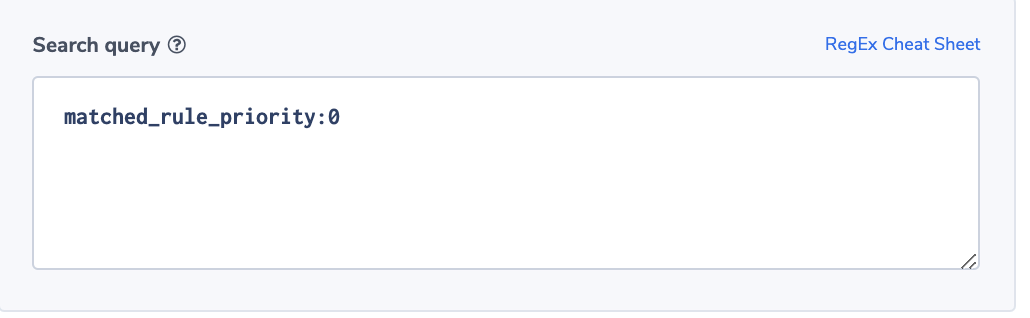
Application load balancers, route events at the application layer, the seventh and highest layer of the OSI model. The load balancer component becomes the only point of contact for clients so it can appropriately route traffic. Routing can occur across multiple targets and multiple availability zones. The listener checks for requests sent to the load balancer, and routes traffic to a target group based on user-defined rules. Each rule includes a priority, action, and one or more conditions. Target groups route requests to one or more targets. Targets can include computing tasks like EC2 instances or Fargate Tasks deployed using ECS.

Developers can configure checks for target health. If this is in place, the load balancer will only be able to send requests to healthy targets, further stabilizing your system when a sufficient number of registered targets are provided.

Classic Load Balancers

Classic load balancers distribute traffic for only EC2 instances working on the transport and application OSI layers. The load balancer component is the only point of contact for clients, just as it is in application load balancers. EC2 instances can be added and removed as needed without disrupting request flows. The listener checks for requests sent to the load balancer and sends them to registered instances using a user-configured protocol and port values.

Classic load balancers can also be configured to detect unhealthy EC2 instances. They can route traffic only to healthy instances, stabilizing your platform.

Network Load Balancers

Network load balancers route events at the transport layer, the fourth layer of the OSI model. It has a very high capacity to scale requests and allows millions of requests per second. The load balancer component receives connection requests and selects targets from the user-defined ruleset. It then will open connections to selected targets on the port specified. Network load balancers handle TCP and UDP traffic using flow hash algorithms to determine individual connections.

The load balancers may be enabled to work within a certain availability zone where targets can only be registered in the same zone as the load balancer. Load balancers may also be registered as cross-zone where traffic can be sent to targets in any enabled availability zone. Using the cross-zone feature adds more redundancy and fault tolerance to your system. If targets in a single zone are not healthy, traffic is automatically directed to a different, healthy zone. Health checks should be configured to monitor and ensure requests are sent to only healthy targets.

Gateway Load Balancers

Gateway load balancers, route events at the network layer, the third layer of the OSI model. These load balancers are used to deploy, manage and scale virtual services like deep packet inspection systems and firewalls. They can distribute traffic while scaling virtual appliances with load demands.

Gateway load balancers must send traffic across VPC boundaries.They use specific endpoints set up only for gateway load balancer to accomplish this securely. These endpoints are VPC endpoints that provide a private connection between the virtual appliances in the provider VPC and the application servers in the consumer VPCs. AWS provides a list of supported partners that offer security appliances, though users are free to configure using other partners. 

Metrics Available

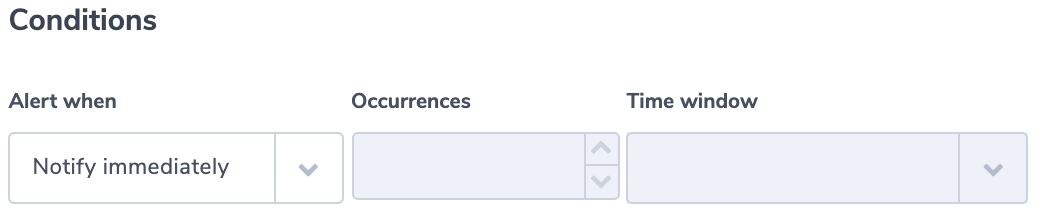
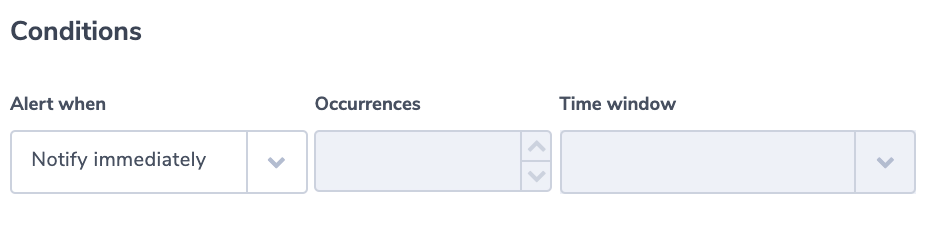
Metrics are measured on AWS every 60 seconds when requests flow through the load balancer. No metrics will be seen if the load balancer is not receiving traffic. CloudWatch intercepts and logs the metrics. You can create manual alarms in AWS or send the data to third-party services like Coralogix, where machine learning algorithms can provide insights into the health of your endpoints. 

Metrics are provided for different components of the elastic load balancers. The load balancer, target, and authorization components have their own metrics. This list is not exhaustive but contains some of the metrics considered especially useful in observing the health of your load balancer network.

Load Balancer Metrics

These metrics are all for statistics originating from the load balancers directly and do not include responses generated from targets which are provided separately. 

Statistical Metrics

Load balancer metrics show how the load balancer endpoint component is functioning. 

  • ActiveConnectionCount: The number of active TCP connections at any given time. These include connections between the client and load balancer as well as between load balancer and target. This metric should be watched to make sure your load balancer is scaling to meet your needs at any given time.
  • ConsumedLCUs: The number of load balancer capacity units used at any given time. This determines the cost of the load balancer and should be watched closely to track associated costs.
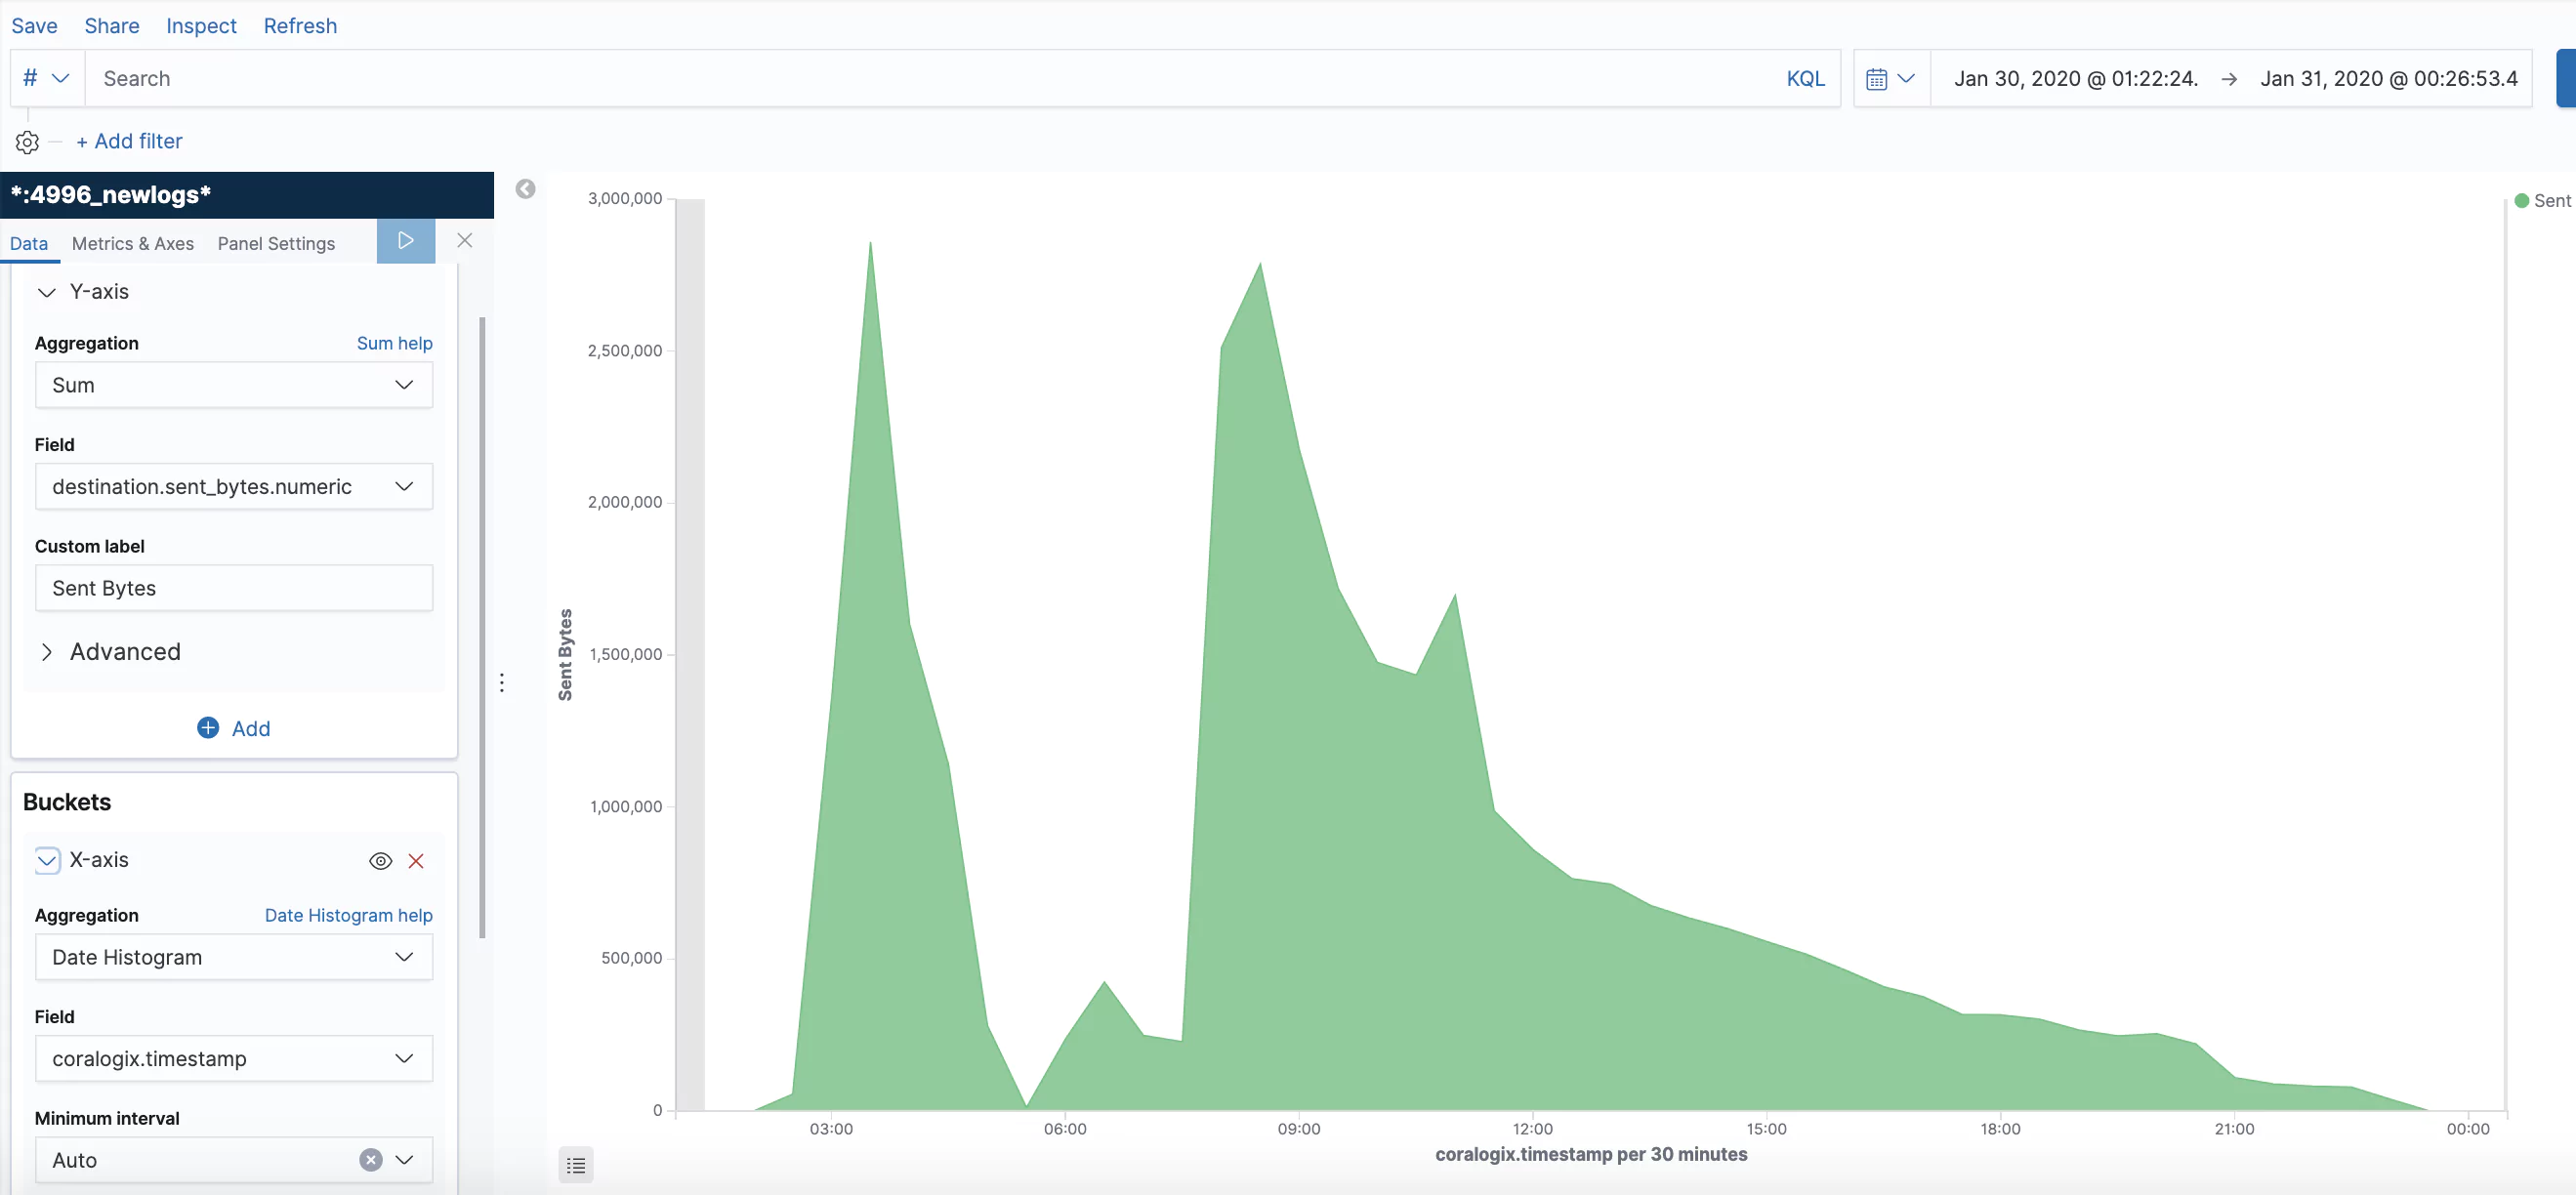
  • ProcessedBytes: The number of bytes the load balancer has processed over a period of time. This includes traffic over both IPv4 and IPv6 and includes traffic between the load balancer and clients, identity providers, and AWS Lambda functions.

HTTP Metrics

AWS provides several HTTP-specific metrics for each load balancer. Developers configure rules that determine how the load balancer will respond to incoming actions. Some of these rules will generate unique metrics so teams can count the number of events that trigger each rule type. The numbered HTTP metrics are also available from targets.

  • HTTP_Fixed_Response_Count: Fixed response actions return custom HTTP response codes and can include a message optionally. This metric is the number of successful fixed-response actions over a given period of time. 
  • HTTP_Redirect_Count: Redirect actions will redirect client requests from the input URL to another. These can be temporary or permanent, depending on the setup. This metric is the number of successful redirect actions over a period of time.
  • HTTP_Redirect_Url_Limit_Exceeded_Count: The redirect response location is returned in the response’s header data and has a maximum size of 8K Bytes. This error metric will log the number of redirect events that failed because the URL exceeded this size limit. 
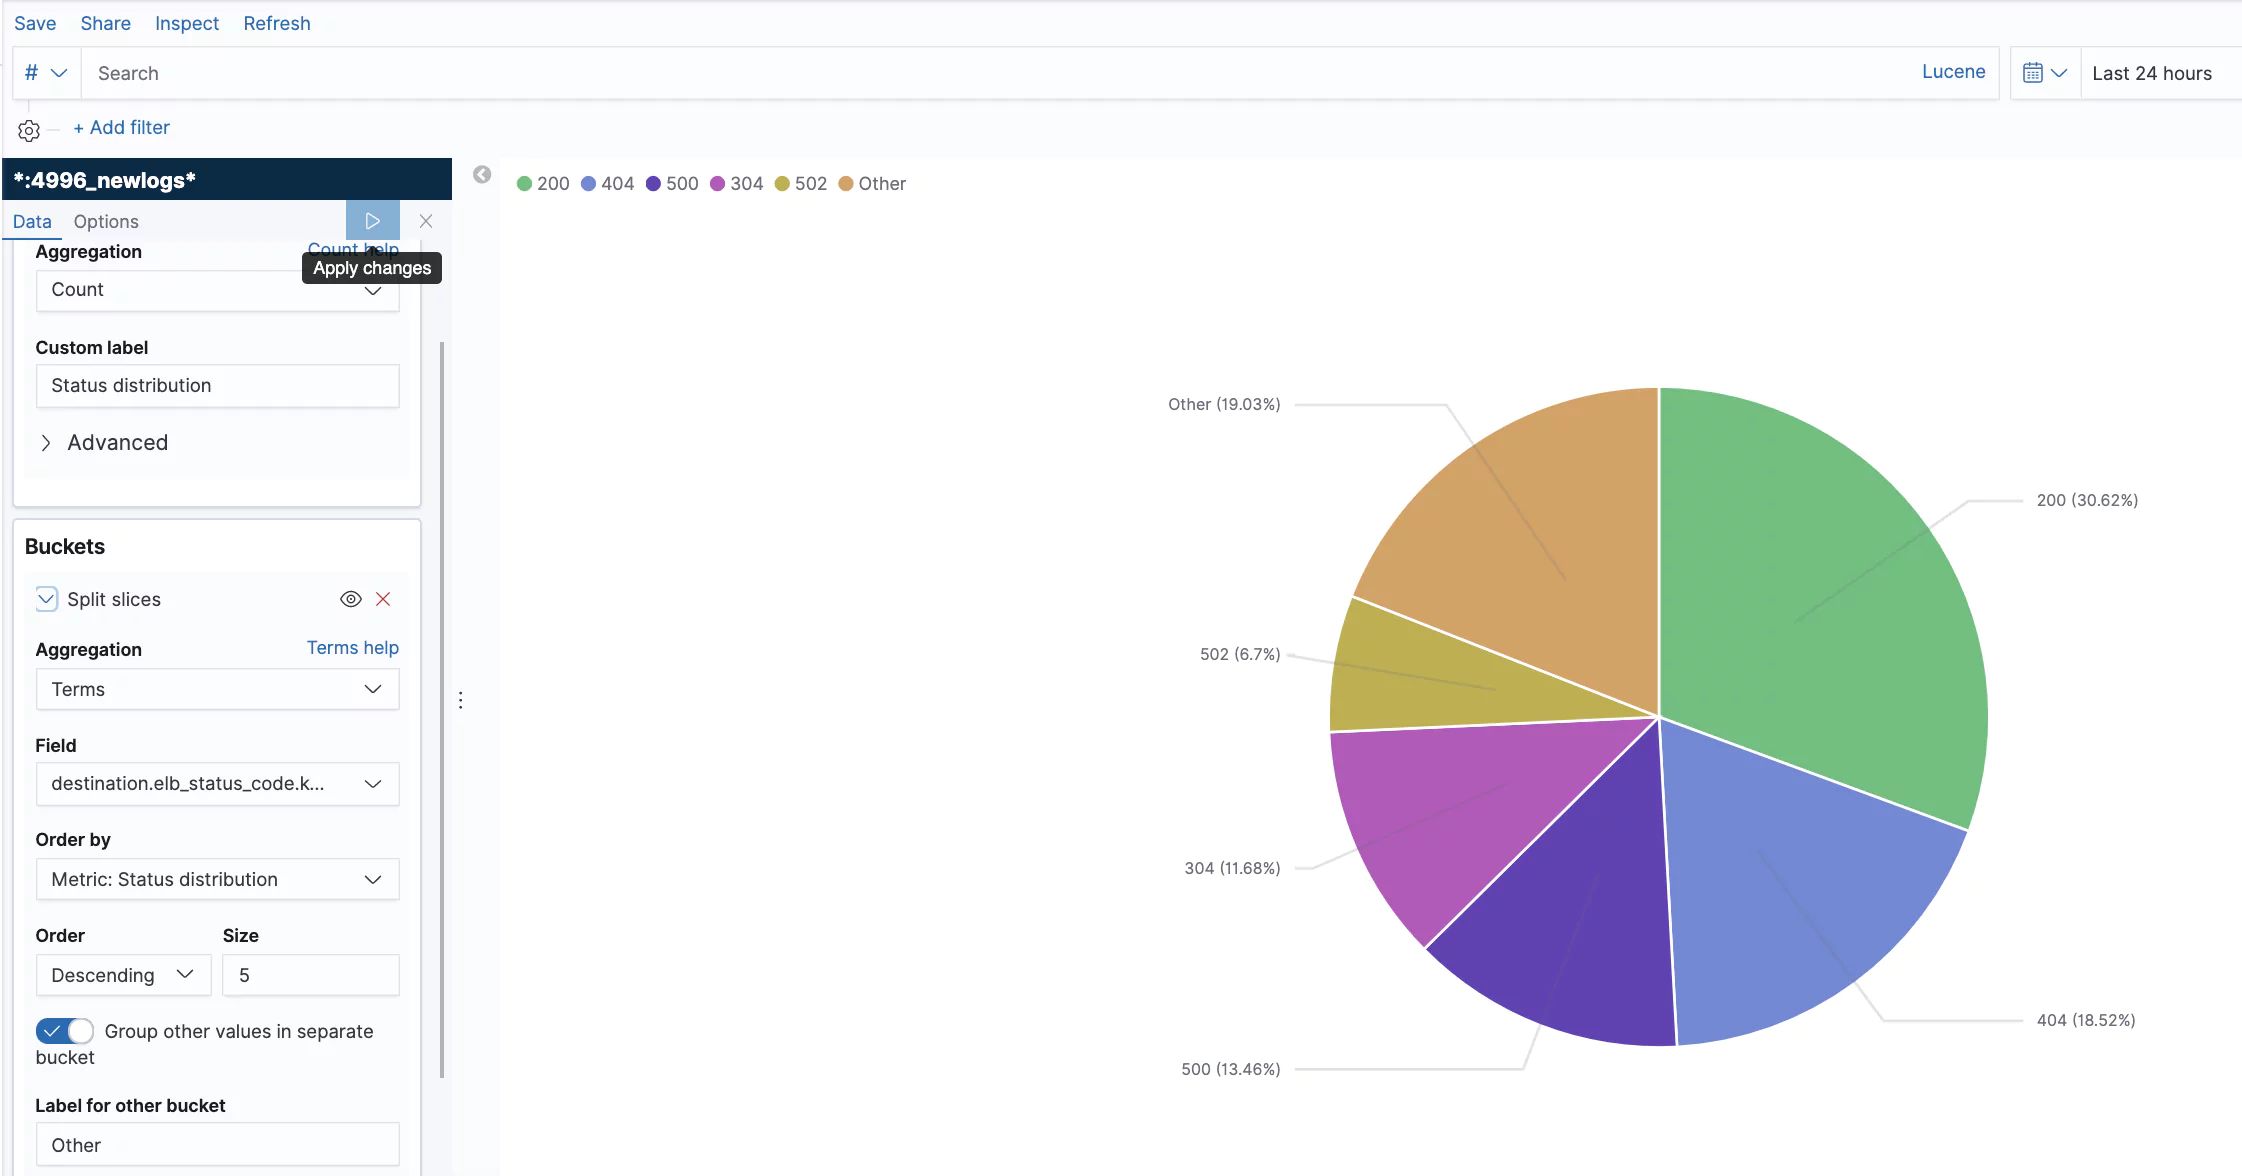
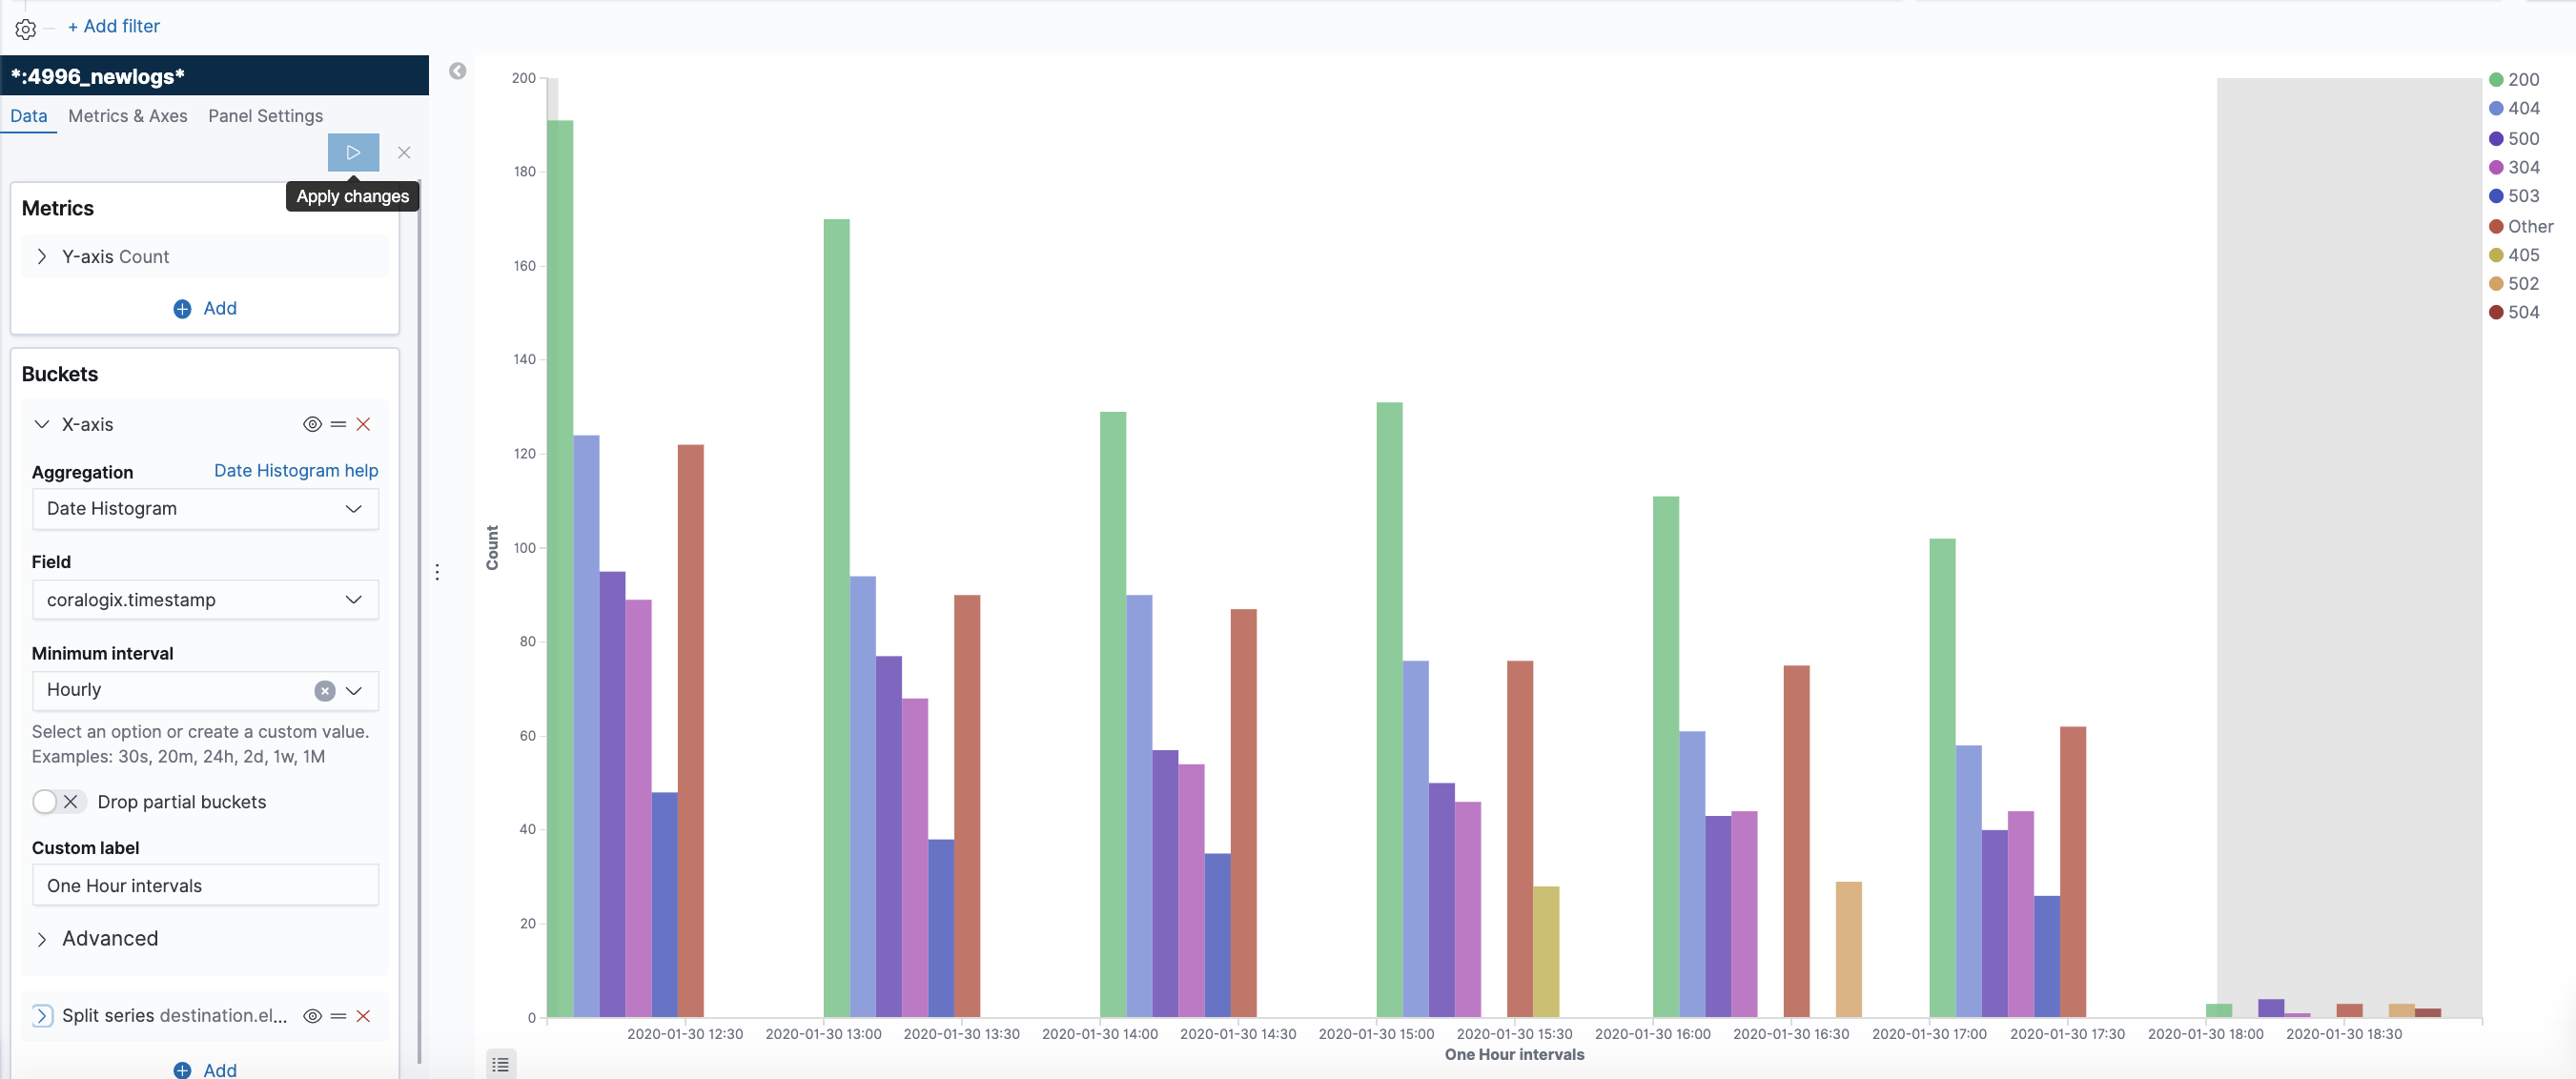
  • HTTPCode_ELB_3XX_Count: The number of redirect codes originating from the load balancer. 
  • HTTPCode_ELB_4XX_Count: The number of 4xx HTTP errors originating from the load balancer. These are malformed or incomplete requests that the load balancer could not forward to the target. 
  • HTTPCode_ELB_5XX_Count: The number of 5xx HTTP errors originating from the load balancer. Internal errors in the load balancer cause these. Metrics are also available for some specific 5XX errors (500, 502, 503, and 504). 

Error Metrics

  • ClientTLSNegotiationErrorCount: The number of connection requests initiated by the client did not connect to the load balancer due to a TLS protocol error. Issues like an invalid server certificate could cause this.
  • DesyncMitigationMode_NonCompliant_Request_Count: The number of requests that fail to comply with HTTP protocols

Target Metrics

Target metrics are logged for each target sent traffic from the load balancer. Targets provide all the listed HTTP code metrics provided for load balancers and those listed below.

  • HealthHostCount: The number of healthy targets linked to a load balancer.
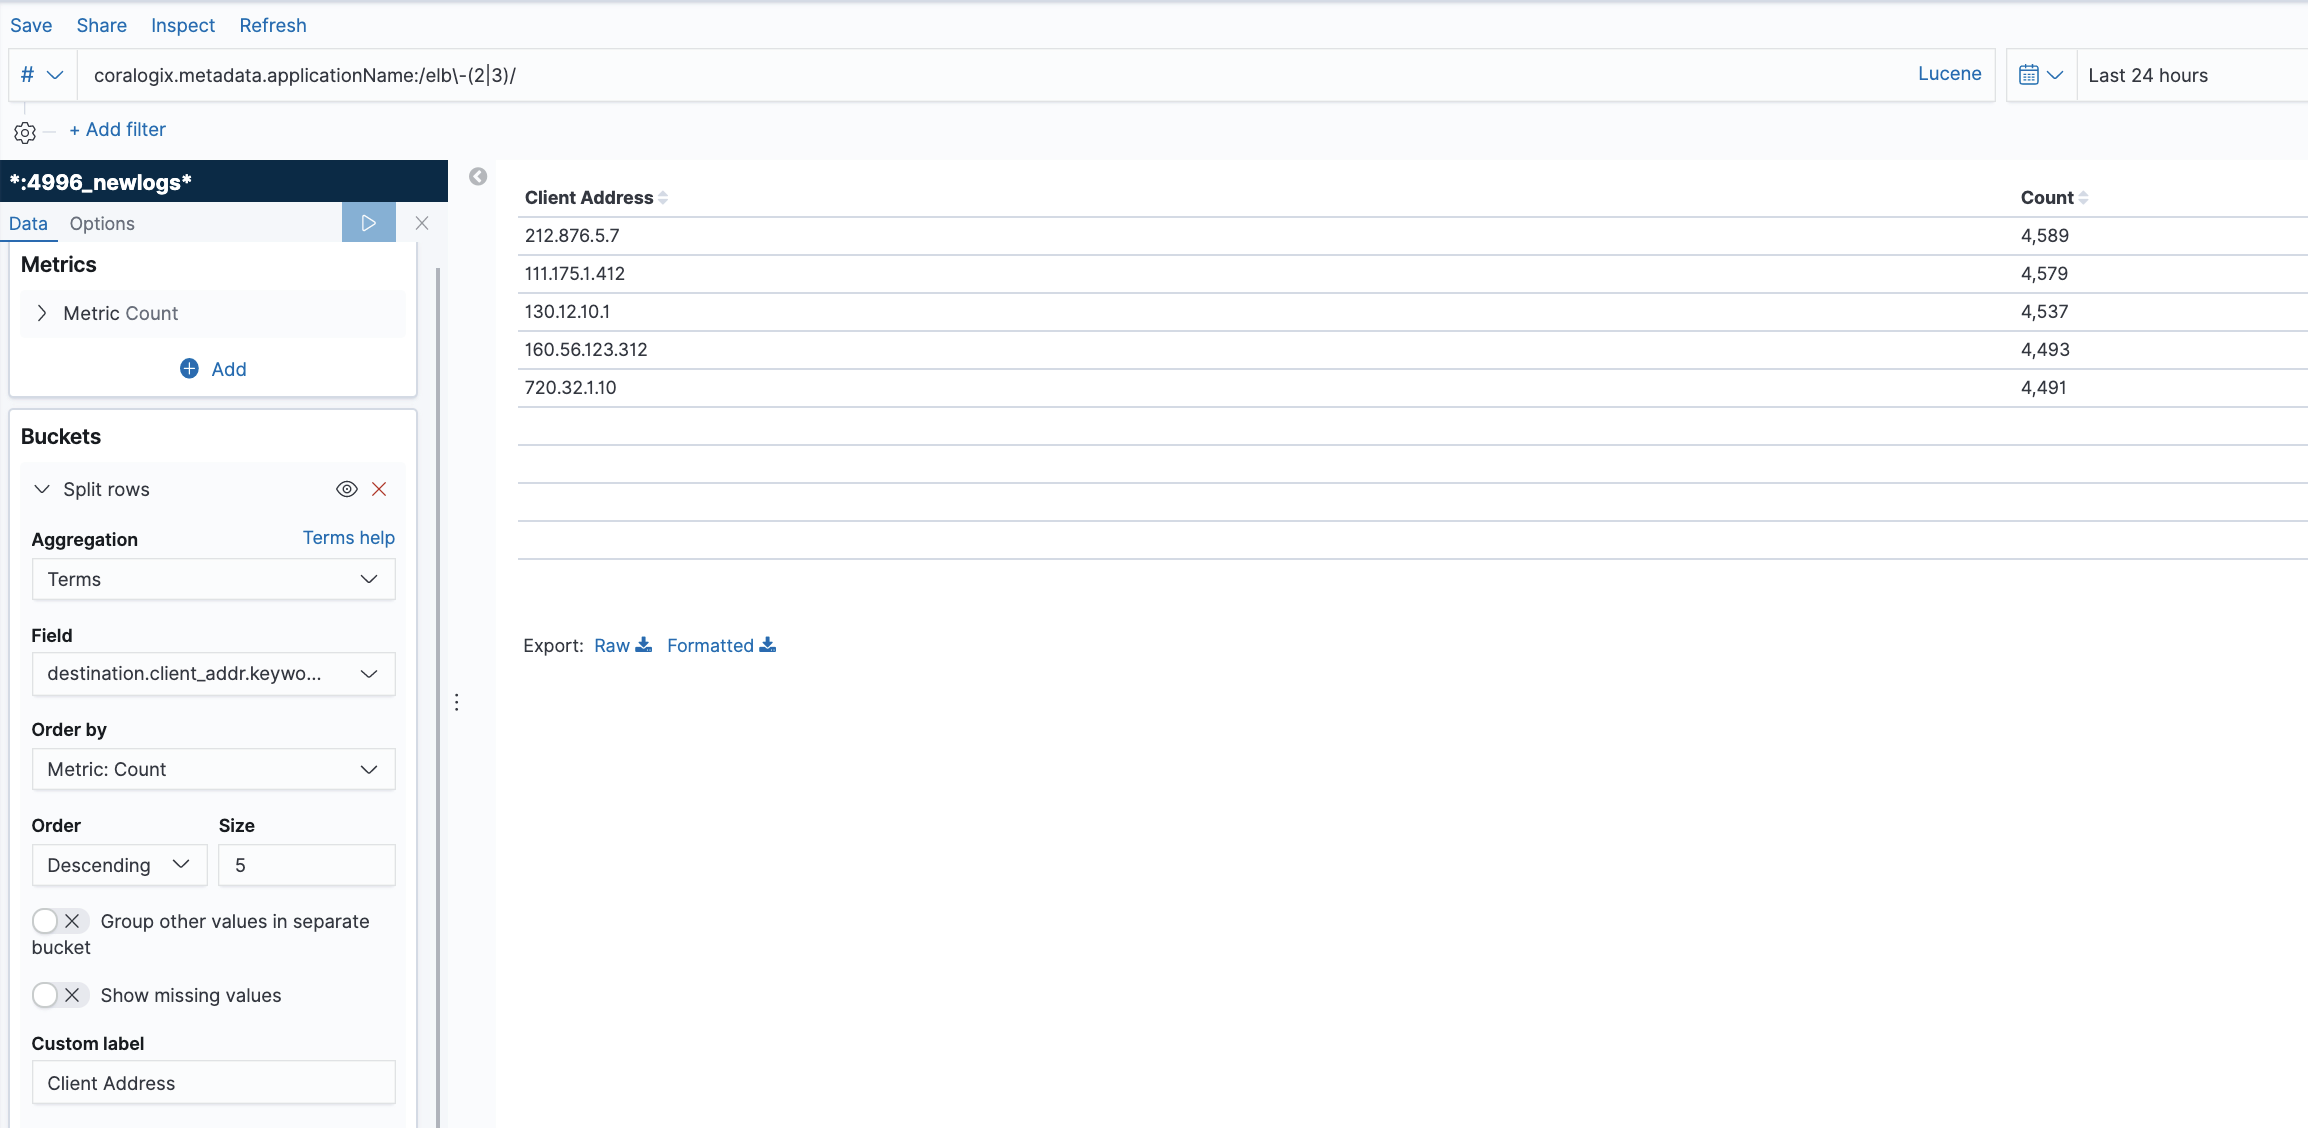
  • RequestCountPerTarget: The average number of requests sent to a specific target in a target group. This metric applies to any target type connected to the load balancer except AWS Lambda.
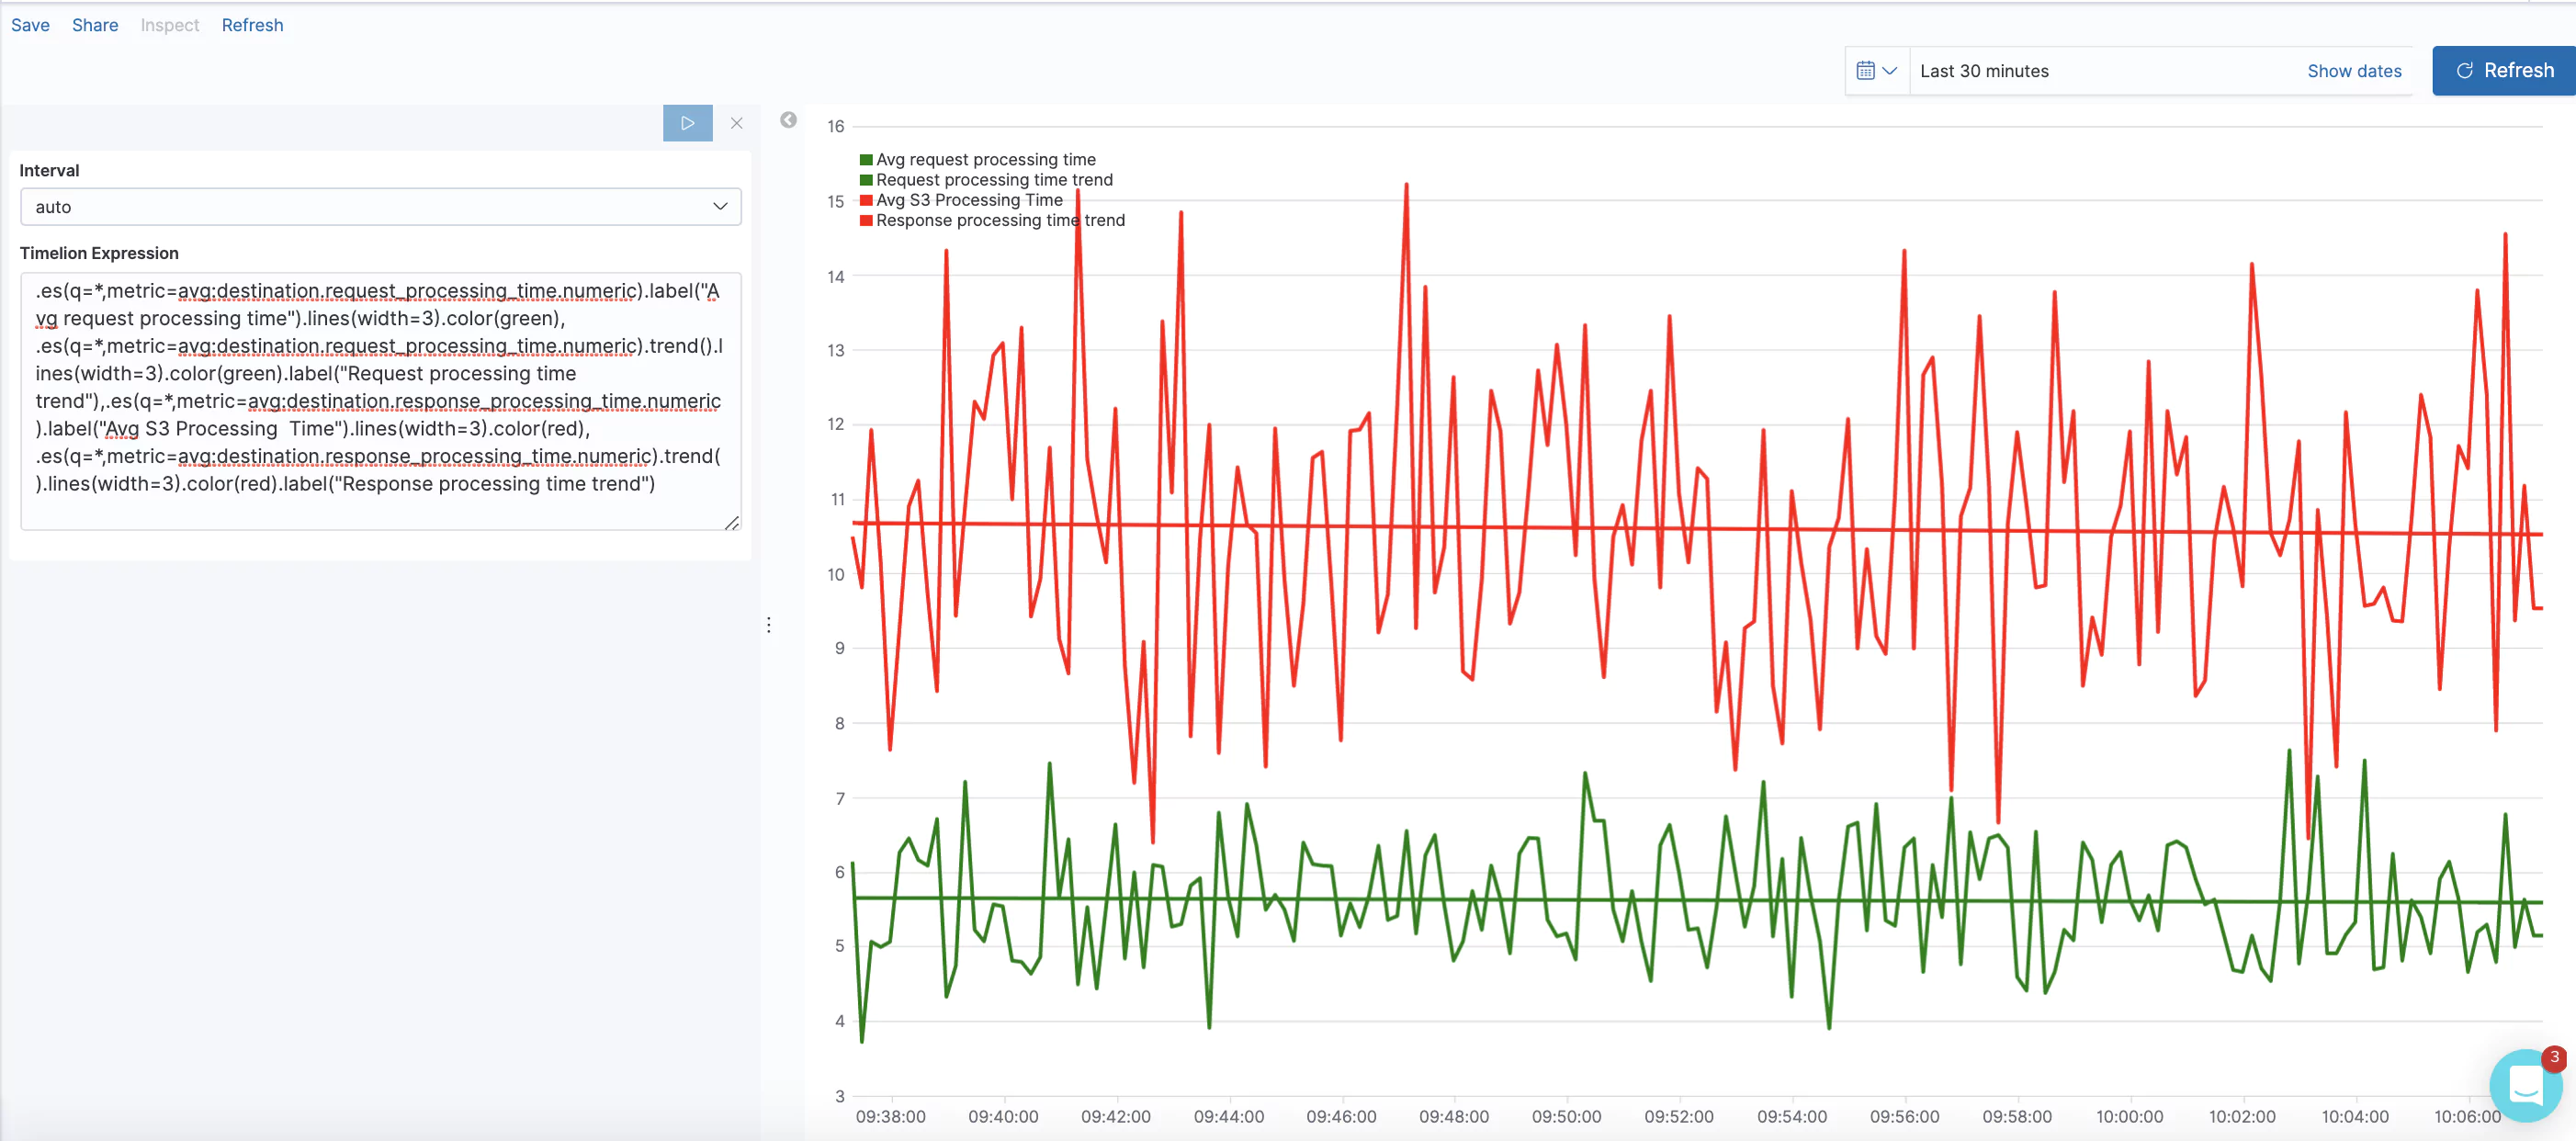
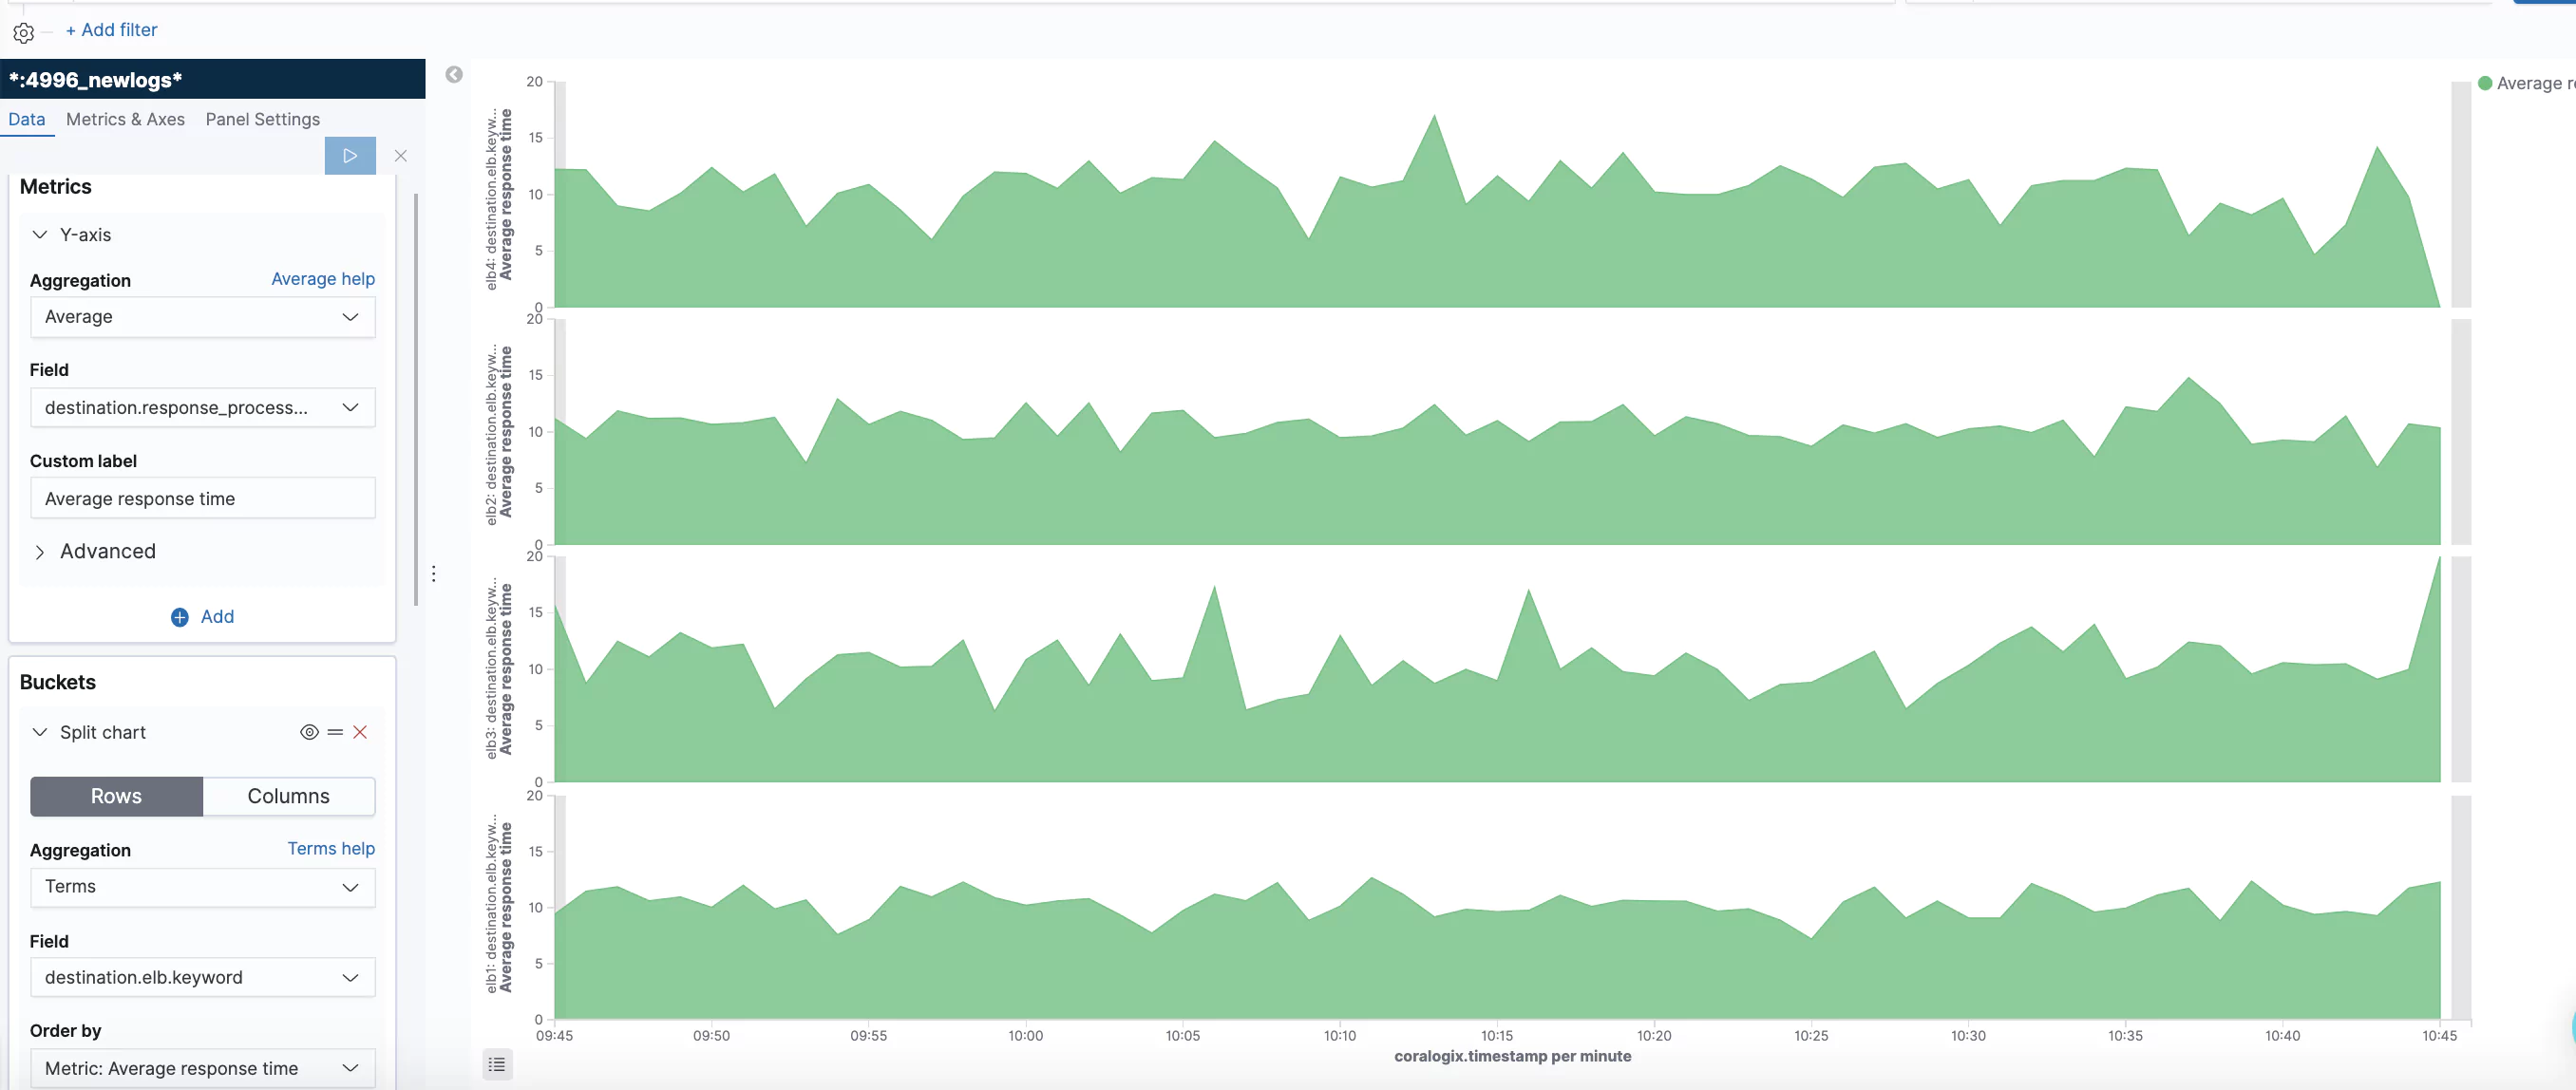
  • TargetResponseTime: The number of seconds between when the request leaves the load balancer to when the target receives the request.

Authorization Metrics

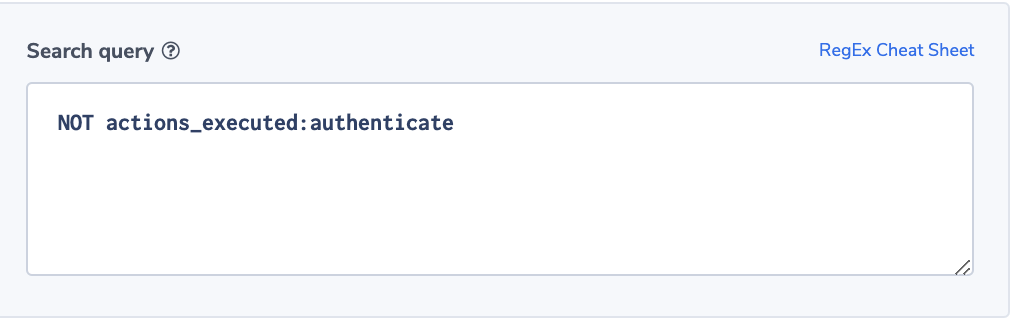
Authorization metrics are essential for detecting potential attacks on your system. Many error metrics especially can show that nefarious calls are made against your endpoints. These metrics are critical to observe and set alarms when using Elastic load balancers.

Statistical Metrics

Some Authorization metrics are used to track the usage of the elastic load balancer. These include the following metrics

  • ELBAuthLatency: The time taken to query the identity provider for user information and the ID token. This latency will either be the time to return the token when successful or the time to fail.
  • ELBAuthRefreshTokenStatus: The number of times a refresh token is successfully used to provide a new ID token.

Error Metrics

There are three error metrics associated with authorization on elastic load balancers. Exact errors can be read in AWS Cloudwatch logs in the error_reason parameter.

  • ELBAuthError: This metric is used for errors such as malformed authentication actions when a connection cannot be established with the identity provider, or another internal authentication error occurred.
  • ELBAuthFailure: Authentication failures occur when identity provider access is denied to the user, or an authorization code is used multiple times.
  • ELBAuthUserClaimsSizeExceeded: This metric shows how many times the identity provider returned user claims larger than 11K Bytes. Most browsers limit cookie sizes to 4K Bytes. When a cookie is more significant than 4K, AWS ELB logs will use separate shards to handle the size. Anything up to 11K is allowed, but larger cannot be handled and will throw a 500 error.

Summary

AWS elastic load balancers scale traffic from endpoints into your platform. It allows companies to truly scale their backend and ensure the needs of their customers are always met by providing the resources needed to support those customers are available. Elastic load balancers are available for scaling at different levels of the OSI networking model. 

Developers can use all or some of the available metrics to analyze the traffic flowing through and the health of their elastic load balancer setup and its targets. Separate metrics are available for the load balancer, its targets, and authorization setup. Metrics can be manually checked using AWS CloudWatch. They can also be sent to external analytics tools to alert development teams when there may be problems with the system.

How to get the most out of your ELB logs

What is ELB

Amazon ELB (Elastic Load Balancing) allows you to make your applications highly available by using health checks and intelligently distributing traffic across a number of instances. It distributes incoming application traffic across multiple targets, such as Amazon EC2 instances, containers, IP addresses, and Lambda functions. You might have heard the terms, CLB, ALB, and NLB. All of them are types of load balancers under the ELB umbrella. 

Types of Load Balancers

  • CLB: Classic Load Balancer is the previous generation of EC2 load balancer
  • ALB: Application Load Balancer is designed for web applications
  • NLB: Network Load Balancer operates at the network layer

This article will focus on ELB logs, you can get more in-depth information about ELB itself in this post

ELB Logs

Elastic Load Balancing provides access logs that capture detailed information about requests sent to your load balancer. Each ELB log contains information such as the time the request was received, the client’s IP address, latencies, request paths, and server responses.

ELB logs structure

Because of the evolution of ELB, documentation can be a bit confusing. Not surprisingly, there are three variations of the AWS ALB access logs; ALB, NLB, and CLB. We need to rely on the document header to understand which of the variant logs it describes (the URL and body will usually reference ELB generically).

How to collect ELB logs

The ELB access logging monitoring capability is integrated with Coralogix. The logs can be easily collected and sent straight to the Coralogix log management solution. 

ALB Log Example

This is an example of a parsed ALB HTTP entry log:

{
 “type”:“http”,
 “timestamp:“2018-07-02T22:23:00.186641Z”, 
 “elb”:“app/my-loadbalancer/50dc6c495c0c9188”,
 “client_addr”:“192.168.131.39”,
 “client_port”:“2817”,
 “target_addr”:“110.8.13.9”,
 “target_port”:“80”,
 “request_processing_time”:“0.000”,
 “target_processing_time”:“0.001”,
 “response_processing_time”:“0.000”,
 “elb_status_code”:“200”,
 “target_status_code”:“200”,
 “received_bytes”:“34”,
 “sent_bytes”:“366”,
 “request”:“GET https://www.example.com:80/ HTTP/1.1”,
 “user_agent”:“curl/7.46.0”,
 “Ssl_cipher”:“-”,
 “ssl_protocol”:“-”,
 “target_group_arn”:“arn:aws:elasticloadbalancing:us-east-2:123456789012:targetgroup/my-targets/73e2d6bc24d8a067”,
 “trace_id”:“Root=1-58337262-36d228ad5d99923122bbe354”,
 “domain_name”:“type”:”http”-”,
 “chosen_cert_arn”:“-”,
 “matched_rule_priority”:”0”,
 “request_creation_time”:”2018-07-02T22:22:48.364000Z”,
 “Actions_executed“:“forward”,
 “redirect_url“:“-”,
 “error_reason“:“-”,
 “target_port_list“:”80”,
 “target_status_code_list“:“200”
}

Note that if you compare this log to the AWS log syntax table, we split the client address and port and target address and port into four different fields to make it easier.

CLB Log Example

This is an example of a parsed HTTPS CLB log:

{
 “timestamp":”2018-07-02T22:23:00.186641Z”, 
 “elb”:”app/my-loadbalancer/50dc6c495c0c9188”,
 “client_addr”:”192.168.131.39”,
 “client_port”:”2817”,
 “target_addr”:”10.0.0.1”,
 “target_port”:”80”,
 “request_processing_time”:”0.001”,
 “backend_processing_time”:”0.021”,
 “response_processing_time”:”0.003”,
 “elb_status_code”:”200”,
 “backend_status_code”:”200”,
 “received_bytes”:”0”,
 “sent_bytes”:”366”,
 “request":”http”GET https://www.example.com:80/ HTTP/1.1,
 “user_agent":”curl/7.46.0,
 “Ssl_cipher":”DHE-RSA_AES128-SHA”,
 “ssl_protocol”:”TLSv1.2”,
}

CLB logs have a subset of the ALB fields. The target is changed to the listener and the relevant target field names are changed to the backend. 

NLB Log Example

This is an example of an NLB log:

{
 “type”:”tls”,
 “version”:”1.0”,
 “timestamp":”2018-07-02T22:23:00.186641Z”, 
 “elb”:”net/my-network-loadbalancer/c6e77e28c25b2234”,
 “listener”:”g3d4b5e8bb8464cd”
 “client_addr”:”192.168.131.39”,
 “client_port”:”51341”,
 “target_addr:”10.0.0.1”,
 “target_port”:”443”,
 “connection_time”:”5”,
 “tls_handshake__time”:”2”,
 “received_bytes”:”29”,
 “sent_bytes”:”366”,
 “Incoming_tls_alert”:”-”
 “chosen_cert_arn”:”arn:aws:elasticloadbalancing:us-east-2:123456789012:certificate/2a108f19-aded-46b0-8493-c63eb1ef4a99”,
 “chosen_cert_serial”:”-”
 “tls_cipher":”ECDHE-RSA_AES128-SHA”,
 “tls_protocol_versiion”:”TLSv12”,
 “tls_named_group”:-,
 “domain_name:”my-network-loadbalancer-c6e77e28c25b2234.elb.us-east-2.amazonaws.com”,
}

ELB Log Parsing

ELB logs contain unstructured data. Using Coralogix parsing rules, you can easily transform the unstructured ELB logs into JSON format to get the full power of Coralogix and the Elastic stack working for you. Parsing rules use RegEx and I created the expressions for NLB, ALB-1, ALB-2, and CLB logs. The two ALB regexes cover “normal” ALB logs and the special cases of WAF, Lambda, or failed or partially fulfilled requests. In this cases AWS assigns the value ‘-‘ to the target_addr field with no port. You will see some time measurements assigned the value -1. Make sure you take it into account in your visualizations filters. Otherwise averages and other aggregations could be skewed. Amazon may add fields and change the log structure from time to time, so always check these against your own logs and make changes if needed. The examples should provide a solid foundation.  

The following section requires some familiarity with regular expressions but just skip directly to the examples if you prefer. 

A bit about why the regexes were created the way they were. Naturally, we always want to use a regex that is simple and efficient. At the same time, we should make sure that each rule captures the correct logs in the correct way (correct values matched with the correct fields). Think about a regex that starts with the following expression:

^(?P<timestamp>[^s]+)s*

It will work as long as the first field in the unstructured log is a timestamp, like in the case of CLB logs. However, in the case of NLB and ALB logs, the expression will capture the “type” field instead. Since the regex and rule have no context, it will just place the wrong value in the wrong JSON key. There are other differences that can cause problems like different numbers of fields or field order. To avoid this problem, we use the fact that NLB logs always start with ‘tls 1.0’ standing for the fields ’type’ and ‘version’, and that ALB logs start with a ‘type’ field with 6 optional values (http, https, h2, ws, wss).

Note: As explained in the Coralogix rule tutorial, rules are organized by groups and executed by the order they appear within the group. When a rule matches a log, the log will move to the next group without processing the remaining rules within the same group.

Taking all this into account, we should:

  • Create a rule group called ‘Parse ELB’
  • Put the ALB and NLB rules first (these are the rules that look for the specific beginning of the respective logs) in the group

This approach will guarantee that each rule matches with the correct log. Now we are ready for the main part of this post.

In the following examples, we’ll describe how different ELB log fields can be used to indicate operational status. In the examples, we assume that the logs were parsed into JSON format. The examples will rely on the Coralogix alerts engine and on Kibana visualizations. They also provide additional insights into the different keys and values within the logs. Like always, we give you ideas and guidance on how to get more value out of your logs. However, every business environment is different and you are encouraged to take these ideas and build on top of them based on the best implementation for your infrastructure and goals. Last but not least, Elastic Load Balancing logs requests on a best-effort basis. The logs should be used to understand the nature of the requests, not as a complete accounting of all requests. In some cases, we will use ‘notify immediately’ alerts, but you should use ELB as a backup and not as the main vehicle for these types of alerts.

Tip: To learn the details of how to create Coralogix alerts you can read this guide.

Alerts

Increase in ELB WAF errors

This alert identifies if a specific ELB generates 403 errors more than usual. A 403 error results from a request that is blocked by AWS WAF, Web Application Firewall. The alert uses the ‘more than usual’ option. With this option, Coraloix’s ML algorithms will identify normal behavior for every time period. It will trigger an alert if the number of errors is more than normal and is above the optional threshold supplied by the user.

Alert Filter:

elb:”app/my-loadbalancer/50dc6c495c0c9188” AND elb_status_code:”403”

Alert Condition: ‘More than usual’. The field elb_status_code can be found across ALB, CLB logs.


Outbound Traffic from a Restricted Address

In this example, we use the client field. It contains the IP of the requesting client. The alert will trigger if a request is coming from a restricted address. For the purpose of this example, we assume that permitted addresses are all under the subnet 172.xxx.xxx.xxx.

Alert Filter:

client_addr:/172.[0-9]{1,3},[0-9]{1,3},[0-9]{1,3}/

Note: Client_addr is found across NLB, ALB, and CLB.

Alert Condition:‘Notify immediately’.

ELB Down

This alert identifies an inactive ELB. It uses the ‘less than’ alert condition. The threshold is set to no logs in 5 minutes. This should be adapted to your specific environment. 

Alert Filter:

elb:”app/my-loadbalancer/50dc6c495c0c9188”

Alert Condition: ‘less than 1 in 5 minutes’’ 

This alert works across NLB, ALB, and CLB.


Long Connection Time

Knowing the type of transactions running on a specific ELB, ops would like to be alerted if connection times are unusually long. Here again, the Coralogix ‘more than usual” alert option will be very handy. 

Alert Filter:

connection_time:[2 TO *]

Note: Connectiion_time is specific to NLB logs. You can create similar alerts on any of the time-related fields in any of the logs. 

Alert Condition:  ‘more than usual’


A Surge in ‘no rule’ Requests

The field ‘matched_rule_priority’ indicates the priority value of the rule that matched the request. The value 0 indicates that no rule was applied and the load balancer resorted to the default. Applying rules to requests is specifically important in highly regulated or secured environments. For such environments, it will be important to identify rule patterns and abnormal behavior. Coralogix has powerful ML algorithms focused on identifying deviation from a normal flow of logs. This alert will notify users if the number of requests not matched with a rule is more than the usual number.

Alert Filter:

matched_rule_priority:0

Note: This is an ALB field.

Alert Condition:  ‘more than usual’


No Authentication

In this example, we assume a regulated environment. One of the requirements is that for every ELB request the load balancer should validate the session, authenticate the user, and add the user information to the request header, as specified by the rule configuration. This sequence of actions will be indicated by having the value ‘authenticate’ in the actions_executed’ field. The field can include a few actions separated by ‘,’. Though ELB doesn’t guarantee that every request will be recorded, it is important to be notified of the existence of such a problem, so we will use the ‘notify immediately’ condition.  

Alert Filter:

NOT actions_executed:authenticate

Note: This is an ALB field.

Alert Condition:  ‘notify immediately’

Visualizations

Traffic Type Distribution

Using the ‘type’ field this visualization shows the distribution of the different requests and connection types.


Bytes Sent

Summation of the number of bytes sent.


Average Request/Response Processing Time

Request processing time is the total time elapsed from the time the load balancer received the request until the time it sent it to a target. Response processing time is the total time elapsed from the time the load balancer received the response header from the target until it started to send the response to the client. In this visualization, we are using Timelion to track the average over time and generate a trend line.

Timelion expression:

.es(q=*,metric=avg:destination.request_processing_time.numeric).label("Avg request processing time").lines(width=3).color(green), .es(q=*,metric=avg:destination.request_processing_time.numeric).trend().lines(width=3).color(green).label("Avg request processing time trend"),.es(q=*,metric=avg:destination.response_processing_time.numeric).label("Avg response processing Time").lines(width=3).color(red), .es(q=*,metric=avg:destination.response_processing_time.numeric).trend().lines(width=3).color(red).label("Avg response processing time trend")


Average Response Processing Time by ELB

In this visualization, we show the average response processing time by ELB. We used the horizontal option. See the definition screens.


Top Client Requesters for a specific ELB

This table lists the top IP addresses generating requests to specific ELB’s. The ELB’s are separated by the metadata applicationName. This metadata field is assigned to the load balancer when you configure the integration. We created a Kibana filter that looks only at these two devices. You can read about filtering and querying in our tutorial.


ELB Status Codes

This is an example showing the status code distribution for the last 24 hours.

You can also create a more dynamic representation showing how the distribution behaves over time.

This blog post covered the different types of services that AWS provides under the ELB umbrella, NLB, ALB, and CLB. We focused on the logs these services generate and their structure, and showed some examples of alerts and visualizations that can help you unlock the value of these logs. Remember that every user is unique and has its own use case and data. Your logs might be customized and configured differently and you will most likely have your own requirements. So, you are encouraged to take the methods and concepts showed here and adapt them to your own needs. If you need help or have any questions, don’t hesitate and reach out to support@coralogixstg.wpengine.com. You can learn more about unlocking the value embedded in AWS ALB logs and other logs in some of our other blog posts.