What is the Coralogix Security Traffic Analyzer (STA), and Why Do I Need It?

The wide-spread adoption of cloud infrastructure has proven to be highly beneficial, but has also introduced new challenges and added costs – especially when it comes to security.

As organizations migrate to the cloud, they relinquish access to their servers and all information that flows between them and the outside world. This data is fundamental to both security and observability.

Cloud vendors such as AWS are attempting to compensate for this undesirable side effect by creating a selection of services which grant the user access to different parts of the metadata. Unfortunately, the  disparate nature of these services only creates another problem. How do you bring it all together?

The Coralogix Cloud Security solution enables organizations to quickly centralize and improve their security posture, detect threats, and continuously analyze digital forensics without the complexity, long implementation cycles, and high costs of other solutions.

The Security Traffic Analyzer Can Show You Your Metadata

Using the Coralogix Security Traffic Analyzer (STA), you gain access to the tools that you need to analyze, monitor and alert on your data, on demand.

Here’s a list of data types that are available for AWS users:

[table id=43 /]

Well… That doesn’t look very promising, right? This is exactly the reason why we developed the Security Traffic Analyzer (STA).

What can the Security Traffic Analyzer do for you?

Simple Installation

When you install the STA, you get an AWS instance and several other related resources.

Mirror Your Existing VPC Traffic

You can mirror your server traffic to the STA (by using VPC traffic mirroring). The STA will automatically capture, analyze and optionally store the traffic for you while creating meaningful logs in your Coralogix account. You can also create valuable dashboards and alerts. To make it even easier, we created the VPC Traffic Mirroring Configuration Automation handler which automatically updates your mirroring configuration based on instance tags and tag values in your AWS account. This allows you to declaratively define your VPC traffic mirroring configuration.

Machine Learning-Powered Analysis

The STA employs ML-powered algorithms which alert you to potential threats with the complete ability to tune, disable and easily create any type of new alerts.

Automatically Enrich Your Logs

The STA automatically enriches the data passing through it such as domain names, certificate names, and much more by using data from several other data sources. This allows you to create more meaningful alerts and reduce false-positives while not increasing false-negatives.

What are the primary benefits of the Coralogix STA?

Ingest Traffic From Any Source

Connect any source of information to complete your security observability, including Audit logs, Cloudtrail, GuardDuty or any other source. Monitor your security data in one of 100+ pre-built dashboards or easily build your own using our variety of visualization tools and APIs.

Customizable Alerts & Visualizations

The Coralogix Cloud Security solution comes with a predefined set of alerts, dashboards and Suricata rules. Unlike many other solutions on the market today, you maintain the ability to change any or all of them to tailor them to your organization’s needs.

One of the most painful issues that usually deters people from using an IDS solution is that they are notorious for their high false-positive rate, but Coralogix makes it unbelievably easy to solve these kinds of issues. Dynamic ML-powered  alerts, dashboards, and Suricata rules are just a matter of 2-3 clicks and you’re done.

Automated Incident Response

Although Coralogix focuses on detection rather than prevention, it is still possible to achieve both detection and better prevention by integrating Coralogix with any orchestration platform such as Cortex XSOAR and others. 

Optimized Storage Costs

Security logs need to be correlated with packet data in order to provide needed context to perform deep enough investigations. Setting up, processing, and storing packet data can be laborious and cost-prohibitive.

With the Coralogix Optimizer, you can reduce up to 70% of storage costs without sacrificing full security coverage and real-time monitoring. This new model enables you to get all of the benefits of an ML-powered logging solution at only a third of the cost and with more real-time analysis and alerting capabilities than before.

How Does the Coralogix STA Compare to AWS Services?

Here’s a full comparison between the STA and all the other methods discussed in this article:

[table id=44 /]

(1) Will be added soon in upcoming versions

As you can see, the STA is already the most effective solution for gaining back control and access to your metadata. In the upcoming versions, we’ll also improve the level of network visibility by further enriching the data collected, allowing you to make even more fine-grained alerting rules.

The Value of Ingesting Firewall Logs

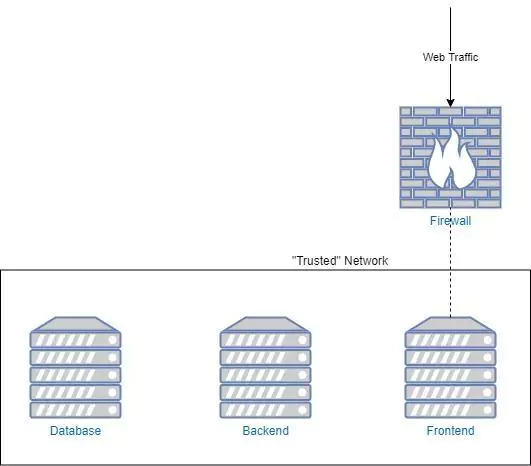
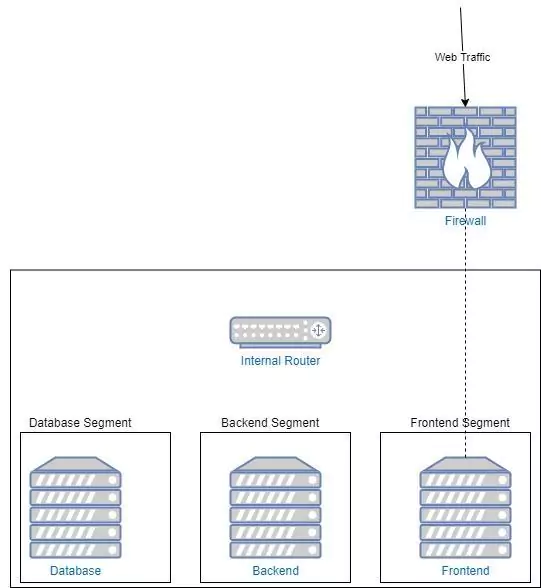
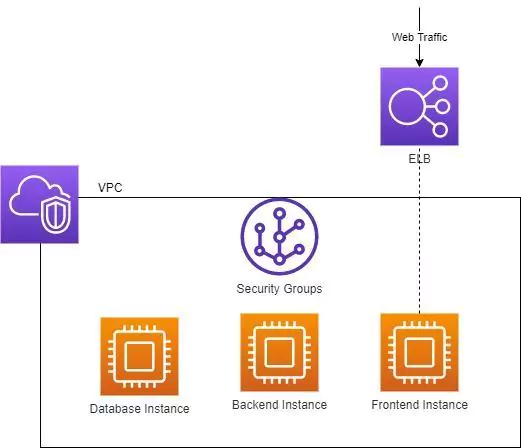
In this article, we are going to explore the process of ingesting and monitoring logs into your data lake, and the value of importing your firewall logs into Coralogix. To understand the value of the firewall logs, we must first understand what data is being exported. 

A typical layer 3 firewall will export the source IP address, destination IP address, ports, and the action for example allow or deny. A layer 7 firewall will add more metadata to the logs including application, user, location, and more. 

This data, when placed into an aggregator like Coralogix and visualized, allows greater visibility into the traffic traversing your network. This allows you to detect anomalies and potential problems. A great example of this is detecting malware or data exfiltration to unknown destinations (more on this later).

Configuring Logstash

The first and most critical part of extracting the value of firewall logs is ingesting the correct data. When exporting logs from firewalls, Logstash is one method of ingestion. Coralogix also provides an agent for other Syslog services. This article assumes that you already have Logstash deployed and working. First, we will cover how to set up a configuration for ingestion. 

The recommended way to export firewall logs for ingestion into Logstash is using Syslog. Inside your Logstash conf.d folder, we are going to create our ingestion configuration files. 

To start with we are going to enable Syslog with the following config:

01-syslog.conf

Note: We are using port 5140 rather than 514 for Syslog. This is because Logstash is run as a user, meaning it does not have the privileges to run on port 514.

# TCP Syslog Ingestion (Port 5140)

input {

  tcp {

    type => "syslog"

    port => 5140

  }

}

# UDP Syslog Ingestion (Port 5140)

input {

  udp {

    type => "syslog"

    port => 5140

  }

}

At this point, we need to apply a filter to configure what happens with the data passed via Syslog. You can find several pre-made filters for Logstash online as it’s a popular solution. The following example is a configuration that would be used with a PFsense firewall.

In this configuration, we are filtering Syslogs from two PFsense firewalls. The first is 10.10.10.1 & the second is 10.10.10.2. You will see that we match Syslog information and add fields that will be used to index the data in Coralogix. We will cover GROK filters in more detail in the next section. 

filter {

  if [type] == "syslog" {

    if [host] =~ /10.10.10.1/ {

      mutate {

        add_tag => ["pfsense-primary", "Ready"]

      }

    }

    if [host] =~ /10.10.10.2/ {

      mutate {

        add_tag => ["pfsense-backup", "Ready"]

      }

    }


    if "Ready" not in [tags] {

      mutate {

        add_tag => [ "syslog" ]

      }

    }

  }

}

filter {

  if [type] == "syslog" {

    mutate {

      remove_tag => "Ready"

    }

  }

}

filter {

  if "syslog" in [tags] {

    grok {

      match => { "message" => "%{SYSLOGTIMESTAMP:syslog_timestamp} %{SYSLOGHOST:syslog_hostname} %{DATA:syslog_program}(?:[%{POSINT:syslog_pid}])?: %{GREEDYDATA:syslog_message}" }

      add_field => [ "received_at", "%{@timestamp}" ]

      add_field => [ "received_from", "%{host}" ]

    }

    syslog_pri { }

    date {

      match => [ "syslog_timestamp", "MMM  d HH:mm:ss", "MMM  dd HH:mm:ss" ]

      locale => "en"

    }

    if !("_grokparsefailure" in [tags]) {

      mutate {

        replace => [ "@source_host", "%{syslog_hostname}" ]

        replace => [ "@message", "%{syslog_message}" ]

      }

    }

    mutate {

      remove_field => [ "syslog_hostname", "syslog_message", "syslog_timestamp" ]

    }

  }

}

Next, we create an output. The output defines where Logstash should export the ingested logs. In this case, we are shipping them to Coralogix.

100-output.conf

output {

    coralogix {

        config_params => {

            "PRIVATE_KEY" => "YOUR_PRIVATE_KEY"

            "APP_NAME" => "APP_NAME"

            "SUB_SYSTEM" => "SUB_NAME"

        }

        log_key_name => "message"

        timestamp_key_name => "@timestamp"

        is_json => true

    }

}

Configuring Your Firewall for Syslog

Each firewall interface has a slightly different way to configure log forwarding. However, they all follow a similar pattern. We are going to run through configuring log forwarding on a PFsense firewall as an example of what to expect. Log forwarding is extremely common and most firewall vendors will provide details for the configuration of log forwarding in their manuals. 

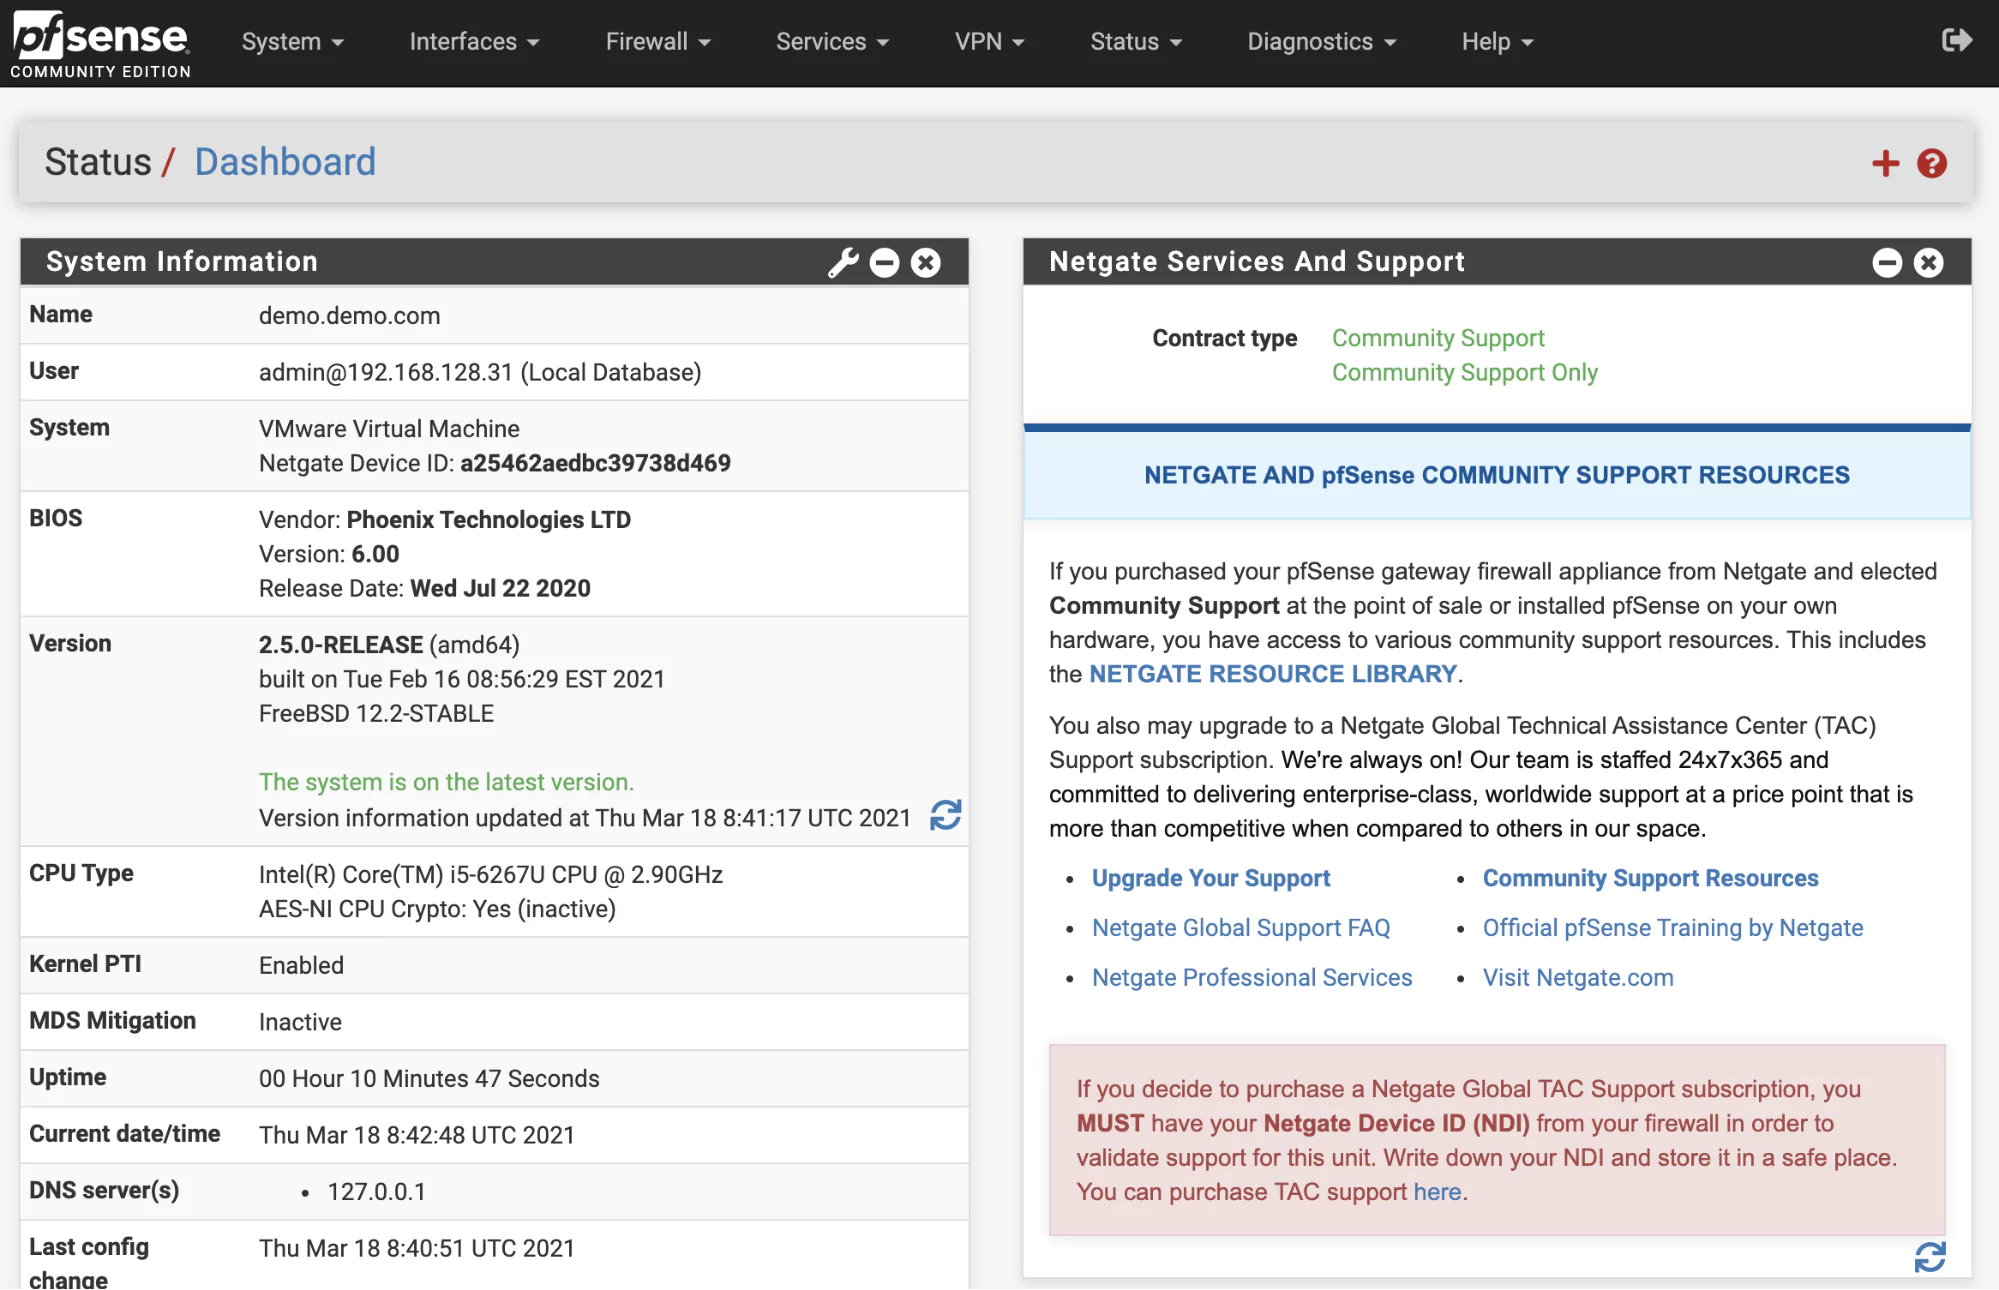
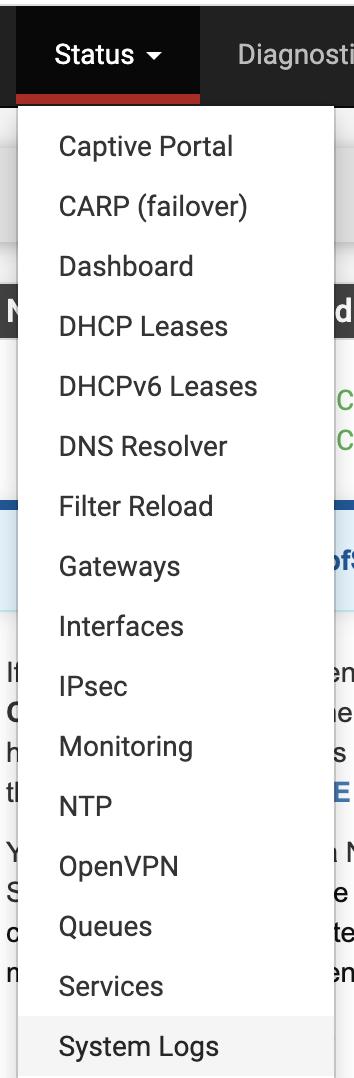
On a PFsense firewall, the first step is to get logged into the firewall management interface. PFsense has a web interface that is accessible on the LAN interface. Once logged in your screen should look like this:

pfsense web interface

To set up log forwarding select status and then system logs:

configure log forwarding firewall

On the system logs page go to “Settings”. On the “Settings” page scroll to the bottom and enable “Enable Remote Logging”:

remote logging firewall

Here we can configure how logs will be shipped to Logstash:

ship firewall logs to logstash

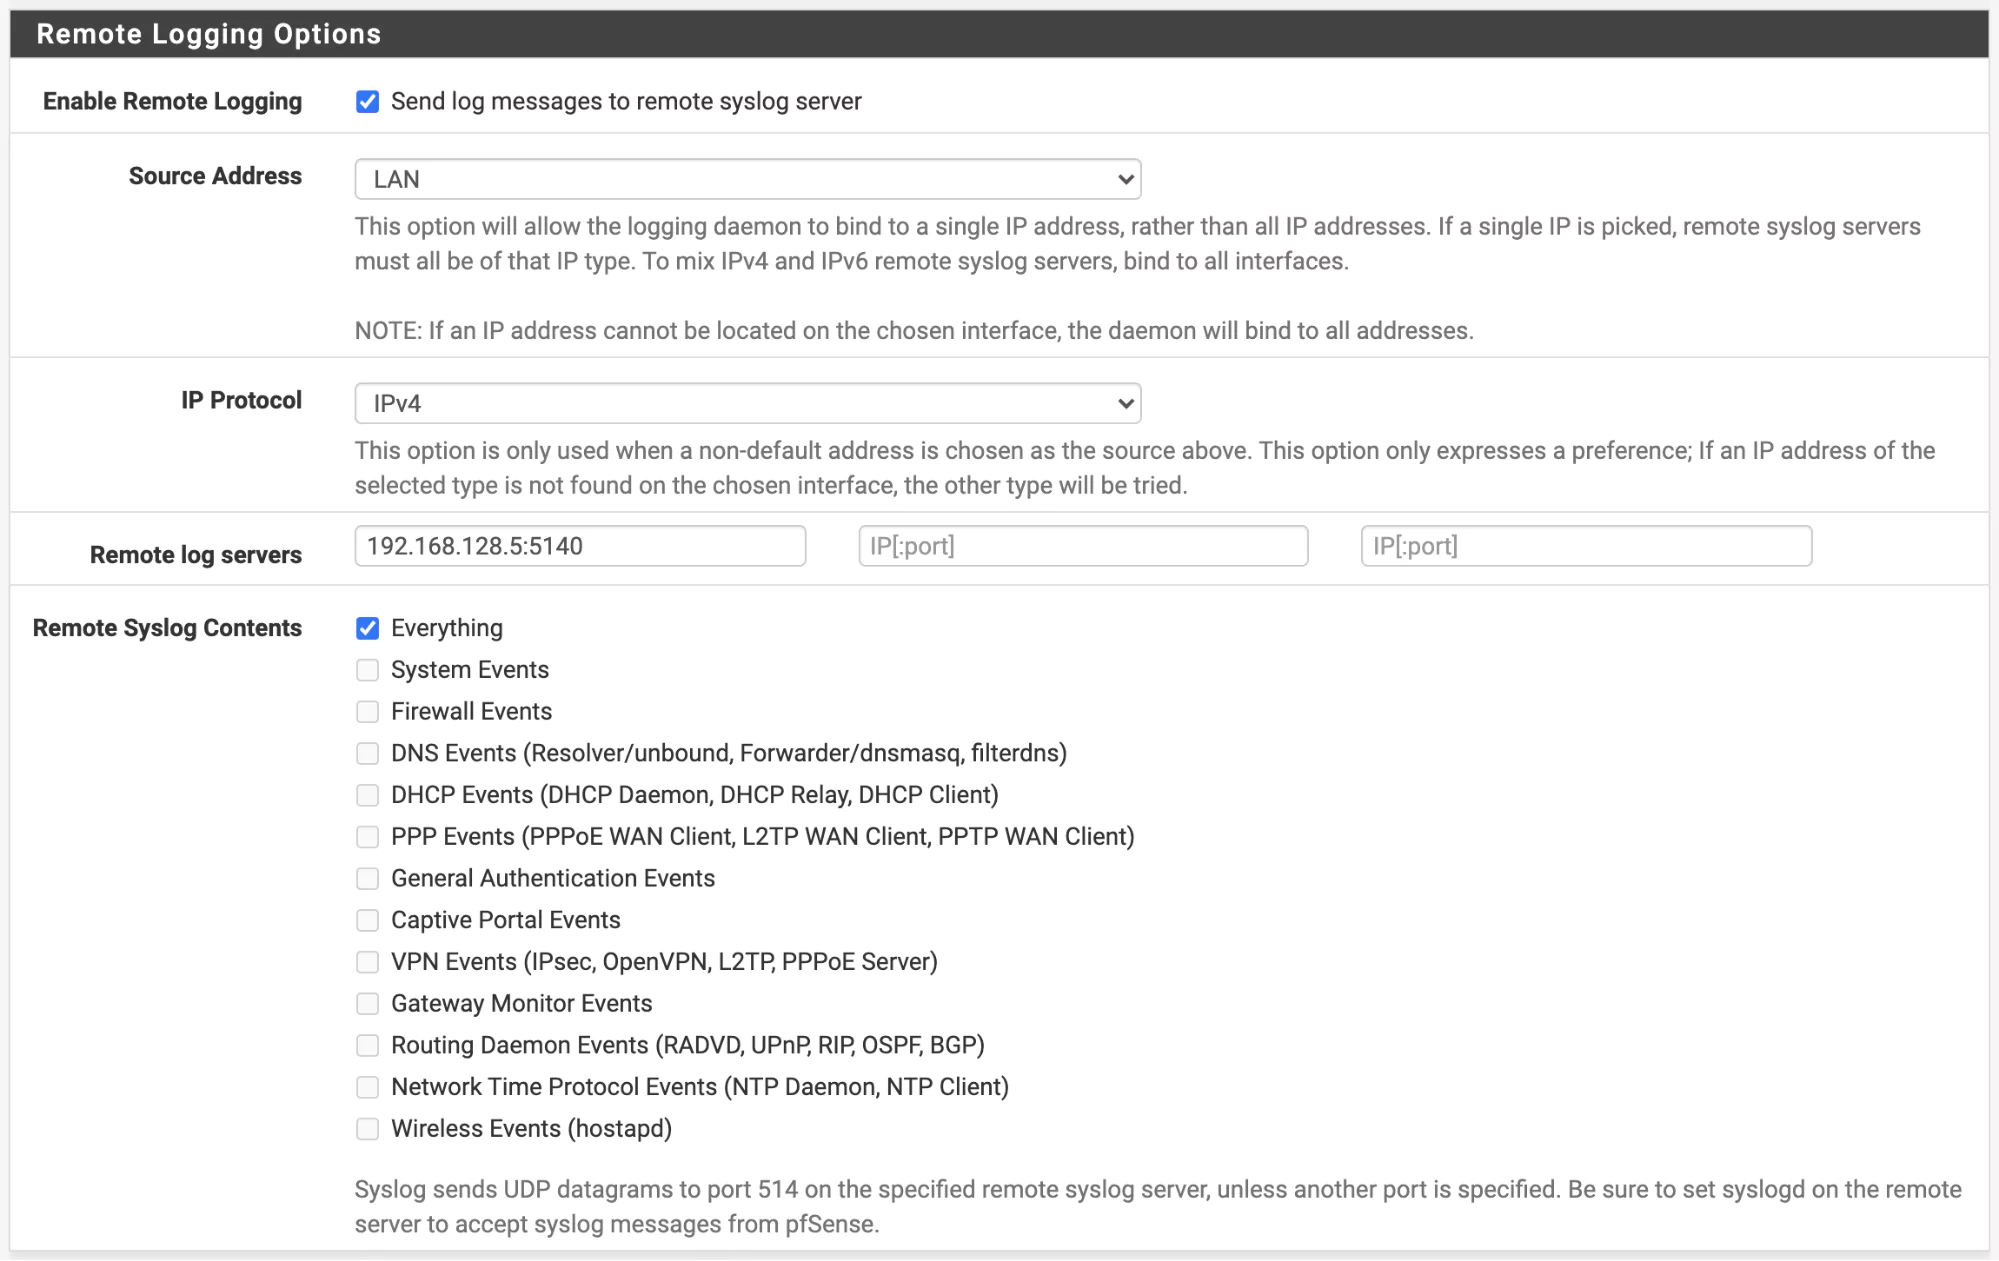
In the above configuration, we are shipping all logs to the server 192.168.128.5 on port 5140. This is the same as the configuration we deployed to our Logstash server. Once this has been enabled, save and your logs should start shipping to Logstash. 

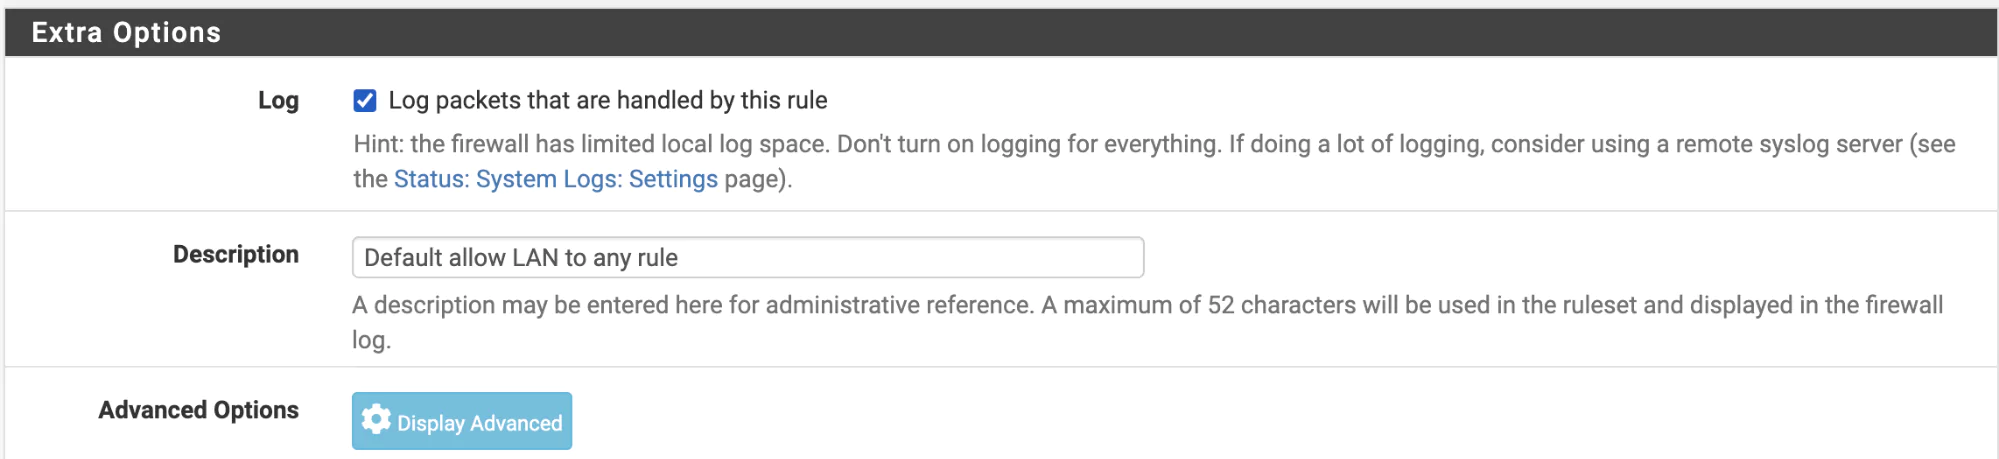
You may need to configure what happens with firewall rules. For instance, do you wish to ship all firewall rule events or just block events? On a PFsense firewall these are configured on each rule as below ‘Log – Log packets that are handled by this rule’:

extra configuration options pfsense

Visualize Your Data in Kibana 

Now that we have data flowing from our firewall to Logstash and into Coralogix, it’s time to add some filters that enable us to transform data so that we can visualize and create patterns in Kibana. 

Our first step is to address log parsing and then we can create some Kibana patterns to visualize the data. Filters can be made with GROK, however, Coralogix has a log parsing feature which enables you to much more quickly and easily create filters to manipulate the data you ingest. 

Log Parsing

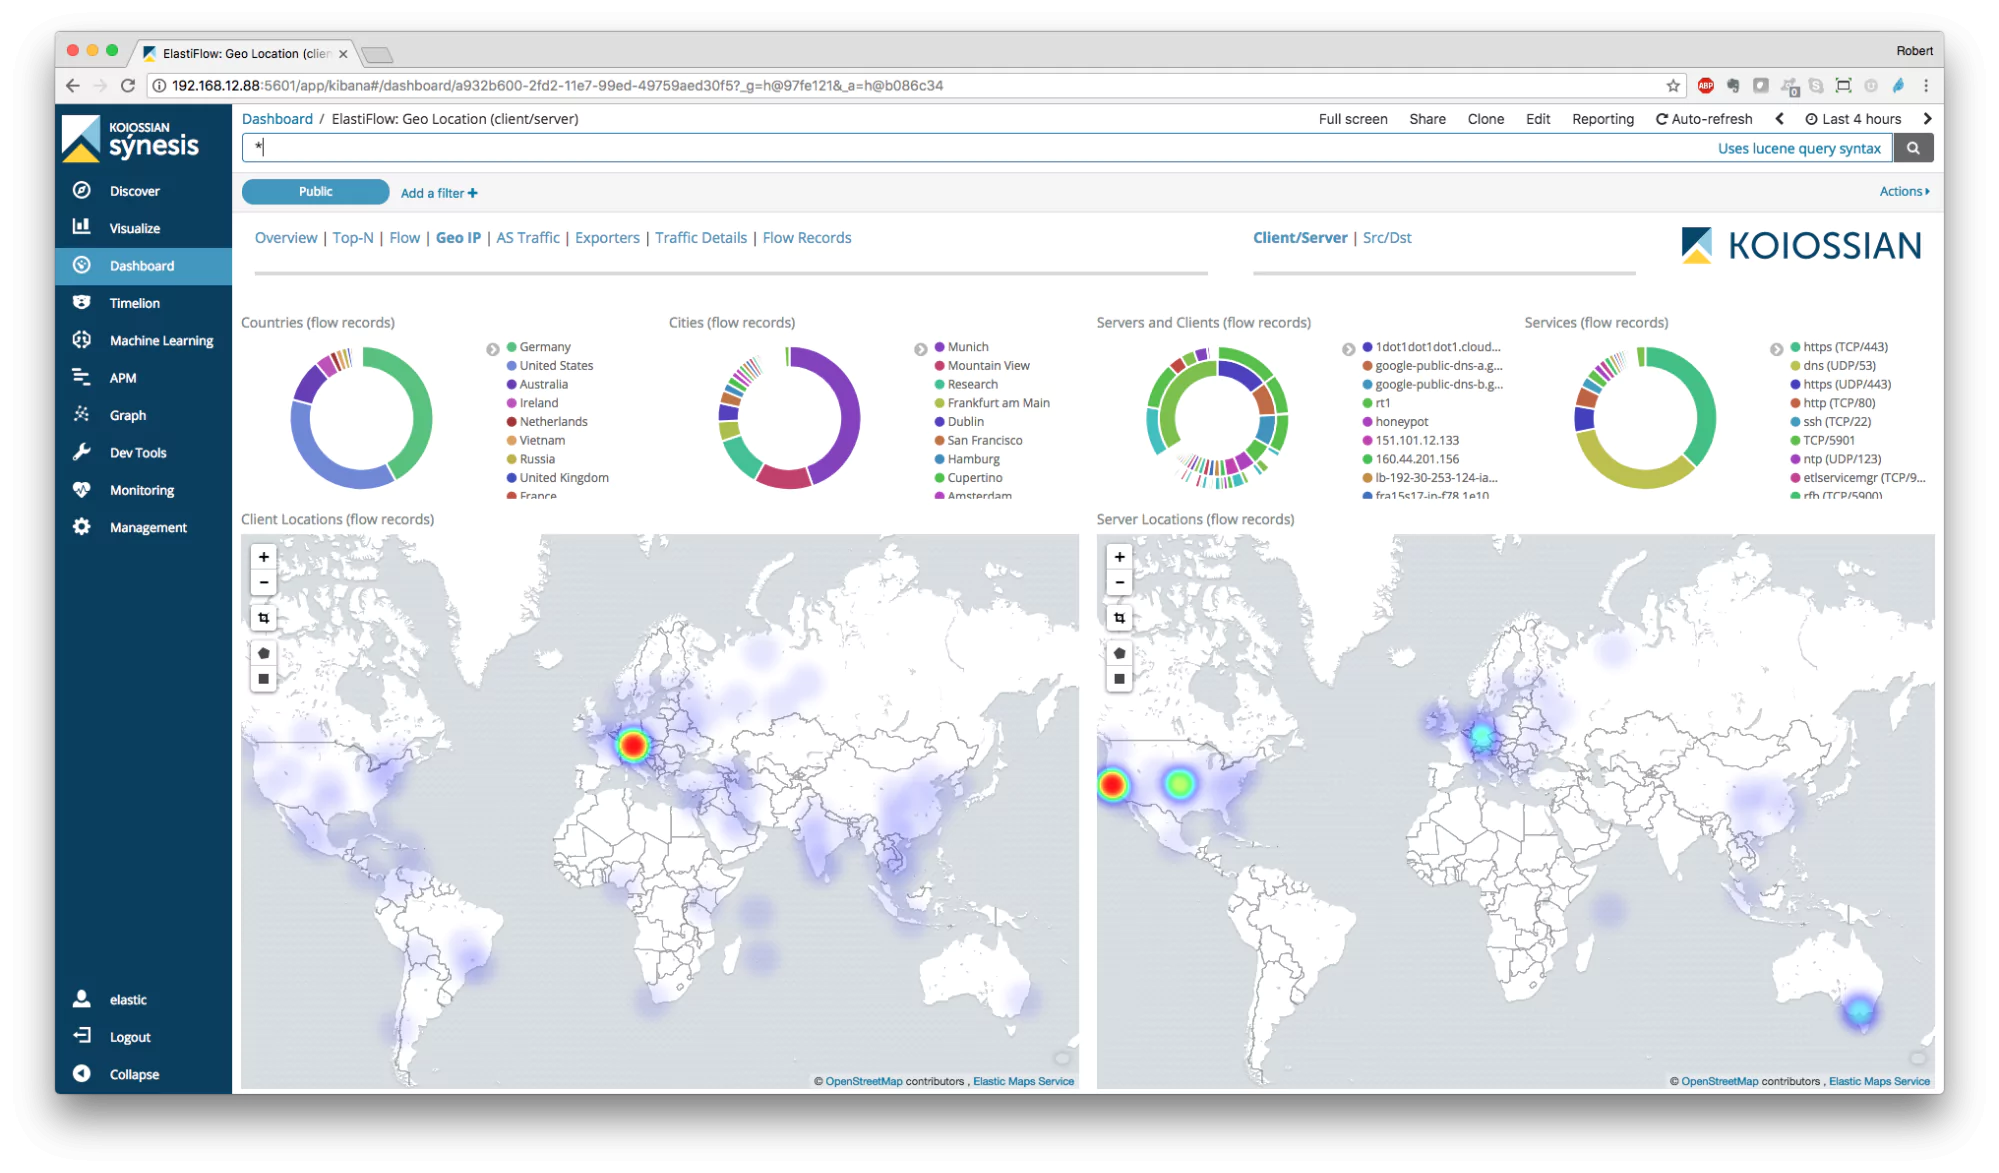
Firstly, let’s uncover what log parsing rules are. A log parsing rule enables Coralogix to take unstructured text and structure it. When we complete this conversion, we are then able to assign how the data is structured. For example, we can extract source IP addresses, destination IP addresses, the time, and the action. With this data we can then create dashboards like the below:

log parsing dashboard

The value of being able to process, parse, and restructure log data for firewalls is that you can design data structures that are completely customized to your requirements and business processes. Firewalls generate a large number of logs that contain a wealth of data. However, the sheer volume of data means that it’s impossible to manually review your logs. 

Using a platform like Coralogix enables security engineers to quickly visualize data and ascertain what is happening on their network. Also, it’s important to keep this data retained so that in the event of a security event, the security team has the data required to review what happened and remediate any concerns. 

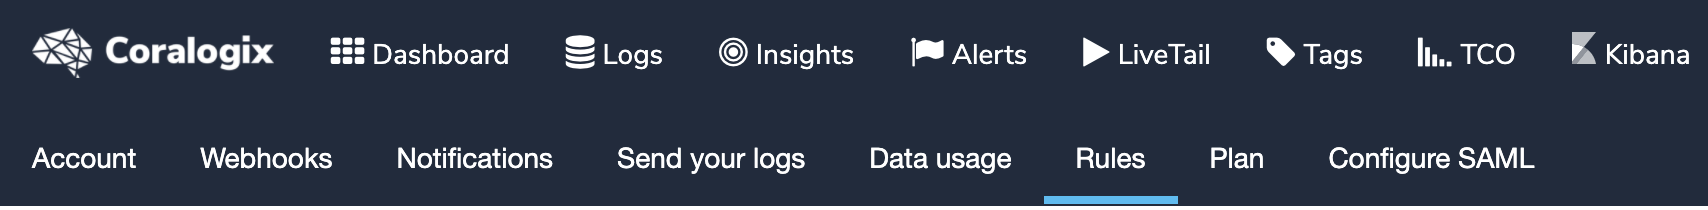
Let’s quickly explore how easy it is to create a rule in Coralogix. Once inside Coralogix, click on Settings, and then Rules:

log parsing rules coralogix

You will be presented with the different rule types that can be designed:

logs parsing rules types

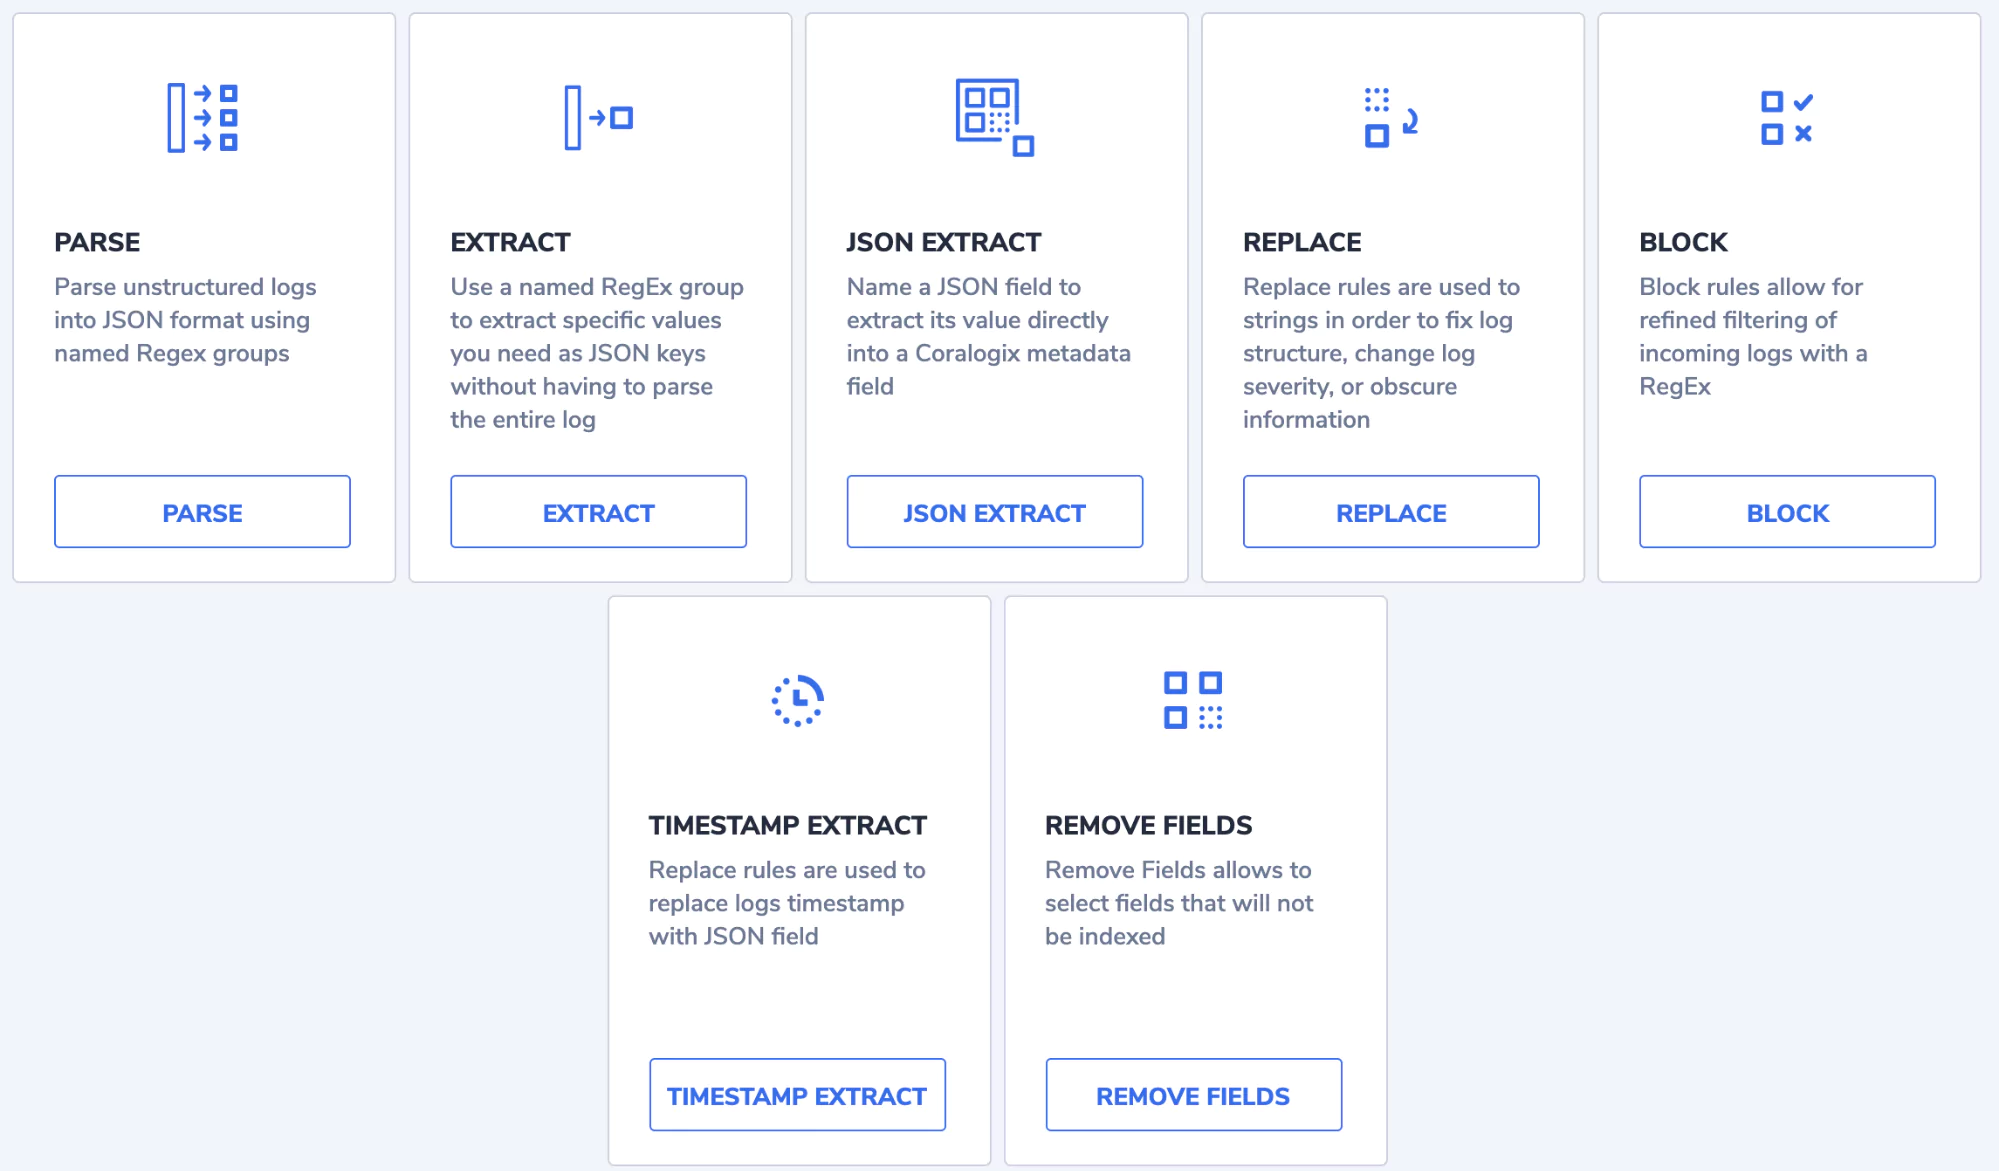
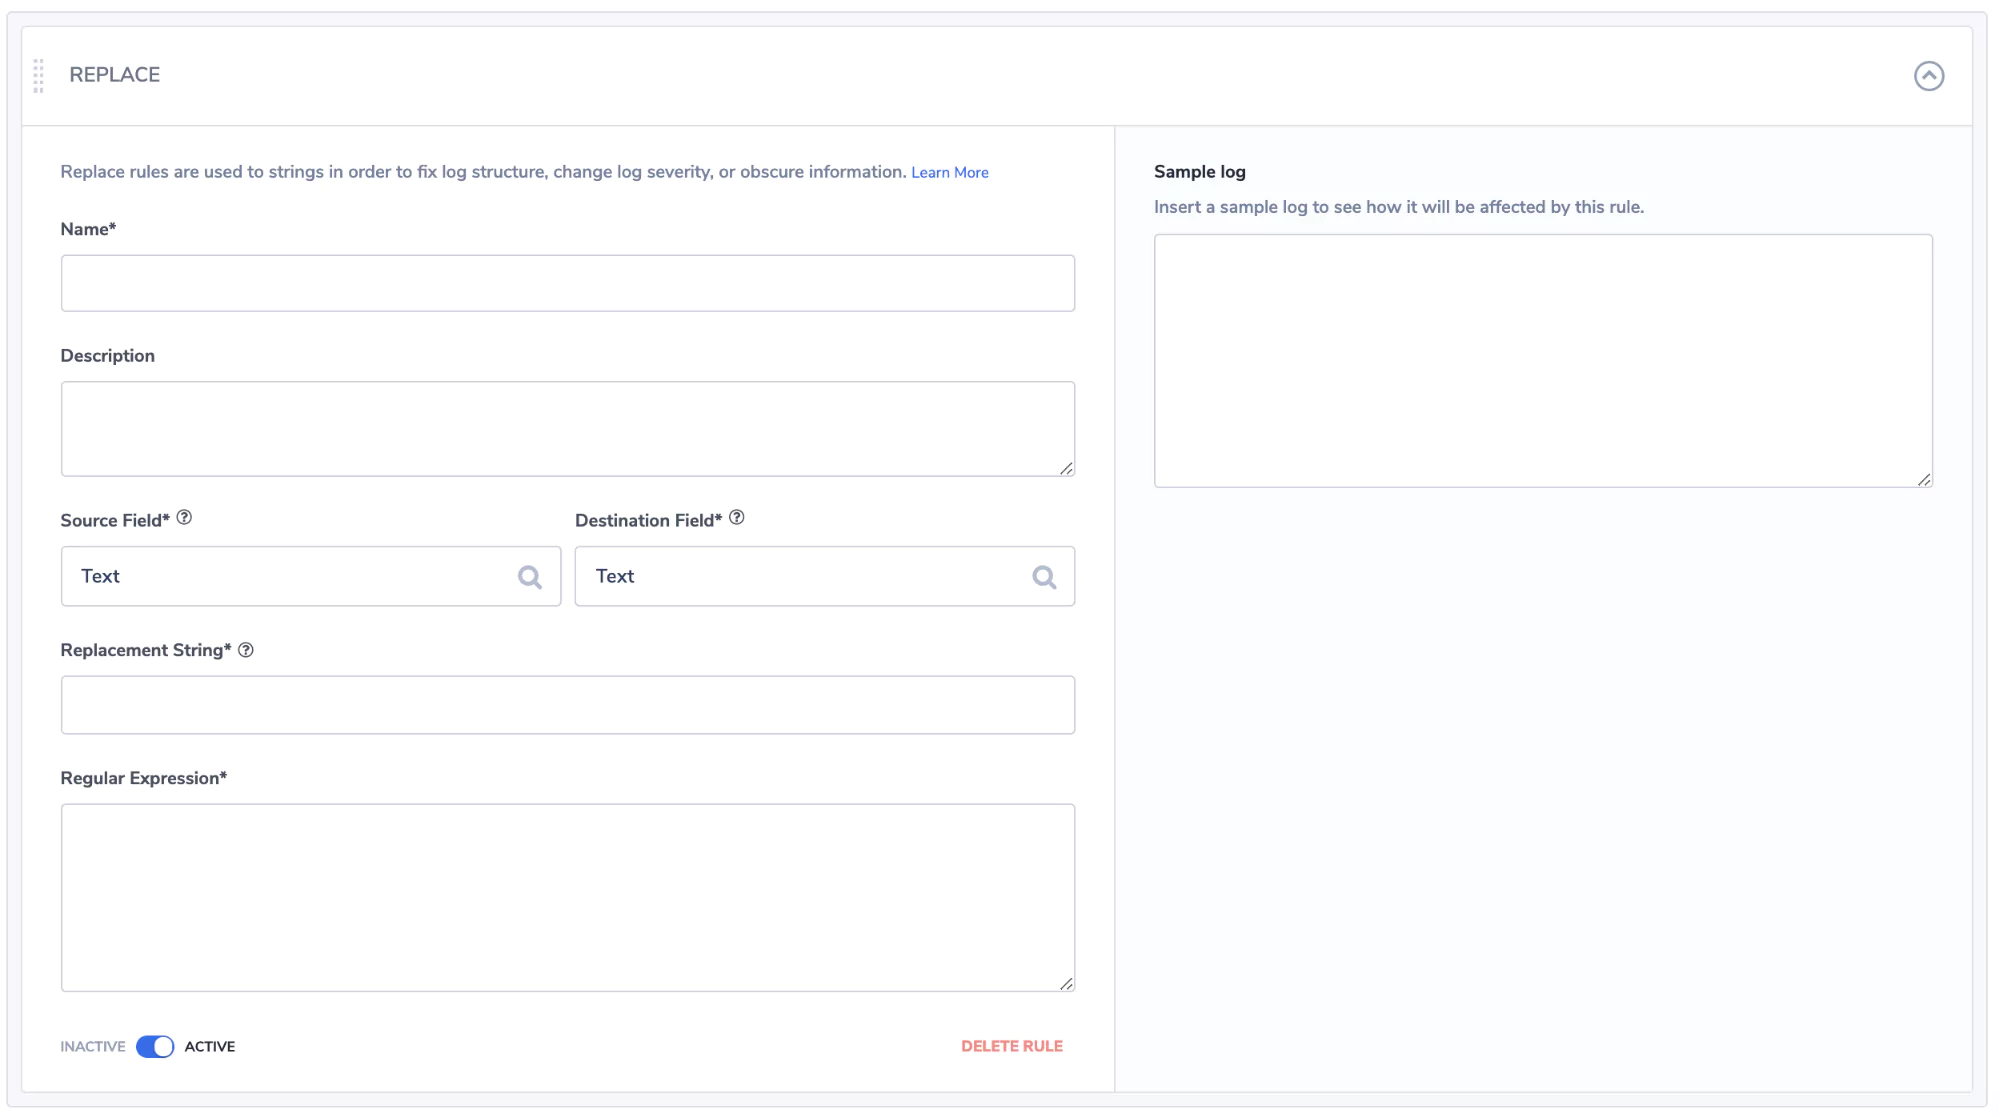
You will note it’s easy to select the right rule type for whatever manipulation you are looking to apply. A common rule is to replace an incoming log. You might want to match a pattern that then sets the severity of the log to critical or similar. If we take a look at the replace rule we can see just how easy it is to create.

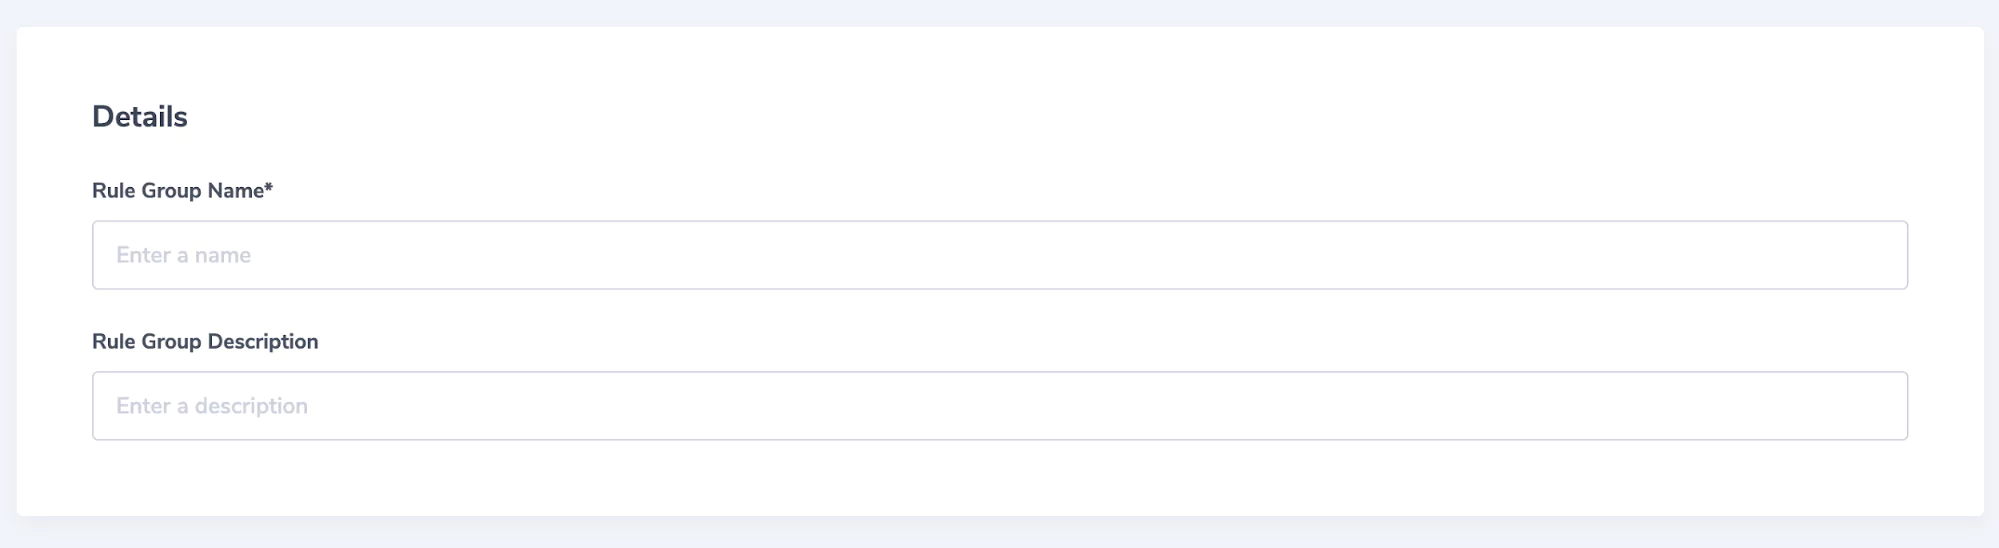
We give the rule a name:

rule naming coralogix

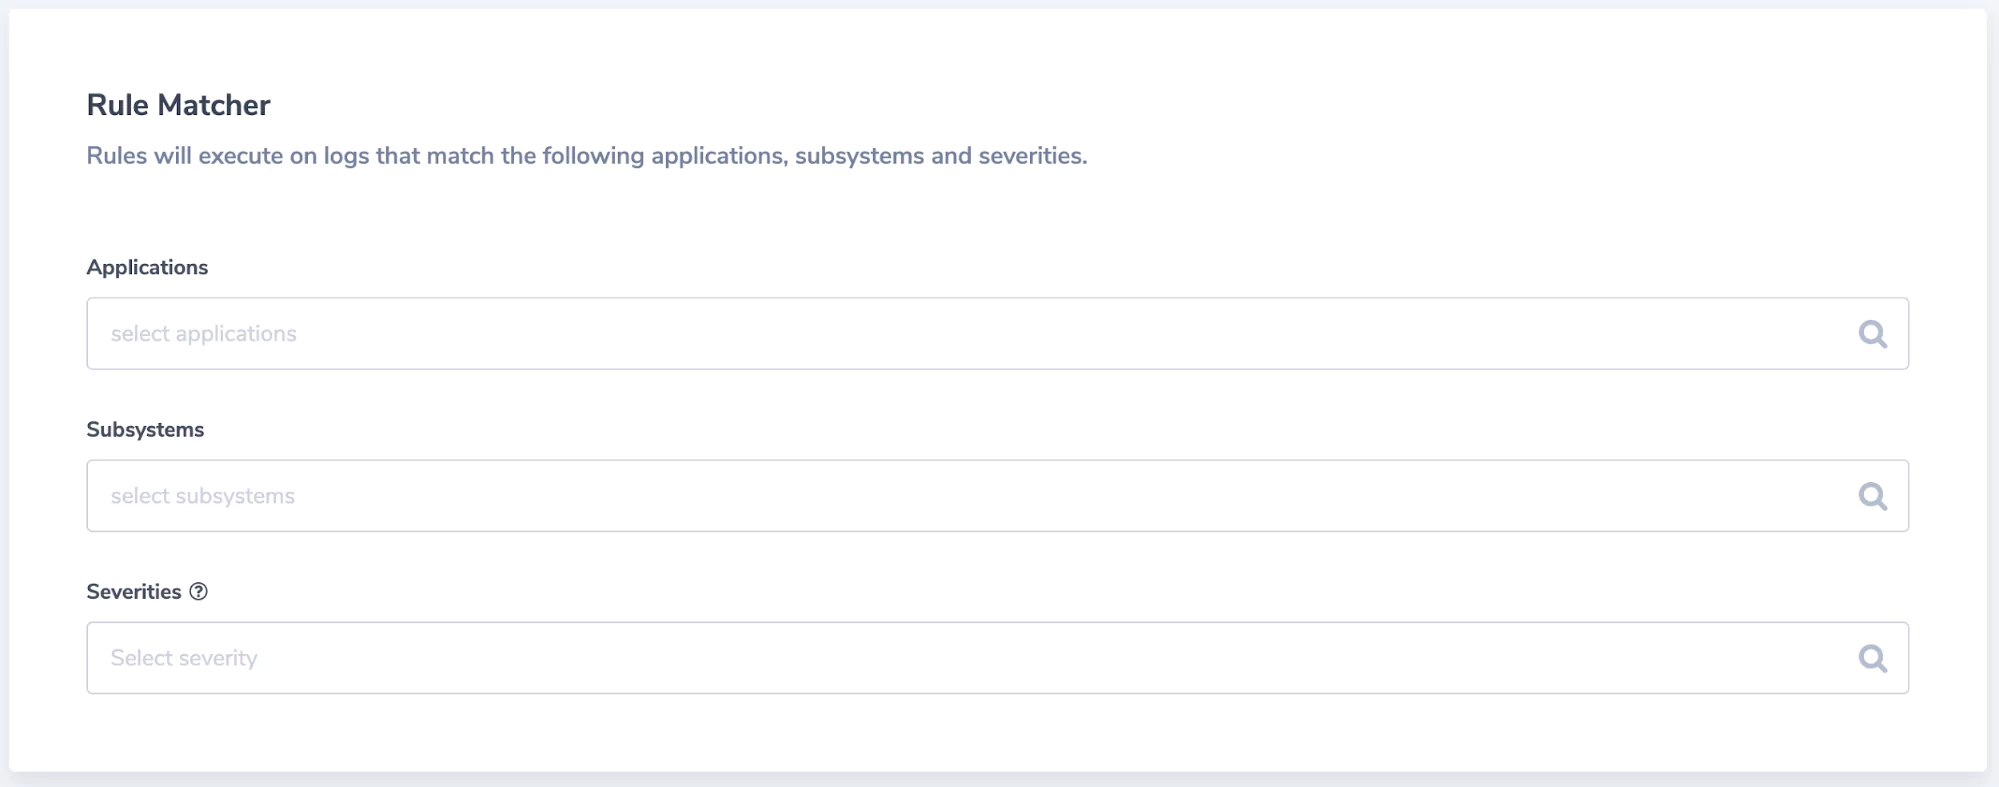
We create a matching rule, to locate the logs we wish to manipulate:

rule matcher coralogix

Finally, we design what is going to be manipulated:

extract and manipulate firewall logs

You can see just how easy Coralogix makes it to extract and manipulate your firewalls logs. This enables you to create a robust data visualization and security alerting solution using the Coralogix platform. 

It’s worth noting GROK patterns are also used in Logstash before the data hits Coralogix. Coralogix has a tutorial that runs through GROK patterns in more detail. It makes sense to just forward all of your logs to Coralogix and create rules using the log parsing rules, it’s much faster and far easier to maintain. 

Creating Index Patterns In Kibana

Now that we have manipulated our data, we can start to visualize it in Kibana. An index pattern tells Kibana what Elasticsearch index to analyze. 

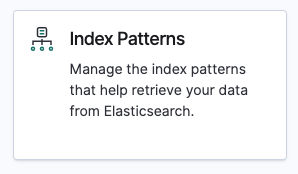
To create a pattern you will need to jump over to the Coralogix portal and load up Kibana. In there click on Index Patterns:

index patterns

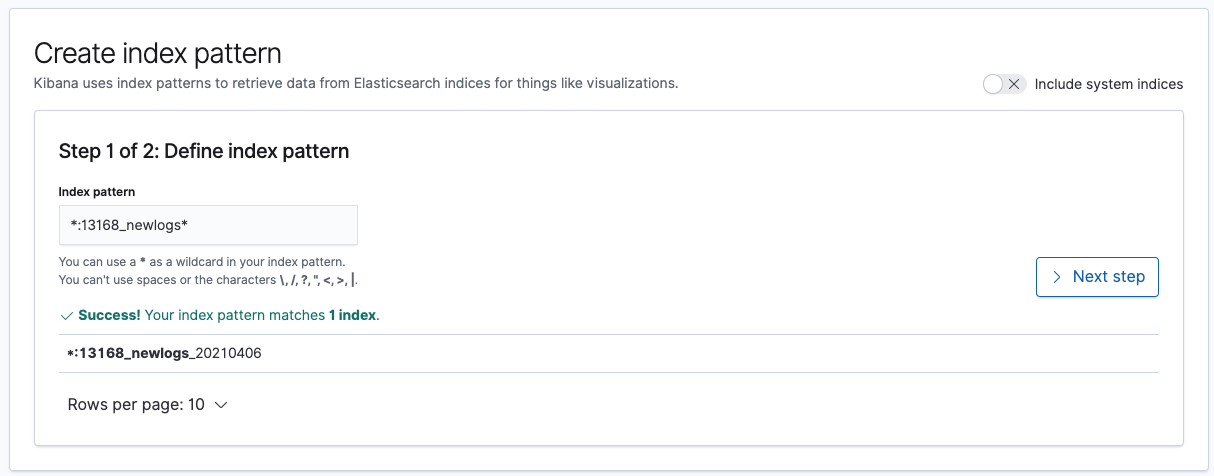
An index pattern is created by typing the name of the index you wish to match, a wild card can be used to specify multiple indexes for querying. An example *:13168_newlogs* will catch any indices that contain 13168_newlogs. Click next once you have matched your pattern.

creating index pattern step 1

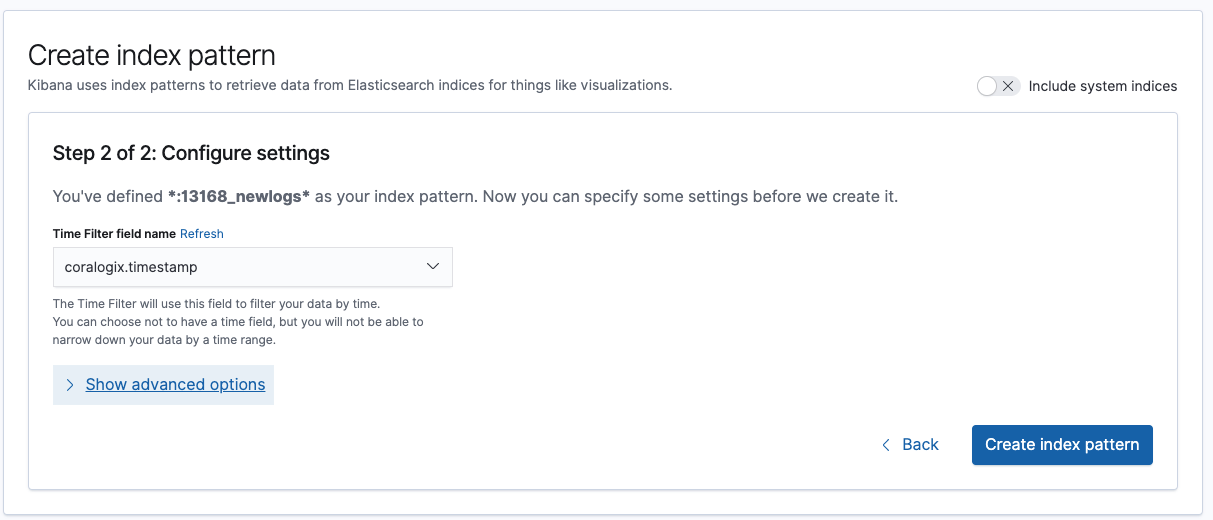
Finally, we need to configure where Kibana will identify the time stamp for filtering records. This can be useful if you want to use metadata created by the firewall:

create index pattern coralogix

Now you have the data all configured, you can start to visualize your firewall logs in Kibana. We would recommend checking out the Kibana Dashboarding tutorial to explore what is possible with Kibana.

Conclusion

In this article, we have explored the value of ingesting firewall logs, we have uncovered the large wealth of data these logs contain, and how they can be used to visualize what activities are taking place on our networks.

Building on what we have explored in this article it should be clear that the more logs you consume and correlate the greater the visibility. This can assist in identifying security breaches, incorrectly configured applications, bad user behavior, and badly configured networks – to name just a few of the benefits. 

Coralogix’s tooling, like log parsing, enables you to ingest logs and transform them into meaningful data simply. Now you are armed with the knowledge, start ingesting your firewall logs! You will be amazed by just how much you learn about your network!

Network Security: The Journey from Chewiness to Zero Trust Networking

Network security has changed a lot over the years, it had to. From wide open infrastructures to tightly controlled environments, the standard practices of network security have grown more and more sophisticated.

This post will take us back in time to look at the journey that a typical network has been on over the past 15+ years. From a wide open, “chewy” network, all the way to zero trust networking.

Let’s get started.

Network Security in the Beginning…

Let’s say we work at a company that’s running a simple three-tiered web architecture. We have a frontend service, a backend service, and a database. It’s 2005, and we run each of our services and the database on a separate machine.

trusted network

The Problem? Our Network is Wide Open to Attack

An attacker gaining any sort of access to our network will be able to move throughout the entire network, exfiltrating data and causing havoc. Basically, our network is wide open to attack. Luckily for us, the fix is quite straightforward. At least, for now.

So, We Introduce Network Segmentation

Word reaches us about the new and improved security best practices, and we segment our network based on the “least privilege” principle. 

The Principle of Least Privilege

The principle of “least privilege” has become a staple of security thinking over the years. Its arguments are common sense. A service should have only the permissions that it needs to complete its function and nothing more. This sounds obvious, but from an engineering perspective, it is often easier to give something wide powers. This helps to avoid the need to revisit application permissions for every new feature change. 

From a networking perspective, the principle of least privilege argues that each server should only have the permissions and network access that it needs to run. Simple, right?

Applying the Principle of Least Privilege to our Network Security

least privilege security

We split each of our servers into its own network. This router makes sure that services can only communicate with their appropriate databases. This is important. It means that if an attacker manages to compromise one of the backend segments, they can not laterally move to the other segments. They can only visit the nodes that we have allowed. This limits the blast radius of an attack and makes for a much more difficult system to hack.

The Problem? Scale!

If we need to add any servers, or run additional services on these servers, the number of rules grows very quickly, as each rule needs to be duplicated by the number of machines. This poses a bit of an issue for us, but as long as the server count remains low, we should be alright. 

Unfortunately, over the past few years, architectural patterns like microservices have massively increased the number of virtual machines that we use. This increase makes this model far less viable, but we’ll get to that.

Moving to the Cloud

Our company, being savvy and technologically forward-thinking, decides to move to an early cloud offering. 

moving to the cloud

So far, so good! We’ve taken the lessons of our physical network segmentation and applied them here. Our instances are segmented from each other using security groups, which are basically firewall rules enforced by a virtual appliance. 

Our new infrastructure enables our company to handle more traffic and, ultimately, make more money. Soon, however, even our shiny cloud infrastructure needs some work. 

Introducing the Cluster

To deal with scale, our company containerizes its services. The services move to a managed Kubernetes cluster, and the database moves to a managed cloud database. 

cluster architecture

Very clean and elegant! (Yes, it’s oversimplified, but bear with me). Our services are now managed and leveraging auto-scale. 

The Problem? Still, Scale…

Our previous network setup relied on some pretty basic assumptions. We had a “Database server” and that server would host our database. We had a “Backend Server” and we could rely, 100% of the time, on our backend server hosting our backend application.

Now, however, there are no dedicated server roles. We find ourselves in a completely different paradigm. Our servers are simply agnostic hosts of docker containers and don’t know a great deal about the internals of these containers. So how do we set up rules to ensure a principle of least privilege?

The Solution? An Entirely New Approach

Before, we were thinking about servers in terms of their networking identity. For example, an IP address. This was adequate, but there is no longer a consistent mapping between IP address and service. We need to stop identifying services by some proxy variable, such as IP, and start identifying services directly. How do we do that, and how do we manage relationships between these identities?

service mesh

The Service Mesh

A service mesh is a relatively new entry into the networking scene. It operates at a much higher level than traditional networking does. Rather than worrying about the underlying switches, routes and such, it registers itself with each application in your system and processes rules about application to application communication. The service mesh has some specific differences from a traditional set up that must be understood.

Intention-Based Security

Intention-based security refers to a style of declaring security rules. Rather than having obscure networking rules that directly configure underlying switches, we declare the intention of each service, at the service level. For example, Service A wishes to communicate with Service B. 

This abstracts the underlying server and means that we no longer have to rely on assumptions about IP addresses. We can declare our intentions directly.

The Mesh Proxy (Sometimes Called Sidecar)

The service mesh is made up of a control plane and a network of proxies. The control plane configures the proxies, based on the intentions declared by the user. The proxies then intercept all traffic moving in and out of the service and, if the rules apply, will transform, reroute or block the traffic entirely. This network of proxies makes up the service mesh.

The Problem? Risk of System Disruptions

The most obvious drawback of this architecture is that there are many, many proxies. At least one per service. This means that a single broken proxy can disrupt all traffic for a service. We need to be able to monitor the health and configuration for each of these proxies, otherwise we will quickly lose the ability to track down problems.

The Solution? A Powerful Observability Platform

Observability is the answer here. You need a powerful platform, through which you can interrogate your infrastructure. You can find out about memory, CPU and networking status of your proxies and services, and ensure that your entire service mesh is running optimally.

Coralogix provides world class observability and regularly processes over 500,000 events, every second. If you need to level up your insights and gain new control over your system, check out how we can help.

Our Journey

We began with simple networking rules that blocked traffic from server to server. As we can see, the arms race between security and sophisticated software techniques continues. We have arrived at a point where we can directly declare services, by their human readable names, and control traffic through a network of distributed proxies.

Wherever you find yourself on this journey, the most exciting thing is that there is always somewhere new to go!