The Fourth Pillar of Observability

Your application is only as reliable as the infrastructure it runs on. Most commonly, that means Kubernetes is doing the job by managing fleets of containers, scaling services on demand, and keeping workloads distributed across nodes.
Traditional dashboards weren’t built to scale with this reality. They give you snapshots of raw metrics. They don’t scale to multi-cluster environments. They don’t map relationships between resources. And they can’t keep up with the constant churn of Kubernetes workloads.
What’s missing is a way to see Kubernetes in full context, not just in fragments.
If you’re already sending logs, metrics, and traces to Coralogix, adding infrastructure visibility is the natural next step. Infrastructure Explorer extends observability to your Kubernetes layer making it the fourth pillar of observability and a powerful catalyst for the rest of your Coralogix stack.
Why Infrastructure Explorer?
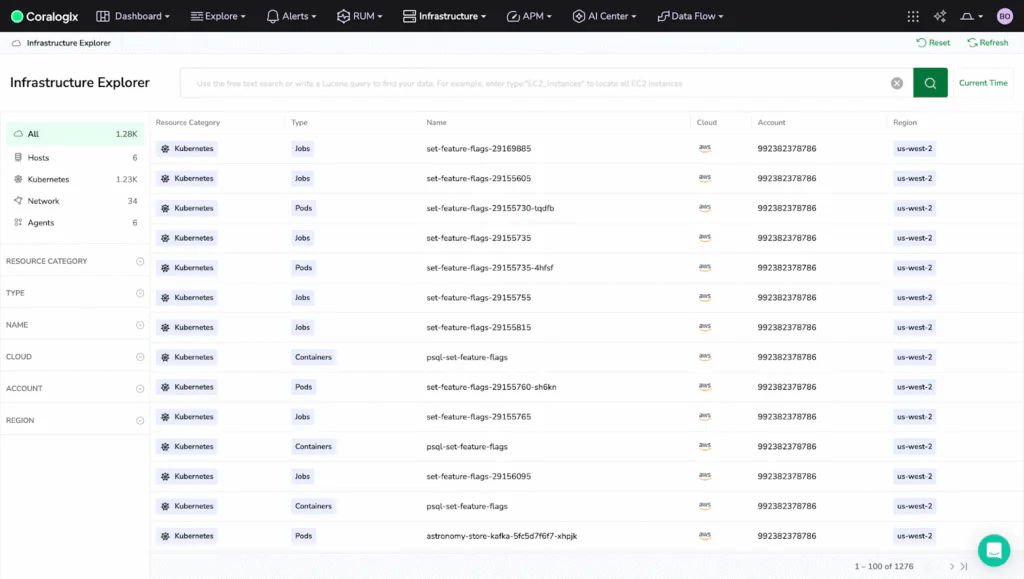
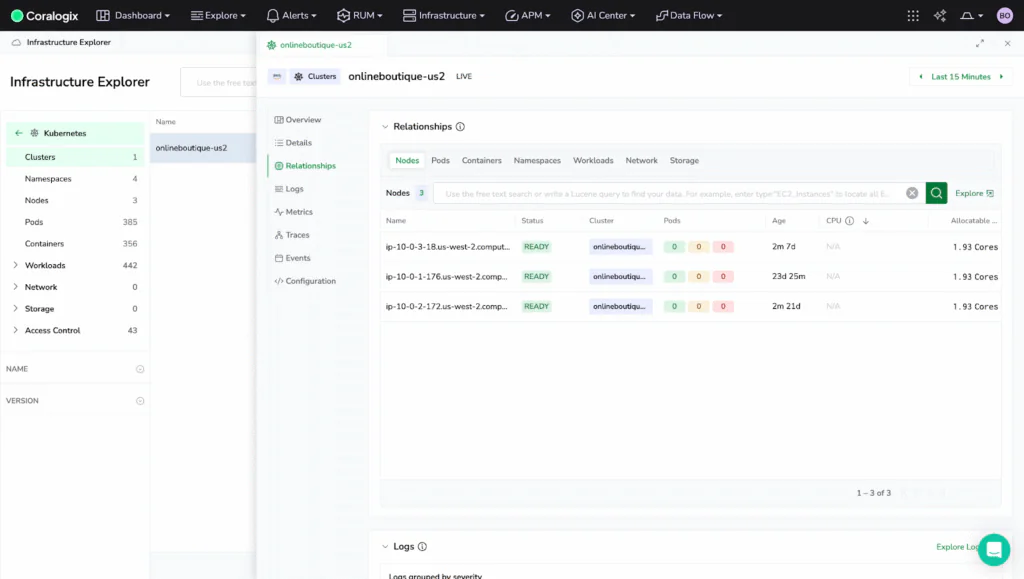
Infrastructure Explorer gives you a live, searchable inventory of every resource across clusters, pods, nodes, containers, services, and more. With real-time context like tags, relationships, versions, and ownership, it goes beyond charts to answer: what’s running, where, and why.
And because it’s fully integrated into Coralogix, you can jump seamlessly from application-level issues to the underlying infrastructure without losing context.
Beyond the Kubernetes Dashboard
Infrastructure Explorer fills the gaps left by traditional dashboards. Here’s how:
Fragmented visibilty → cross cluster insight
A Kubernetes Dashboard shows you one cluster at a time. Coralogix shows you all clusters at once, with relationships mapped across pods, nodes, and volumes.
Slow debugging → context-rich troubleshooting
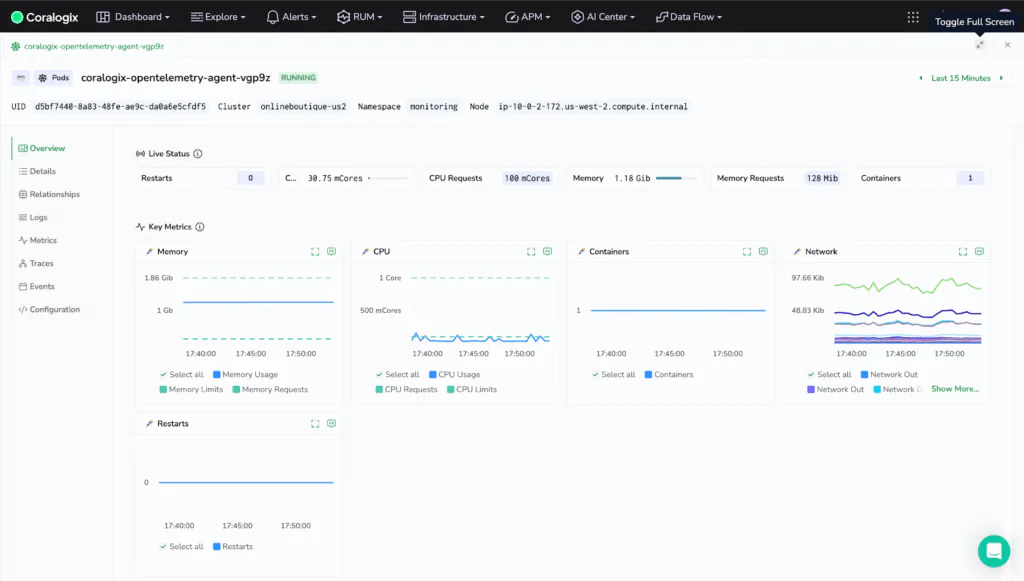
Debugging failing pods or misbehaving nodes usually means switching between multiple dashboards and piecing data together manually. Infrastructure Explorer consolidates events, metrics, configurations, and logs into one view for faster diagnosis.
Resource waste → smarter optimization
Noisy neighbors, over-provisioning, and hidden bottlenecks drive up costs. Coralogix surfaces resource-intensive nodes and pods so you can right-size workloads and prevent runaway bills
Configuration drift → change tracking
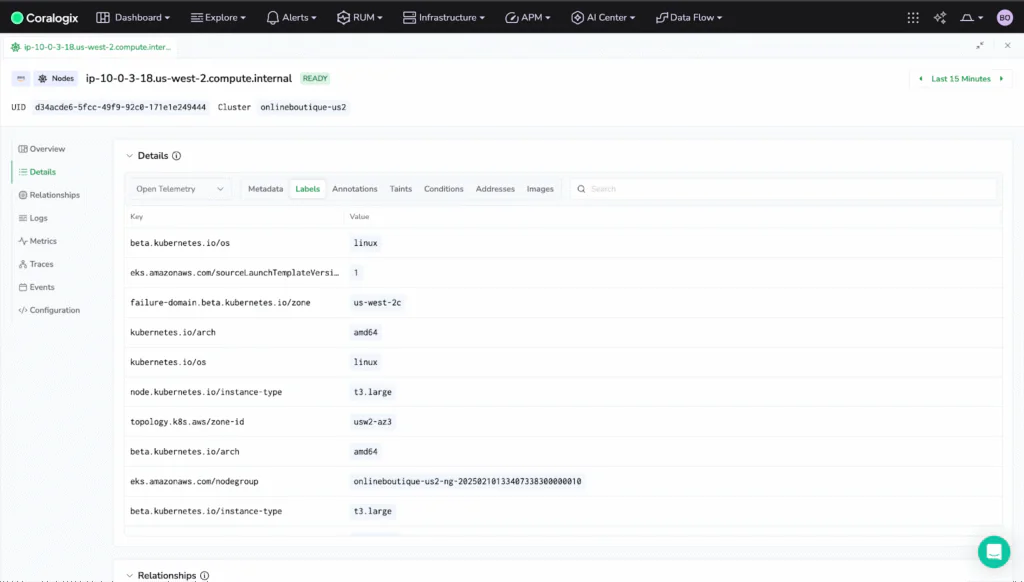
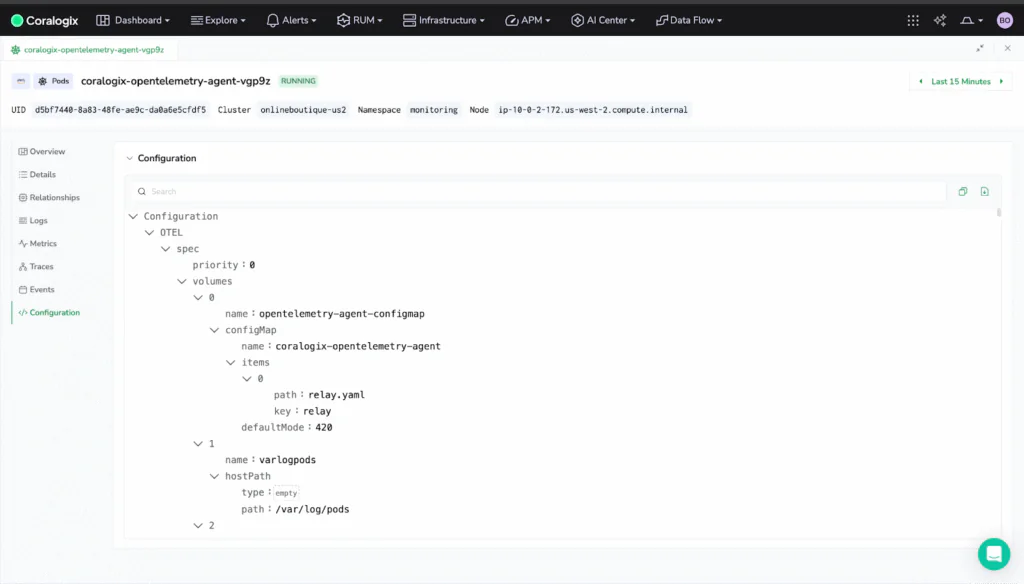
Version mismatches and uncontrolled changes lead to downtime. Infrastructure Explorer tracks metadata and configurations over time, so you spot drift before it becomes an outage.
A native fit in your Coralogix stack
For teams already using Coralogix, Infrastructure Explorer isn’t a separate tool; it’s just an extension of your observability stack. Logs, metrics, traces—and now, infrastructure data—all live in one place. That means:
- Faster incident resolution with full context
- Reduced reliance on manual reports and dashboards
- Stronger governance and accountability across teams
- Optimized resource usage and cloud spend
If you’re scaling, collaborating, or just tired of cobbling together metrics from scattered tools, Infrastructure Explorer is built for your future state.
Ready to complete your observability stack? Learn more about Infrastructure Explorer in Coralogix.