The new standard of observability is here. Discover Olly, the industry’s first
Using OpenTelemetry with Jaeger: Basics and Quick Tutorial

How Does Distributed Tracing Work with OpenTelemetry and Jaeger?
Overview of Distributed Tracing
Distributed tracing plays a central role in observing complex modern application architectures. It provides detailed tracking of how requests navigate through different components of microservice-focused environments. Each trace captures and records the entire lifecycle of a request from start to finish. This identifies bottlenecks or failures in part of the application stack.
Through distributed tracing, developers gain a detailed perspective on service interactions, helping optimize performance. It ensures transparency in performance across service boundaries. Having this visibility matters, especially when dealing with spontaneous performance issues arising from polyglot architectures or network-related stresses.
The Role of OpenTelemetry in Tracing
OpenTelemetry serves as the standard for application instrumentation, enabling trace data collection across various systems. It reduces the burden of instrumenting application code by offering consistent APIs and SDKs in multiple programming languages. The platform-agnostic implementation supports the inclusive collection of trace data, covering varying technology stacks within distributed architectures.
Beyond providing APIs and SDKs, OpenTelemetry offers an exporter framework. This framework supports data transmission to various backends, including Jaeger, without modifying application code. It also lowers implementation complexity, allowing organizations to adapt their observability strategies as needed.
Learn more in our detailed guide to OpenTelemetry tracing
The Role of Jaeger in Tracing
Jaeger improves distributed tracing by providing visualization and analysis capabilities. It supports end-to-end tracking and performance bottleneck identification by transforming raw trace data into accessible formats. Developers can interact with trace data using Jaeger’s user-friendly interface, which filters and inspects traces.
Through Jaeger’s integration with OpenTelemetry, trace data ingestion becomes more efficient, providing real-time insights. Jaeger’s architecture supports scalable data storage and retrieval, making it suitable for high-throughput environments. By acting as a backend for tracing data, Jaeger amplifies OpenTelemetry’s data collection capabilities with a visualization tool.
Benefits of Using OpenTelemetry with Jaeger
Integrating OpenTelemetry with Jaeger provides a combination for observing, troubleshooting, and optimizing distributed systems. Here are the key benefits:
- End-to-end visibility across systems: OpenTelemetry captures telemetry data from diverse environments, while Jaeger visualizes it, providing traceability of requests across distributed microservices. This ensures developers can track the full lifecycle of a request, pinpointing issues across multiple services or layers.
- Enhanced performance monitoring: Jaeger’s trace visualization highlights latency bottlenecks and inefficiencies. When combined with OpenTelemetry’s instrumentation, teams can monitor and address performance issues with precision.
- Standardization and interoperability: OpenTelemetry’s standardized APIs and SDKs ensure data collection across various platforms and programming languages. Jaeger complements this by offering a backend that integrates effortlessly, supporting cross-platform observability.
- Scalability for high-throughput environments: Jaeger’s architecture supports handling vast amounts of trace data, making it suitable for large-scale, distributed systems. This scalability is enhanced by OpenTelemetry’s efficient data exporting mechanisms.
- Flexible data exporting: OpenTelemetry’s exporter framework allows organizations to send trace data to multiple backends, including Jaeger, without modifying the application code. This flexibility simplifies adaptation to changing observability needs.
- Improved troubleshooting and root cause analysis: By combining OpenTelemetry’s data collection with Jaeger’s trace analysis, developers can rapidly identify and resolve root causes of failures or performance degradation.
- Future-proof observability: OpenTelemetry’s ongoing community-driven development ensures compatibility with emerging standards and technologies. Jaeger’s support for OpenTelemetry guarantees continued relevance in modern observability practices.
Related content: Read our guide to OpenTelemetry collector

Tutorial: Integrating Jaeger with OpenTelemetry
This tutorial outlines how to integrate OpenTelemetry with Jaeger for distributed tracing in a Python application. By following these steps, developers can set up OpenTelemetry instrumentation, export traces to Jaeger, and use Jaeger to analyze and visualize trace data.
Step 1: Install Jaeger through Docker
First, deploy the Jaeger backend. The following command runs Jaeger in an all-in-one mode using Docker:
docker run -d --name jaeger
 -e COLLECTOR_OTLP_ENABLED=true
  -p 5775:5775/udp
  -p 6831:6831/udp
  -p 6832:6832/udp
  -p 5778:5778
  -p 16686:16686
  -p 14268:14268
  -p 14250:14250
  -p 9411:9411
  jaegertracing/all-in-one:latest
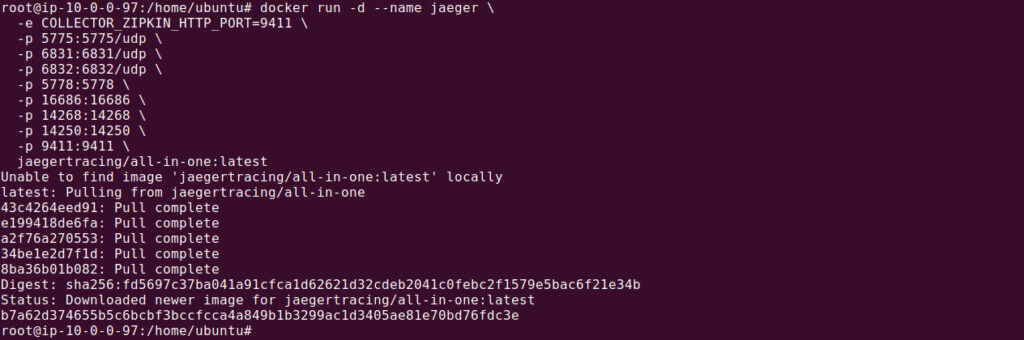
This sets up Jaeger, exposing necessary ports for data collection and visualization. The Jaeger UI will be available at http://localhost:16686.
Step 2: Install the Requisite Python libraries
Install OpenTelemetry and Jaeger libraries using pip. They can be included in a Dockerfile for containerized applications:
FROM python:3.8

RUN pip install opentelemetry-api opentelemetry-sdk
opentelemetry-instrumentation requests jaeger-client
opentelemetry-exporter-otlp
This ensures that all required dependencies for OpenTelemetry and Jaeger are available.
Step 3: Configure the OpenTelemetry Exporter
Set up the OpenTelemetry exporter to send traces to the Jaeger backend. Below is an example configuration in Python:
import os
from opentelemetry import trace
from opentelemetry.exporter.otlp.proto.grpc.trace_exporter import OTLPSpanExporter
from opentelemetry.sdk.resources import Resource
from opentelemetry.sdk.trace import TracerProvider
from opentelemetry.sdk.trace.export import BatchSpanProcessor

# Get OTLP endpoint from environment variables (defaulting to localhost for Jaeger)
otlp_endpoint = os.getenv("OTLP_ENDPOINT", "http://localhost:4317")

# Configure the tracer provider and resources
trace.set_tracer_provider(
    TracerProvider(
        resource=Resource.create({"service.name": "example-application-name"})
    )
)

# Configure the OTLP exporter
otlp_exporter = OTLPSpanExporter(endpoint=otlp_endpoint)

# Append the exporter to the tracer provider
trace.get_tracer_provider().add_span_processor(
    BatchSpanProcessor(otlp_exporter)
)

# Example span usage
tracer = trace.get_tracer(__name__)
with tracer.start_as_current_span("example-operation"):
    print("Doing some traced work!")
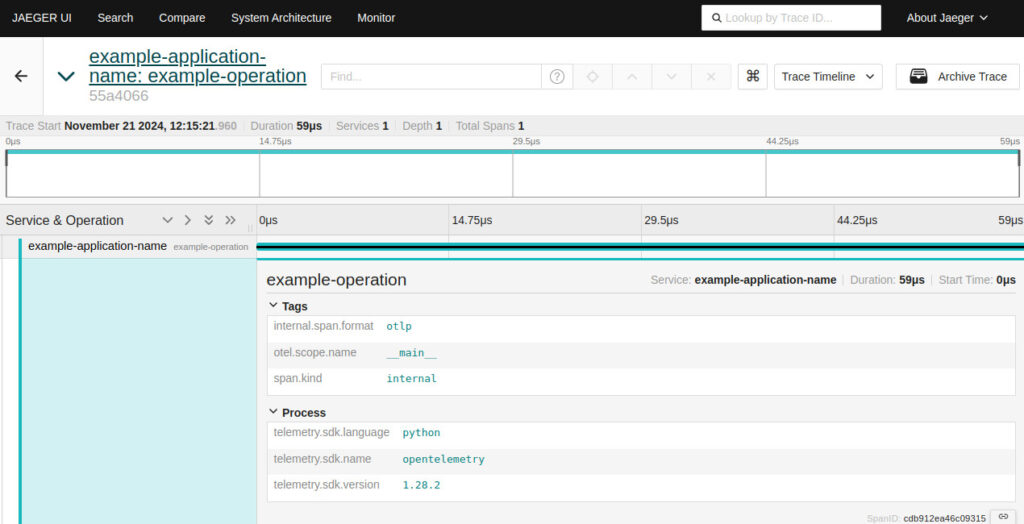
This script sets up the exporter, specifying the Jaeger agent’s host and port. It ensures traces are collected and sent to Jaeger.
We can execute the above code using the following command (assuming the above file is stored as exporter.py).
python3 exporter.py

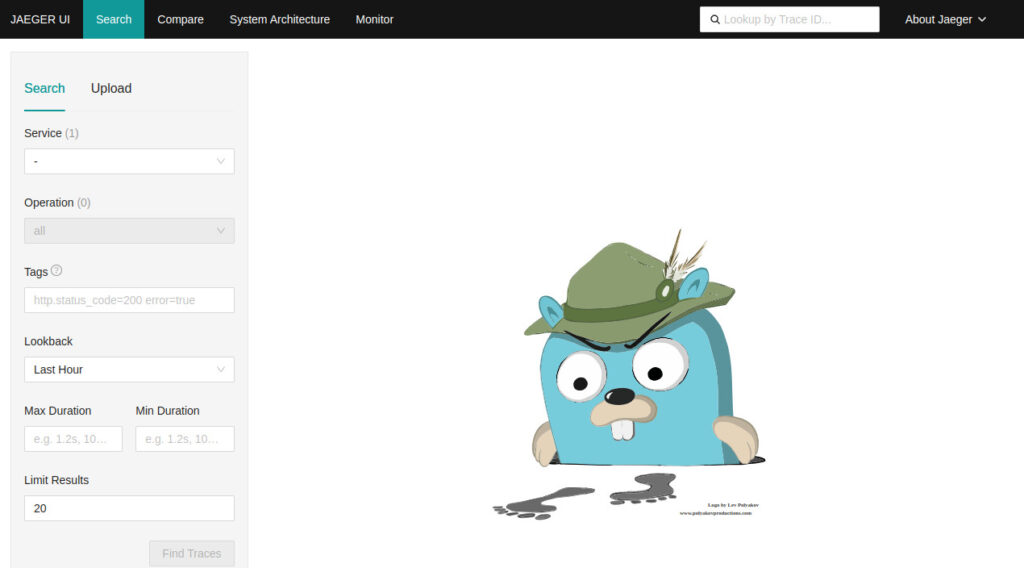
Now let’s see Jaeger UI to confirm if any data has been collected:
Step 4: Set Up Auto-Instrumentation
OpenTelemetry supports automatic instrumentation for many frameworks. For example, to instrument a Flask application:
from opentelemetry.instrumentation.flask import FlaskInstrumentor
from flask import Flask

# Create the Flask application
app = Flask(__name__)

# Automatically instrument the Flask app
FlaskInstrumentor().instrument_app(app)

@app.route("/")
def hello():
    return "Hello, OpenTelemetry!nn"

if __name__ == "__main__":
    app.run(debug=True, host="0.0.0.0", port=5000)
This instrumentation automatically collects traces for all incoming HTTP requests.
Step 5: Verify the Tracing
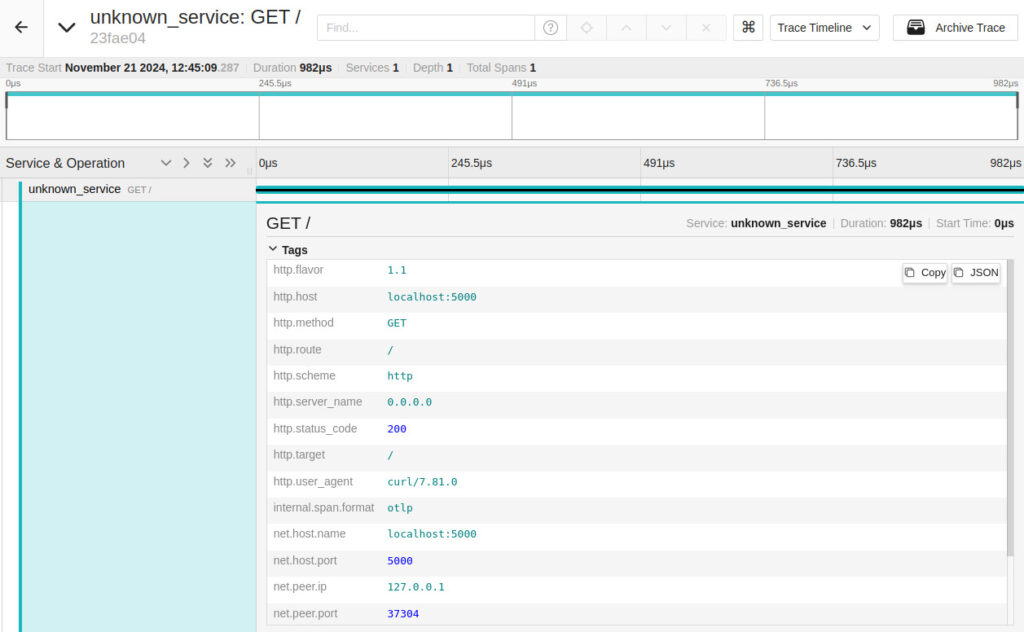
Run the application and generate requests. Then, confirm that traces are being captured and exported to Jaeger by using the Jaeger UI:
curl http://localhost:5000/

Open the Jaeger UI at http://localhost:16686, search for the service, and ensure the traces appear correctly.
Step 6: View and Investigate Traces
Use the Jaeger UI to analyze trace data. Developers can filter, search, and visualize traces to identify bottlenecks, track dependencies, and optimize performance.
Managed Observability with Coralogix
Coralogix sets itself apart in observability with its modern architecture, enabling real-time insights into logs, metrics, and traces with built-in cost optimization. Coralogix’s straightforward pricing covers all its platform offerings including APM, RUM, SIEM, infrastructure monitoring and much more. With unparalleled support that features less than 1 minute response times and 1 hour resolution times, Coralogix is a leading choice for thousands of organizations across the globe.