ELK Stack: Definition, Use Cases, and Tutorial


ELK Stack Architecture and Components
Elasticsearch
Elasticsearch is a real-time, distributed storage, search, and analytics engine. It works well in environments where scalability and resilience are critical. Elasticsearch is built on top of Apache Lucene, a high-performance, full-featured text search engine library. It extends Lucene’s capabilities and provides a distributed search engine with an HTTP web interface and schema-free JSON documents.
Elasticsearch is designed to handle a variety of use cases, from text search to analytics to geospatial data processing. With Elasticsearch, you can store a variety of structured and unstructured data and perform complex queries on them to extract meaningful insights.
Elasticsearch can scale to handle large volumes of data and perform complex searches quickly. It can distribute data and query loads across all the nodes in a cluster, ensuring high availability and maintaining performance even as data volumes grow.
Learn more in our detailed guides to:
- Elasticsearch overview and tutorial
- Elasticsearch on AWS
- Elasticsearch architecture(coming soon)
Logstash
Logstash is a tool for managing events and logs. It can ingest data from a variety of sources, transform it, and send it to your desired destination. Logstash’s flexibility makes it suitable for transporting logs from various sources into Elasticsearch or other storage systems.
Logstash allows you to collect data in real time from web servers, log files, cloud services, and various other sources. It can then transform and enrich the data before sending it to Elasticsearch (or another chosen destination). This transformation can include tasks like parsing unstructured log data into structured data, enriching data with additional metadata, and more.
Logstash’s pipeline architecture makes it highly flexible and capable of handling diverse data processing needs. It’s built around an event processing pipeline, where data flows from inputs to filters to outputs. Each stage of the pipeline can be fully customized to handle specific data processing tasks.
Kibana
Kibana is a data visualization and exploration tool for Elasticsearch. It provides a user-friendly interface for viewing, analyzing, and visualizing data stored in Elasticsearch indices. Kibana makes it easy to understand large volumes of data by providing a variety of visualizations, ranging from simple line graphs to complex histograms and geospatial data maps.
Kibana is designed to work seamlessly with Elasticsearch’s capabilities, allowing you to perform complex data analysis and visualization tasks. It also includes features for managing your Elastic Stack, such as managing index patterns and configuring and managing ingest pipelines.
Kibana’s interface is designed to be user-friendly, even for non-technical users. It allows you to create and save custom dashboards, making it easy to share insights across your organization.
Learn more in our detailed guides to:
- Kibana dashboard (coming soon)
- ELK stack architecture(coming soon)
ELK Stack Use Cases
Let’s look at some of the common applications for the ELK stack.
Development and Troubleshooting
Developers can use the stack to collect, process, and visualize log data from their applications. This can help them identify and fix issues quickly, reducing downtime and improving application performance.
For example, if an application is experiencing performance issues, developers can use Elasticsearch to quickly search through logs to identify potential problems. They can then use Kibana to visualize this data, making it easier to understand and analyze.
Cloud Operations
In cloud operations, maintaining visibility into application and infrastructure performance is critical. The ELK stack provides powerful tools for collecting, processing, and visualizing cloud-based data.
With Logstash, you can collect data from various cloud services, transform it into a structured format, and send it to Elasticsearch for storage and analysis. Kibana allows you to visualize this data, helping you identify trends, detect anomalies, and troubleshoot issues.
Application Performance Monitoring (APM)
With its search and analytics capabilities, you can use the ELK stack to monitor application performance in real time, identify performance bottlenecks, and troubleshoot issues.
With APM, you can collect detailed performance data from your applications, store it in Elasticsearch, and use Kibana to analyze and visualize this data. This can help you quickly identify and resolve performance issues, improving the overall performance and user experience of your applications.
Security and Compliance
The ELK stack’s powerful data collection, processing, and visualization capabilities are also useful for security. It can help you monitor your systems for security threats, identify potential vulnerabilities, and maintain compliance with various regulations.
For example, you can use Logstash to collect log data from various systems, enrich it with additional metadata (such as geolocation data or threat intelligence data), and send it to Elasticsearch for storage and analysis. Kibana’s visualization helps you identify potential threats and respond quickly.
ELK Challenges and Solutions
Like all technology stacks, ELK has its limitations. Let’s look at some of these challenges and how you can work around them.
Limited Storage Capacity
A common situation for IT professionals is a constant influx of data that fills up storage spaces, hindering the performance and effectiveness of the ELK stack.
To tackle this issue, it’s important to implement regular log cleanups to free up storage space. However, it’s important to ensure that valuable data isn’t accidentally deleted during these cleanups. Establishing a system that archives older logs and removes redundant data can also help in managing storage capacity.
Sub-Optimal Indexing
If Elasticsearch indexing is not managed properly, it can lead to slower search speeds, impacting the overall efficiency of data analysis.
To address this issue, it’s important to implement an effective indexing strategy. This involves structuring your data in a way that makes it easier to search. For example, you can create indices based on the time that logs are generated. This way, when you’re searching for specific logs, the system can quickly narrow down the possible indices it needs to search, speeding up the process.
Another approach is to use index templates. These are templates that dictate the settings and mapping of newly created indices. They can ensure that all your indices follow a consistent structure, making them easier to manage and search.
Networking Problems
Networking problems can range from issues with the network infrastructure to problems with the communication between different components of the stack.
One of the first steps to take when addressing networking issues is to thoroughly review the network configuration. This involves checking the network protocols, ports, firewalls, and any other factors that could potentially disrupt the communication between the different components of the ELK stack.
In addition, it’s essential to monitor network performance regularly. This can help in identifying any potential issues early on and addressing them before they escalate. Tools like Elastic’s Packetbeat can be helpful in this regard.
Noisy Logs
Noisy logs are logs that contain a lot of information, but not all of it is useful. This can make it difficult to filter out the valuable data and can also take up unnecessary storage space.
To overcome this, it’s essential to have a well-defined logging policy. This means determining what kind of information needs to be logged and what can be left out. This not only reduces the noise in your logs but also helps in making them more meaningful and easier to analyze.
Another effective technique is to use log filters. These are rules that determine what kind of log data gets stored. By setting up log filters, you can ensure that only the most relevant and valuable data is retained.
ELK Tutorial: Getting Started with the ELK Stack
Prerequisites
To get started with the ELK stack, there are several prerequisites you’ll need to meet. First, you’ll need an Ubuntu 22.04 server equipped with 4GB of RAM and 2 CPUs. This setup is considered the minimum requirement for running Elasticsearch efficiently. The actual resources your Elasticsearch server will require can vary based on the volume of logs you anticipate processing.
Here are the key requirements:
- Ubuntu 22.04 Server: A basic setup with a non-root sudo user is necessary. This forms the foundation of your ELK stack environment.
- OpenJDK 11: Java is essential for Elasticsearch, and OpenJDK 11 is the recommended version. Installation instructions are readily available and straightforward.
- NGINX: This is used as a reverse proxy for Kibana, helping to secure and manage access to the Kibana dashboard.
- TLS/SSL Certificate: While optional, securing your server with an SSL certificate is strongly recommended to protect sensitive data from unauthorized access.
Additionally, if you’re planning to use encryption for SSL certification, you should have a fully qualified domain name (FQDN) and proper DNS records set up for your server. This includes an A record for your domain that points to the relevant server’s IP address, ensuring that your server is reachable and secure.
Step 1: Install and Configure Elasticsearch
Elasticsearch installation begins with adding Elastic’s package source list to your Ubuntu’s APT sources. This process involves importing the Elasticsearch public GPG key to ensure package authenticity. The key is imported using the curl command, which is then piped to gpg –dearmor for processing. Once the key is added, you can proceed to add the Elastic source list to your sources.list.d directory, which tells APT where to find Elasticsearch packages.
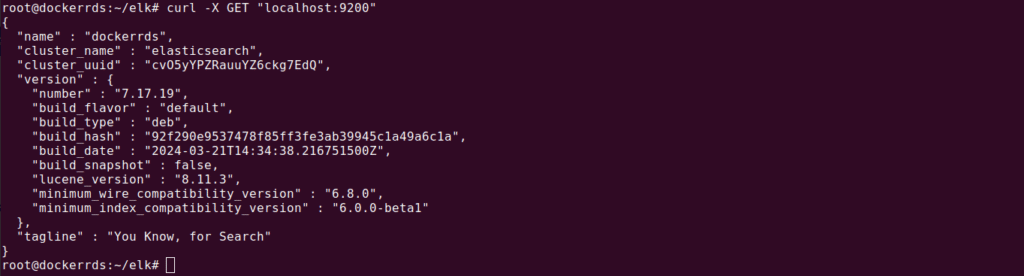
After updating your package lists to include the new Elastic source, you can install Elasticsearch by running the sudo apt install elasticsearch command. Make your desired configuration adjustments to the elasticsearch.yml file, focusing primarily on network settings to enhance security. For example, setting the network host to localhost restricts external access, protecting your data.
Starting and enabling the Elasticsearch service ensures it runs on system boot, with a simple test confirming its operational status.
Step 2: Install and Configure the Kibana Dashboard
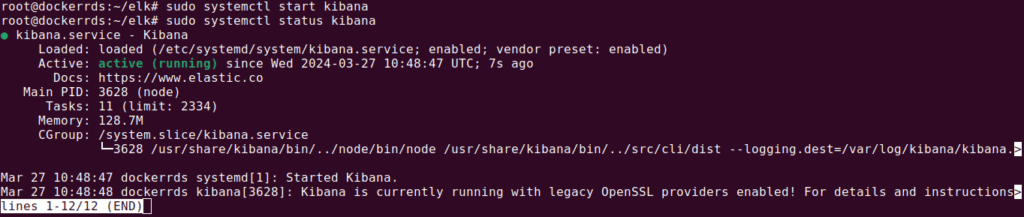
With Elasticsearch installed, you can proceed to installing Kibana using the APT package manager, taking advantage of the Elastic package source added earlier. Kibana installation includes enabling and starting the service, then configuring NGINX as a reverse proxy to allow external access. Use the sudo apt install kibana command, followed by sudo systemctl enable kibana.
This setup involves creating an administrative user for Kibana access and configuring NGINX to direct traffic to the Kibana application running on localhost.
An important security step is to create an NGINX server block file, configuring basic authentication and specifying proxy settings to ensure Kibana is securely accessible from the outside. After linking the new configuration and restarting NGINX, you can adjust firewall settings to allow traffic through.
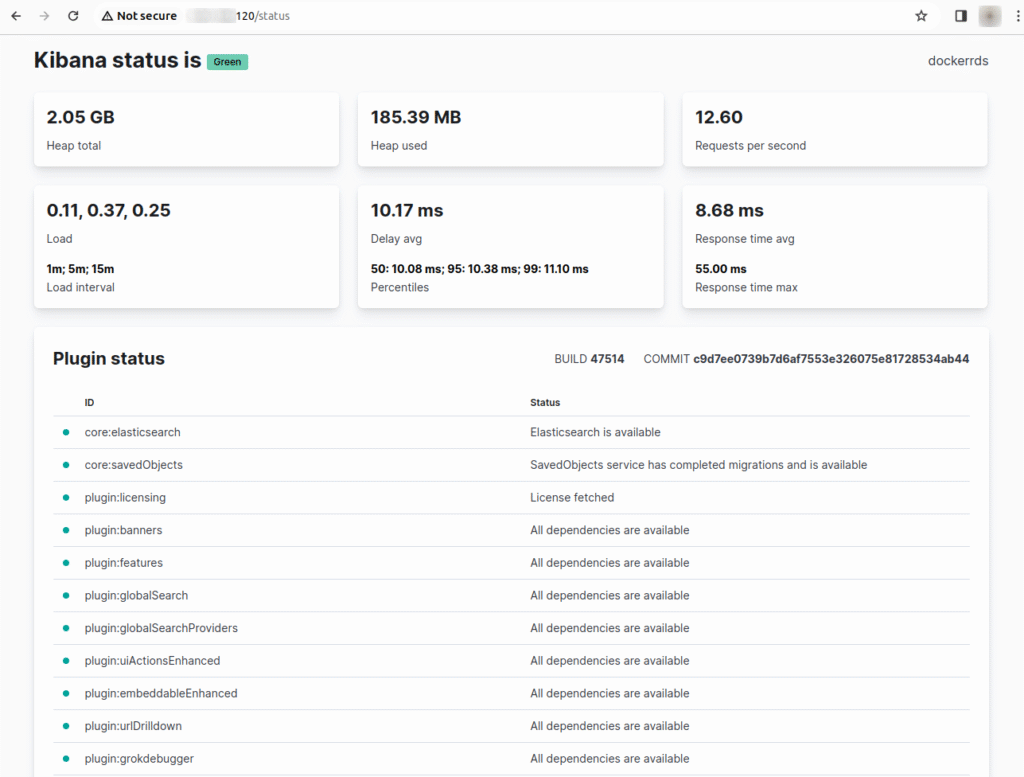
Kibana can now be accessed via your server’s FQDN or public IP address, where you can check the server’s status and begin exploring its capabilities.
Step 3: Install and Configure Logstash
Logstash offers the flexibility to collect data from various sources, transform it, and export it to Elasticsearch or another destination. Configuration files are placed in the /etc/logstash/conf.d directory, defining the input, filter, and output stages of the data processing pipeline.
This setup allows Logstash to receive data from Filebeat, process it according to your specifications, and then send it to Elasticsearch. After configuring Logstash, you test the configuration and, if successful, start and enable the service to begin processing data.
Step 4: Install and Configure Filebeat
Filebeat is part of the Beats family, designed to collect and ship log files efficiently. After installing Filebeat, you can configure it to send data to Logstash for processing. This involves disabling the Elasticsearch output and enabling the Logstash output in the Filebeat configuration file.
Additional setup includes enabling the system module to collect system logs and loading the necessary ingest pipeline and index template into Elasticsearch.
Finally, after setting up Filebeat, you start and enable the service, completing the data shipping setup to Logstash and then to Elasticsearch.
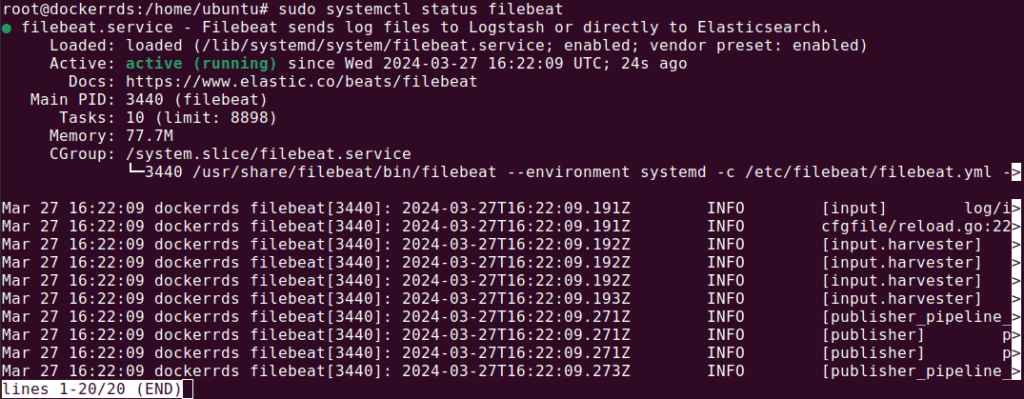
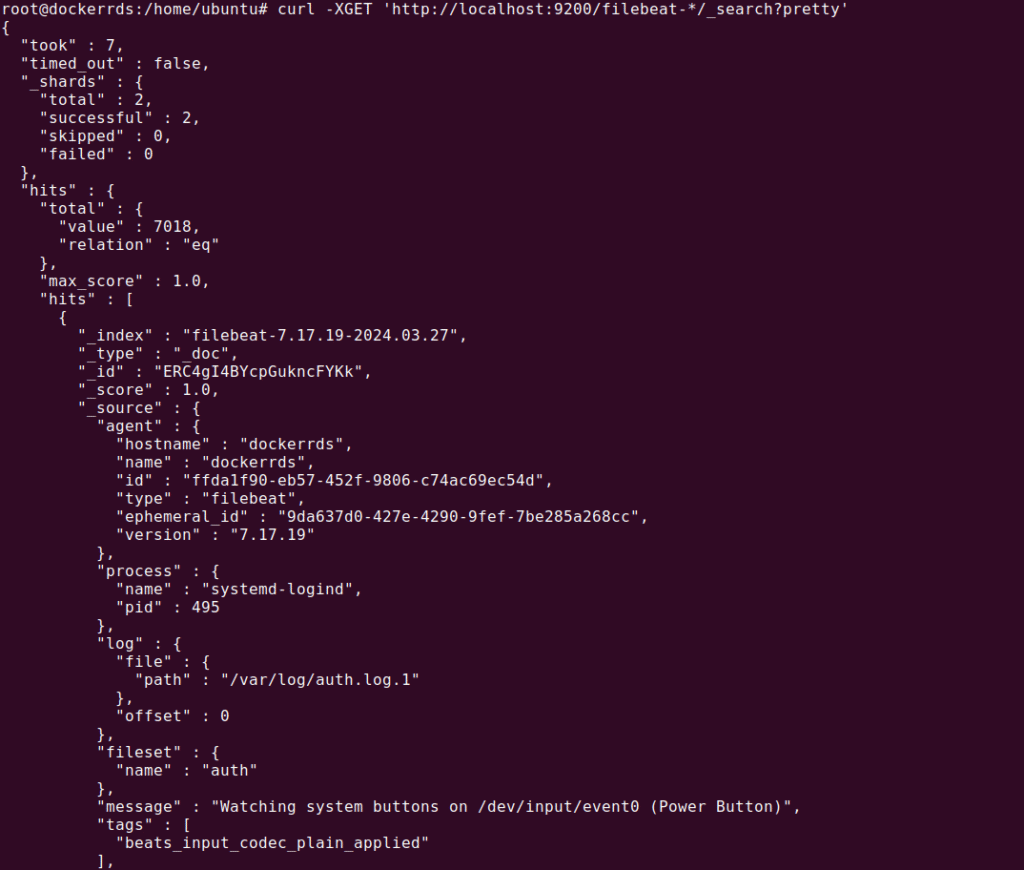
Use the following command to test filebeat:
curl -XGET ‘http://localhost:9200/filebeat-*/_search?pretty’
Step 5: Use the Kibana Dashboards
Accessing Kibana through your web browser, you can use the Discover feature to view and analyze log data in real time. Kibana also offers pre-built dashboards for visualizing Filebeat data, providing insights into system logs and user activities.
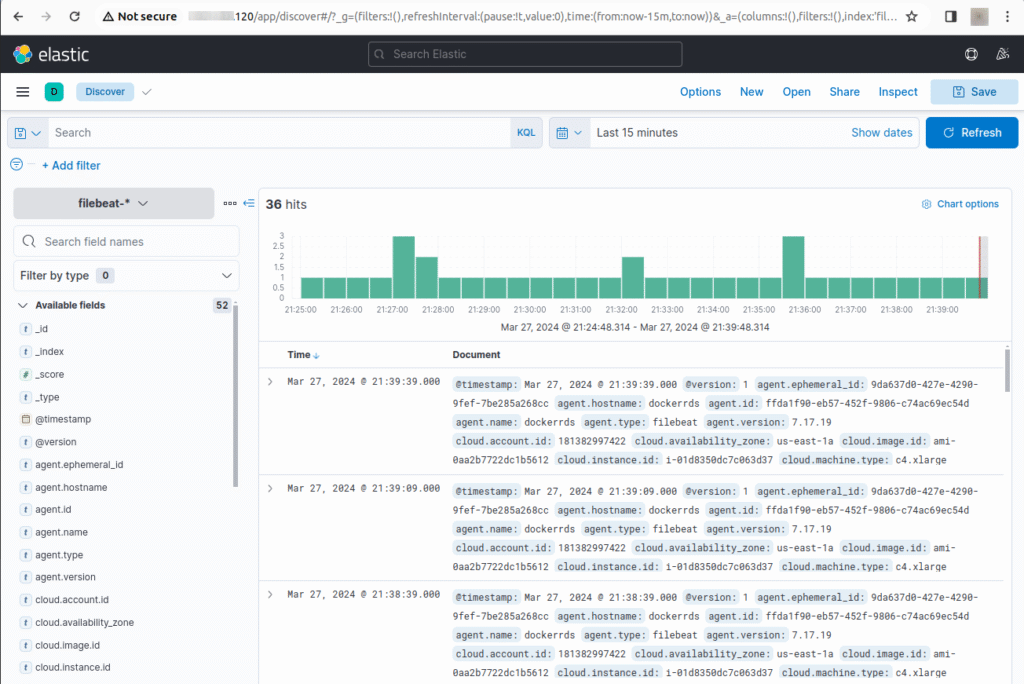
Through these dashboards, you can leverage Kibana’s capabilities for data analysis and visualization, helping you monitor and understand your digital environment.
Learn more in our detailed guide to ELK stack tutorial (coming soon)
Observability SaaS – Coralogix
Managing your own ELK stack might be costing you far more than your think with hidden infra costs, dedicated engineering resources and other overhead. If you are looking for a fully managed solution, Coralogix provides full-stack observability with out-of-the-box parsing rules, alerts and dashboards and of course fully customizable view and workflows. On top of this, Coralogix’s unique architecture is not reliant on expensive indexing or hot storage so you can observe all your data for far less cost.
Learn about one of our customers who successfully migrated off of their ELK stack to Coralogix.
See Additional Guides on Key Open Source Topics
Together with our content partners, we have authored in-depth guides on several other topics that can also be useful as you explore the world of open source.
OpenSearch
Authored by Coralogix
- OpenSearch: The Basics and a Quick Tutorial
- AWS OpenSearch Service: Quick Guide and Tutorial
- Opensearch Dashboards: The Basics and 2 Quick Tutorials
OpenTelemetry
Authored by Coralogix
- Quick Guide to OpenTelemetry: Concepts, Tutorial, and Best Practices
- OpenTelemetry Python: Basics, Quick Tutorial, and Best Practices
- OpenTelemetry Golang: The Basics and a Quick Tutorial
Apache Spark
Authored by Granulate