Java Debugging: Using Tracing To Debug Applications

Write enough programs, and you’ll agree that it’s impossible to write an exception-free program, at least in the first go. Java debugging is a major part of the coding process, and knowing how to debug your code efficiently can make or break your day. And in Java applications, understanding and leveraging stack traces can be the game-changer you need to ship your application quickly.

This article will cover how to debug in Java and how Java stack traces simplify it. Let’s start with what debugging is.

What is debugging in Java?

Debugging in Java is testing your code under different scenarios, edge cases, and fixing any errors you might encounter. Depending on the complexity of the program, debugging can range from relying on the compiler to catch simple syntax errors or using a variety of Java tools such as debuggers and breakpoints to find logical errors that are easily overlooked. 

One tool that significantly speeds up the Java debugging process is called a stack trace. Not only does it help you submit relatively clean code during development, but it’s also one of the primary tools to troubleshoot your code after deployment. 

What is a Java stack trace?

A Java stack trace is the long list of function calls printed on the programming terminal in case of any errors in the program. Let’s understand how it is generated.

Java programs use a call stack model for execution. Each call stack is made up of stack frames that store function calls. That means anytime you call a method, the call stack creates a stack frame that stores information such as variables, arguments, return address, etc. If a program cannot execute successfully, the compiler prints a copy of the active stack frames to the terminal. That’s the stack trace.

As a stack trace lists all your function calls before the program crashes, it lets you know where you should start looking for the error. This is vital because it has the potential to cut down your java debugging time in half since you’re no longer flying blind.

Java Stack Trace Example

Let’s take the example of a program that takes three numbers and divides the largest by one of the other numbers and returns the quotient. 

public class GreatestNumber {
    
    //method which returns the quotient
  public static int greater(int a, int b, int c) {
      int div;
      if (a>b && a>c)
      {
          div = a / b;
          return div;
          
      }
      else if (b>c && b>a)
      {
          div = b / c;
          return div;
      }
      else
      {
          div = c/a;
          return c;
      }
  }
  
  
 //main method
  public static void main(String[] args) {
      int m;
      m = greater (0, 3, 10);
      System.out.println (m); 
  }
}

This program would work perfectly when all numbers are non-zero integers. However, since we have set the input for “a” as zero, the program triggers an Arithmetic exception.

Here’s the stack trace:

Exception in thread "main" java. lang.ArithmeticException: / by zero           
at GreatestNumber.greater(GreatestNumber.java:18)                              
at GreatestNumber.main(GreatestNumber.java:27)

How to read a Java stack trace

Sometimes, the sheer number of lines in a stack trace might feel intimidating. However, a big stack trace can also contain useful information that can help you debug faster. This section will help you understand the strategy to read even the most nested exceptions.

Let’s break down the example from earlier:

Exception in thread "main" java.lang.ArithmeticException: / by zero 

In the first line, the program tells us that the exception has occurred in the “main” thread, which is useful when there are multiple threads in your application. The next word tells us the type of Exception that has occurred — in this case, an ArithmeticException. Typically, every Exception will have associated documentation or “Javadocs” which you can refer to troubleshoot that error. 

The rest of the stack trace tells us where the exception occurred exactly. Traces are printed in a “last in, first out” manner. That means the last function called when the exception occurred will be printed first. Here, since the Arithmetic exception occurred while the program’s control was passed to the “greater” function, we can see that function call in the stack trace along with the line number. Now, where was this called from? It’s printed on the next line — the “main” method.

GreatestNumber.greater(GreatestNumber.java:18)at 
GreatestNumber.main(GreatestNumber.java:27)

Using this logic, you can decode even nested exceptions like these:

Exception in thread "main" java.lang.IllegalStateException: A phone has a null property
        at com.test.project.Phone.getModelNumber(Phone.java:28)
        at com.test.project.Bootstrap.main(Bootstrap.java:4)
Caused by: java.lang.NullPointerException
        at com.test.project.Phone.getModelNumber(Phone.java:12)
        at com.test.project.Manufacturer.getPhoneModel(Manufacturer.java:15)
        ... 1 more,

In this case, you want to traverse the “Caused by” sections until you find the section that might be the root cause of the error. Once you’re sure of that, you can follow the “at” trail to determine the exact line that needs fixing.

With this exception, the root cause is the “NullPointerException.” Thus, you should look at line 12 of Phone.java to figure out why the function returns a null value.

Handling exceptions in Java

Exception handling ensures that your application will still work even if one function doesn’t. You want your application to maintain (or at least attempt) a normal execution flow until you can fix the exceptions. A simple try-catch block or a try-catch-finally block usually does the job.

This is how it would look in our previous example if we include a try-catch block to address the ArithmeticException:

public static void main(String[] args) {
      int m;
      try {
          m = greater (0, 3, 10);
          System.out.println (m); 
      } catch(ArithmeticException e) {
        System.out.println("Division by zero is not allowed:"+ e.getMessage());
        e.printStackTrace();
      }
}

And the corresponding trace would be:

Division by zero is not allowed - Error message: / by zero
java.lang.ArithmeticException: / by zero
at GreatestNumber.greater(GreatestNumber.java:18)
	at GreatestNumber.main(GreatestNumber.java:28)

As you can see, the custom message makes it much clearer for users. They do not have to understand what an Arithmetic Exception is – only that zero is not allowed as an input parameter. Additionally, it provides more context to the stack trace, which is helpful when it is too long.

Exception Handling & Third-Party Libraries

Exception handling is essential when calling third-party code libraries. Since well-known Java code libraries are extensively tested based on secure code practices, exceptions typically occur due to internal code.

For instance, say, we’re trying to write to a file by using the IO library provided by Java. If the file does not have the associated permission, the library will throw an AccessControl exception that looks something like this:

java.security.AccessControlException: access denied 
("java.io.FilePermission" "test.txt" "read")
    at java.base/java.security.AccessControlContext.checkPermission(AccessControlContext.java:472)
    at java.base/java.security.AccessController.checkPermission(AccessController.java:897)
    at java.base/java.lang.SecurityManager.checkPermission(SecurityManager.java:322)
    at java.base/java.lang.SecurityManager.checkRead(SecurityManager.java:883)
    at 
java.base/java.io.FileInputStream.<init>(FileInputStream.java:225)
    at 
java.base/java.io.FileInputStream.<init>(FileInputStream.java:187)
    at java.base/java.io.FileReader.<init>(FileReader.java:96)
    at test.main(File.java:19)

In this example, the stack trace prints all the function calls inside three Java libraries — security, lang, and IO. This makes the stack trace confusing because the problematic code is not due to the library but instead due to how you use it. Thus, making sense of the stack trace in the Java debugging process and identifying references to the code or package you used becomes difficult. 

Instead, if you incorporate a try-catch block in your code, the stack trace would directly start from your code without traversing the internal third-party libraries. That’ll make the trace more readable and easier to handle.

Now that you understand how to read a stack trace and handle exceptions, let’s talk about managing them during Java debugging effectively.

Java tracing and writing them to logs

In distributed or complex applications, the number of function calls is massive. As you can imagine, errors cause lengthy stack traces, which can be hard to keep track of. This is even more problematic in large production-level events where multiple applications depend on each other. The solution is to write traces to logs and use a log management platform to manage them.

Some log management platforms, such as Coralogix, offer features such as log clustering, auto-parsing, and proactive anomaly detection. These features help you constantly monitor the health of your application and detect errors even before they occur. 

Investigating errors with Java debugger

Sometimes, finding errors is not as simple as a NullPointerException or an ArithmeticException. Nuances in the code can cause logical errors that can give incorrect outputs. 

In cases such as these, printing a stack trace using a Thread.dumpStack() is a good way to point your efforts in the right direction. You can choose strategic breakpoints based on the information provided by the trace and then go through the code line by line with a debugger.

With debuggers, you can halt the program’s execution, figure out the state of the variables and understand the program flow easily. Typically, Java IDEs like Eclipse have built-in debuggers that you use to carry out this activity.

The Ultimate Java Debugging Tools: Stack Traces & Log Management

Deploying code to production can sometimes be nerve-wracking. The actual problem starts when the code you deployed breaks already working applications. Since you don’t have the luxury of using debuggers in production, the only thing that can help you is a java stack trace and accessing those details to log files. Those log files make pinpointing the issue much easier and save you big escalations and headaches. You can also set up log monitoring platforms like Coralogix to constantly analyze your logs and set up alerts whenever an exception occurs.

Best Practices for Writing Secure Java Code

Every Java developer should follow coding standards and best practices to develop secure Java code. It is critical your code is not vulnerable to exploits or malicious attacks. In recent times, even big organizations like eBay, the CIA, and the IRS have fallen victim to vulnerabilities in their applications that have been discovered and exploited by attackers. 

The following guidelines provide a solid foundation for writing secure Java code and applications. These will minimize the possibility of creating security vulnerabilities caused by Java developers and help prevent known malicious attacks. 

1. Only Use Tried and Tested Libraries 

A large percentage of the code in applications is sourced from public libraries and frameworks. These libraries can contain vulnerabilities that may allow a malicious attacker to exploit your application. 

Organizations trust their business and reputation to the libraries they use, so make sure you only use proven ones and keep them up to date with the latest versions. Consider checking if they have any known vulnerabilities or require any security fixes.

2. Avoid Serialization

Java serialization is inherently insecure which is why Oracle recently announced it has a long-term plan to remove it. Serialization vulnerabilities were recently found in Cisco and Jenkins applications. 

Any application that accepts serialized Java objects is vulnerable, even if a library or framework is responsible and not your own Java code. One area to watch out for is making an interface serializable without thinking through what could be exposed. Another pitfall to avoid is accidentally making a security-sensitive class serializable, either by subclassing or implementing a serializable interface.

3. Always Hash User Passwords

Never store any passwords as plain text. Always hash user passwords preferably using a salted hash and a recommended hashing algorithm like SHA-2. When a password has been ‘hashed’, it has been turned into a scrambled version of itself. Using a predefined key known to the application, the hash value is derived from a combination of both the password and the key using a hashing algorithm.

4. Filter Sensitive Information From Exceptions

Exception objects can contain sensitive information that can assist an attacker hoping to exploit your system. An attacker can manufacture input arguments to expose internal structures and mechanisms of the application. It’s important to remember that information can be leaked from the exception message text and the type of an exception.

Take for example the FileNotFoundException message. These messages contain information about the layout of the file system and the exception type reveals the missing requested file. 

To secure Java code applications, you should filter both exception messages and exception type.

5. Do Not Log Sensitive Information

Data thefts cause massive harm to individuals and organizations, and developers need to do everything possible to prevent them from happening. Information like credit and debit card numbers, bank account numbers, passport numbers, and passwords are highly sensitive and valuable to criminals. Don’t store this type of information in log files and make sure it’s not detectable through searches in cleartext. 

If you have to log any sensitive information like card numbers, for example, think about logging only part of the card number e.g. the last four digits, and make sure it’s encrypted using a proven library. Don’t write your own encryption functionality. 

6. Error Handling and Logging 

You can accidentally reveal sensitive information in user error messages and error messages recorded in the log files, such as account information or system details. 

A safer way is to use generic screen error messages for users. Additionally, write log error messages that will help support teams investigating production issues without providing an attacker with useful information to further exploit your systems.

7. Write Simple Java Code

Generally speaking, simple java code is secure java code. Here are some tips on keeping your code simple and secure:

  • Keep it as simple as possible without reducing functionality. 
  • Use code quality checking products like SonarQube. This tool will continuously inspect the code quality whilst checking for any new vulnerabilities in your latest code release. Once a bug or vulnerability is in production, it is a lot harder to fix it compared to the effort to prevent it in the first place. 
  • Expose the minimum amount of information in your code. Hiding implementation details is good for keeping your code both secure and maintainable. 
  • Make good use of Java’s access modifiers. Declare the most restrictive access levels for classes, methods, and their attributes possible. Set everything that can be set to private, as private. 
  • Always define the smallest possible API and interface objects. Decouple components and make them interact in the smallest scope possible. If one component of your application is compromised by a breach, the others will be safe.

8. Prevent Injection Attacks

An injection attack occurs when malicious code is injected into the network. This type of attack is considered a major problem in web application security and is listed as the number one security risk in the OWASP Top 10. Any application that allows users to enter or upload data might contain a vulnerability that can allow an injection attack. Insufficient user input validation is usually the primary reason injection vulnerabilities exist. 

SQL Injection 

SQL Injection vulnerabilities are created when developers write dynamic database queries that can include user input. An attacker can include SQL commands in the input data, in any screen input field. Then because of a vulnerability in the code, the application runs the rogue SQL in the database. This gives attackers a way to bypass the application’s authentication functionality and allow them to retrieve the contents of an entire database. 

Key things to remember to prevent SQL injections: 

  • Never build SQL statements by concatenating arguments. This allows a high probability of SQL injection attacks.
  • Avoid dynamic SQL. Use Prepared Statements (with parameterized queries). 
  • Use stored procedures. 
  • Whitelist input validation. 
  • Escape user-supplied input. 

XPath Injection 

XPath injections are similar to SQL injections in that they can attack websites that operate on user-supplied information to construct an XPath query for XML data. An attacker can gain detailed information on how the XML data is structured or access data that is not normally accessible by sending malicious information to the website. 

These vulnerabilities can also elevate the attacker’s privileges in the application if the XML data is being used for authentication. 

You can avoid XPath injection by similar techniques used to prevent SQL injection: 

  • Sanitize all user input. 
  • When sanitizing, verify the data type, format, length, and content. 
  • In client-server applications, perform validation at both the client and the server sides.
  • Thoroughly test applications especially user input. 

Cross-Site Scripting 

Cross-Site Scripting (XSS) attacks happen when an attacker uses a web application to send malicious code (usually a browser-side script) to other users. Vulnerabilities that allow these attacks can occur anywhere a web application receives input from a user, within the output it generates, without validating or encoding it. 

To keep Java code applications secure and prevent XSS, filter your inputs with a whitelist of allowed characters and use a proven library to HTML encode your output for HTML contexts. For JavaScript use JavaScript Unicode escapes. 

Summary 

In summation, there are some key points to bear in mind in writing secure Java code. You should always think about security in the development of your application in the design stage and code reviews, as well as look for vulnerabilities in your Java code and take advantage of the Java security APIs and libraries.

Only ever use highly rated vendor tools to monitor and log your code for security issues. This means you should investigate the full list of application attack types and follow the recommended prevention methods.

If you use these guidelines for writing secure Java code applications in your organization, you can protect yourself and your applications against malicious attacks and data theft.

CI/CD Tutorial: How to deploy an AWS Jenkins Pipeline

In the previous article, we have created the Continuous Integration (CI) pipeline for a simple Java application. It is now time to start working on the Continuous Deployment (CD) pipeline that will take the Java application and deploy it to AWS. To build the CD pipeline, we will extend the existing AWS Jenkins pipeline. If you have missed the previous article on building Cotinuous Integration solutions for a Java application using Jenkins, make sure you read that first before continuing. 

Quick introduction to AWS

Amazon Web Services or simply AWS is a cloud platform offering over 170 cloud-based services available in data centers located worldwide. Such services include virtual servers, managed databases, file storage, machine learning, and many others.

While AWS is the most popular cloud platform, many other providers, including Google Cloud, Microsoft Azure, or DigitalOcean share similar concepts and services to the ones presented here.

In case you don’t already have an AWS account, head over to https://aws.amazon.com/, and create one. You will have 12-months free-tier access, but you still need to enter your billing information and credit card number just in case you go over the free limits. 

As a general recommendation, terminate any services once you don’t use them anymore before costs start adding up. 

Once you have successfully signed up, you can open the AWS Management console available at https://console.aws.amazon.com/. The console will give you an overview of all the services that AWS has to offer.

AWS Jenkins Pipeline to deploy a Java application

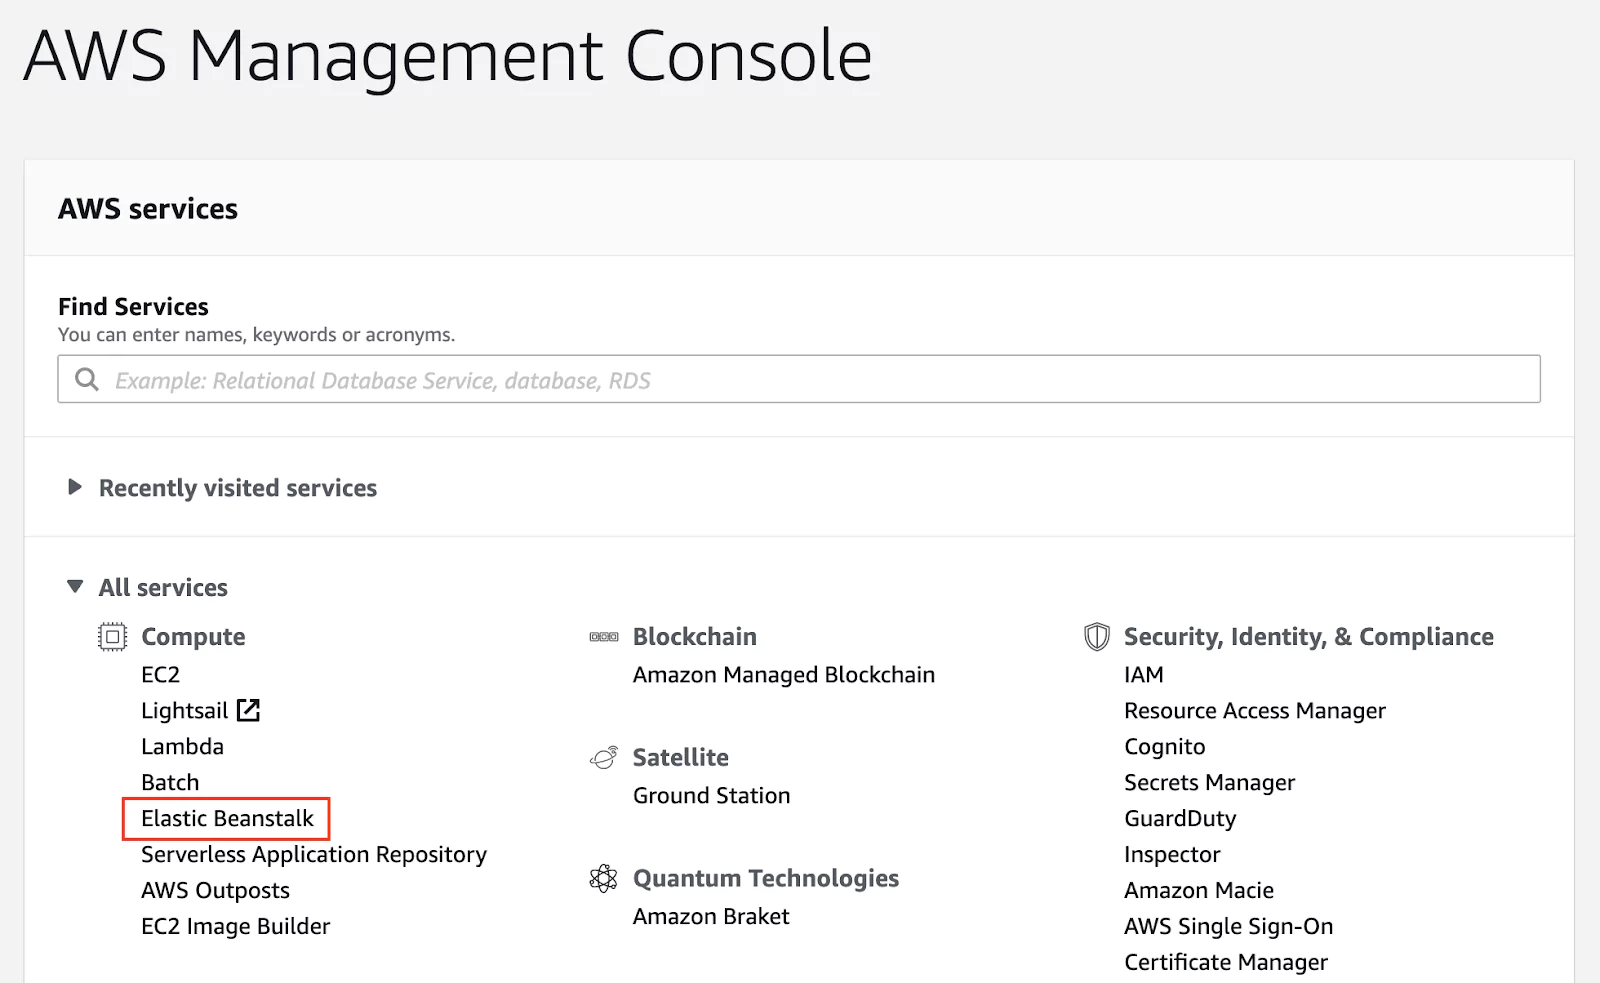
One of the easiest ways to deploy an application to the AWS infrastructure without getting into many technical aspects is using a service called Elastic Beanstalk (EB). From the console overview page, locate the Elastic Beanstalk service.

(01-aws-console.png)

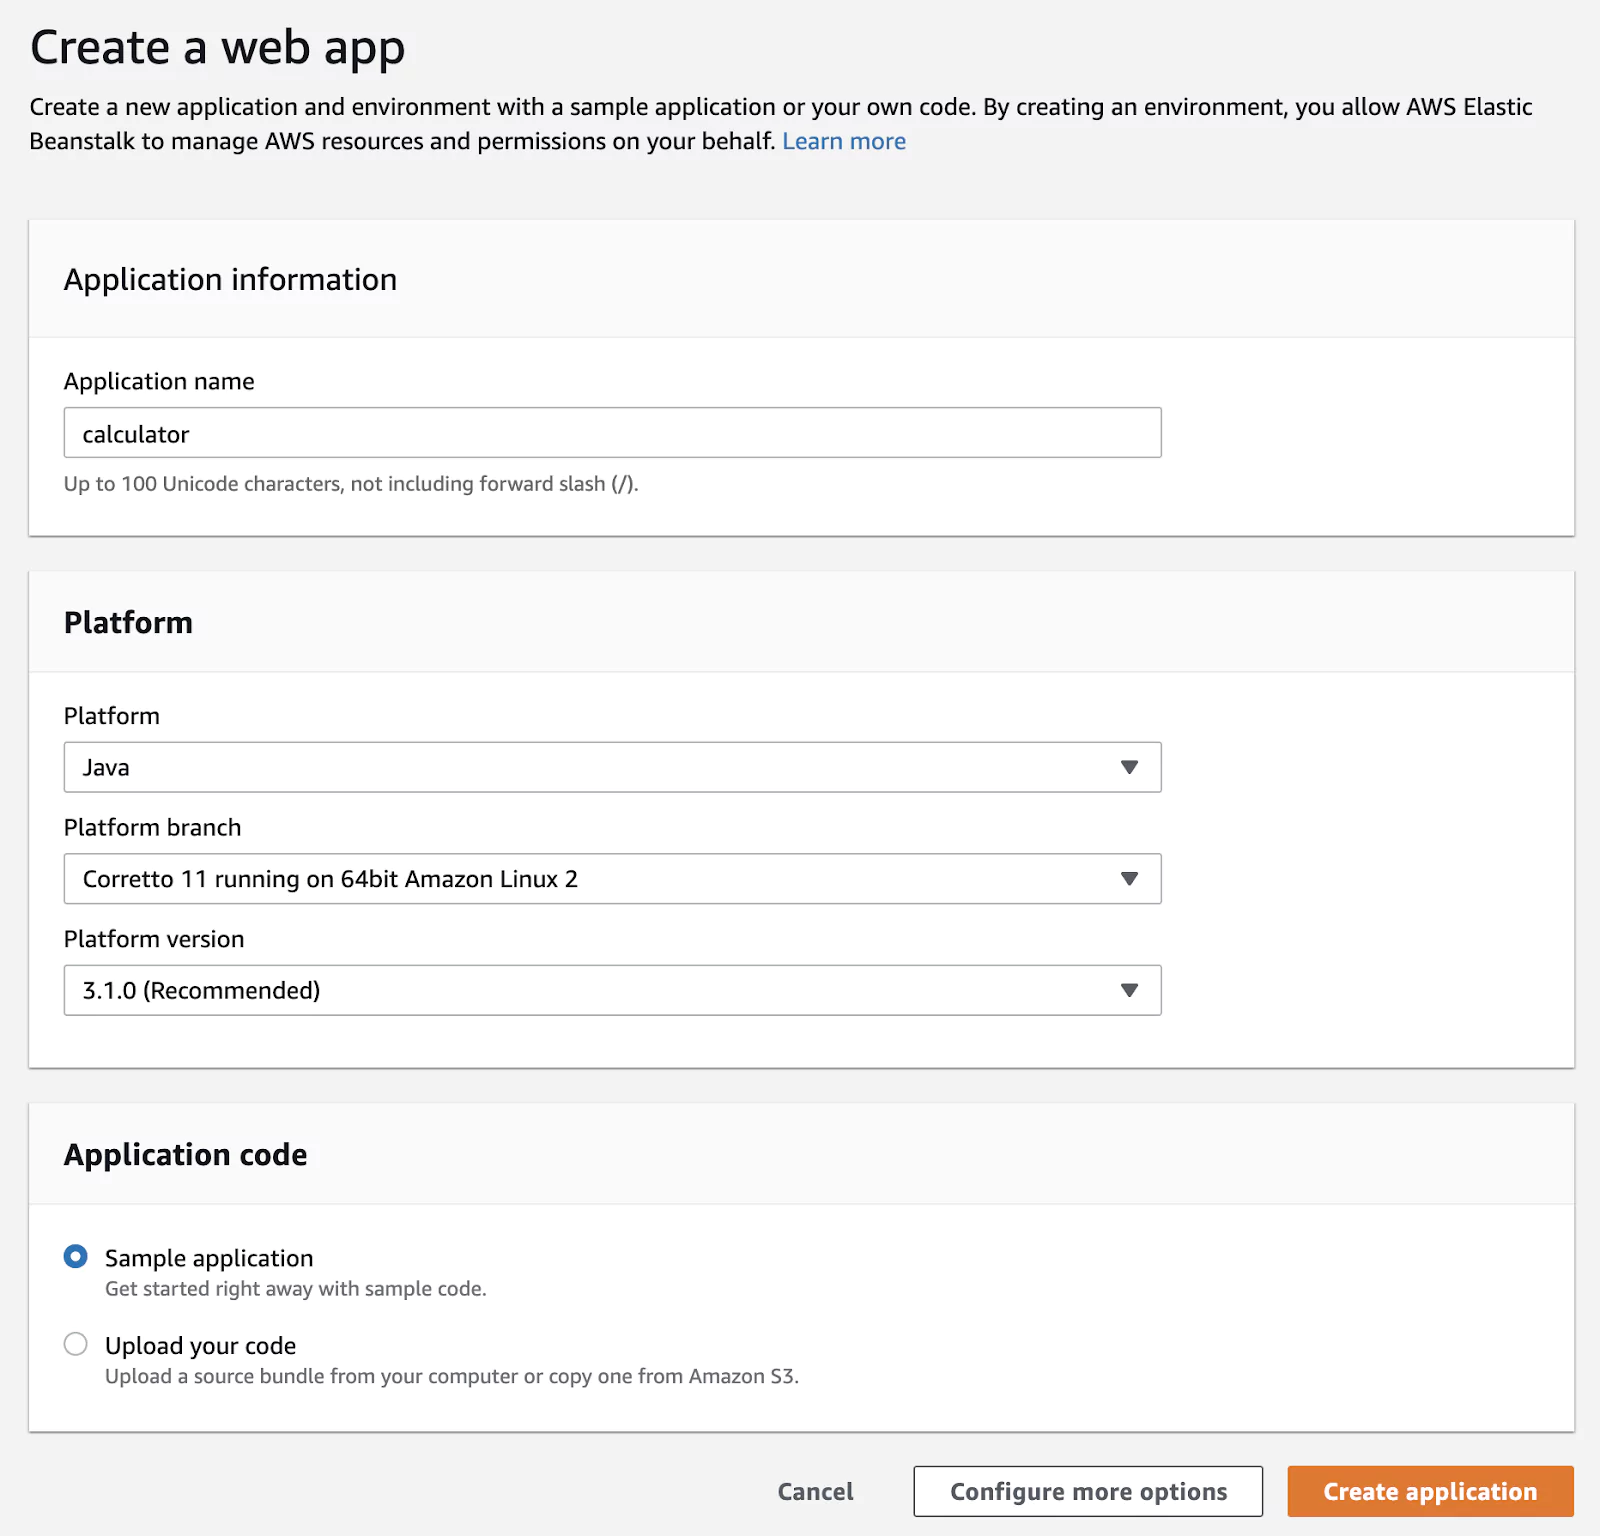
The next step is to create a new application. 

(02-eb-create-application.png)

I have named the application calculator, but you are free to call the application as you wish. Since we are trying to deploy a Java application, we need to select the Java platform. Leave the rest of the platform fields to their default values.

(03-eb-new-app-config.png)

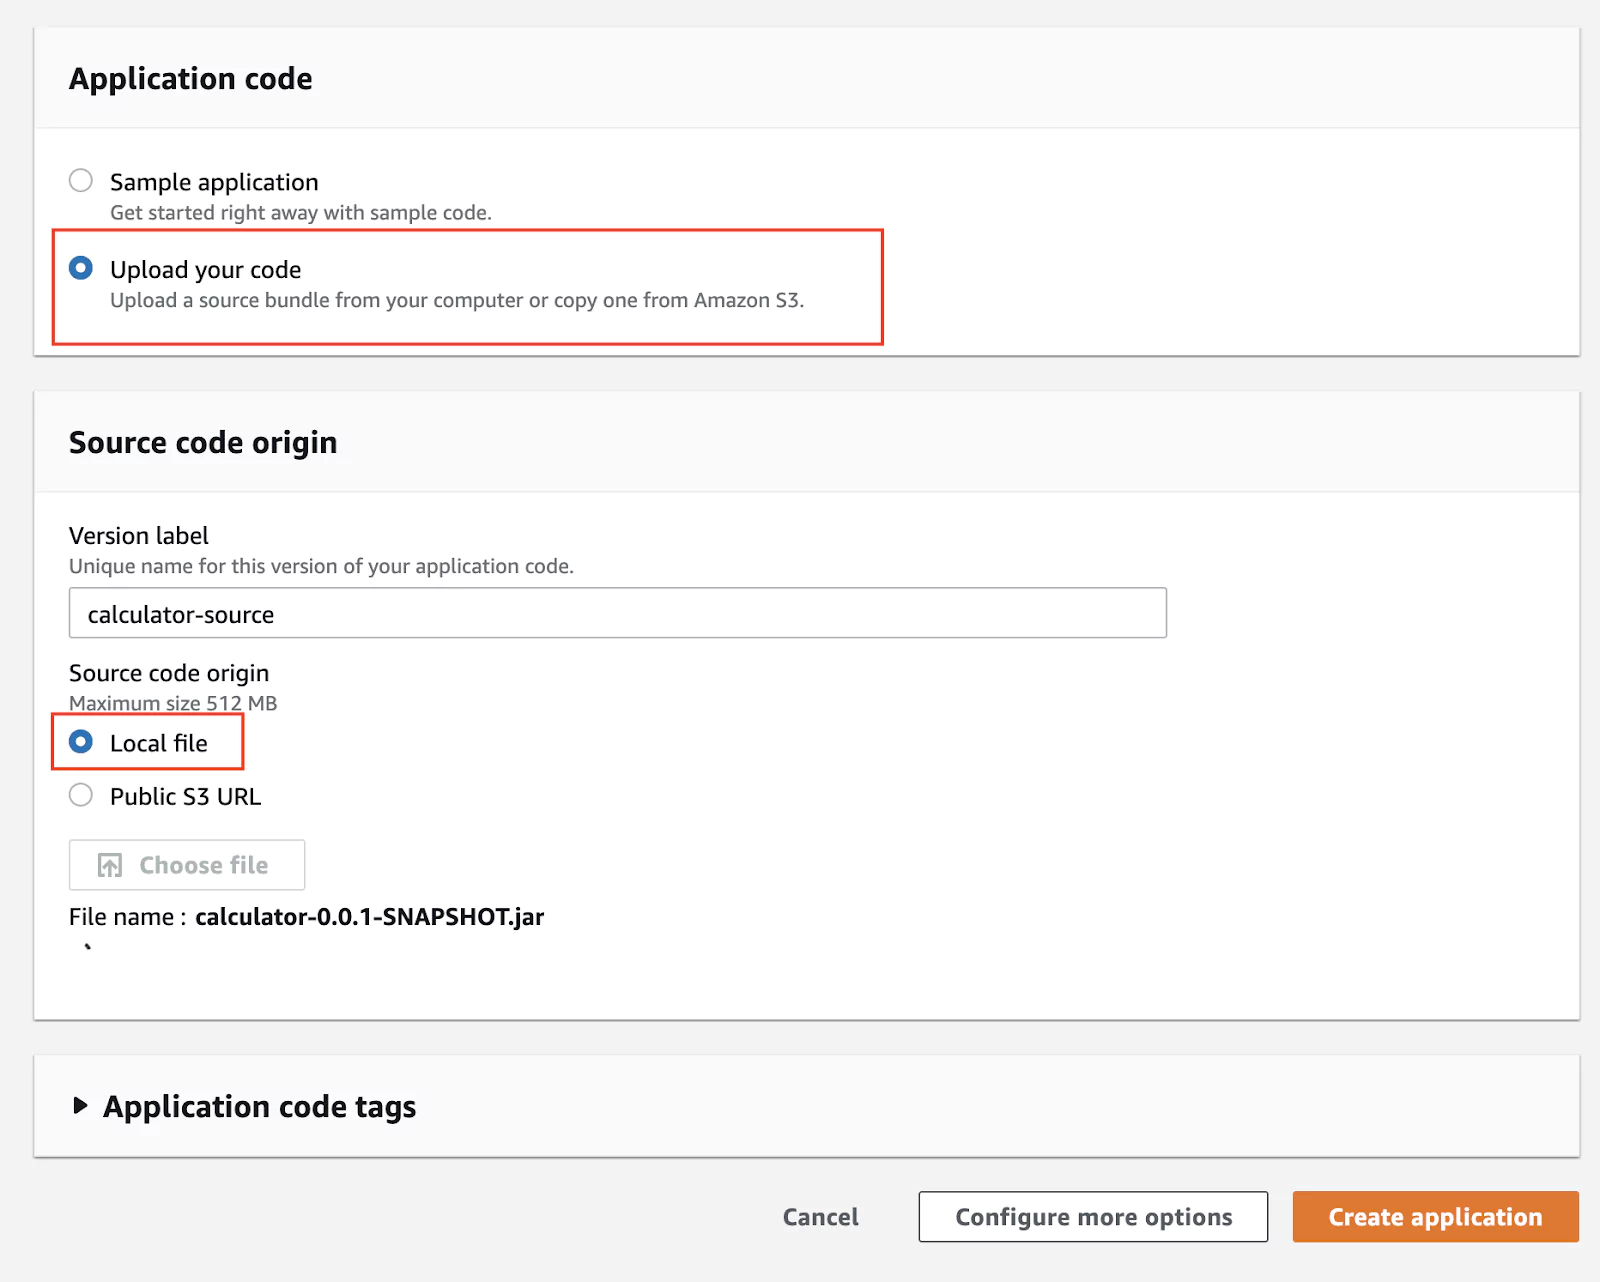
You can start the application with a sample code application, just to see that it is running. Since we already have a packaged Java application in the form of a jar file, we can directly use that.

(04-eb-upload-code.png)

Wait for the file upload to complete. Finally, click on Create application. This may take a few minutes to start. 

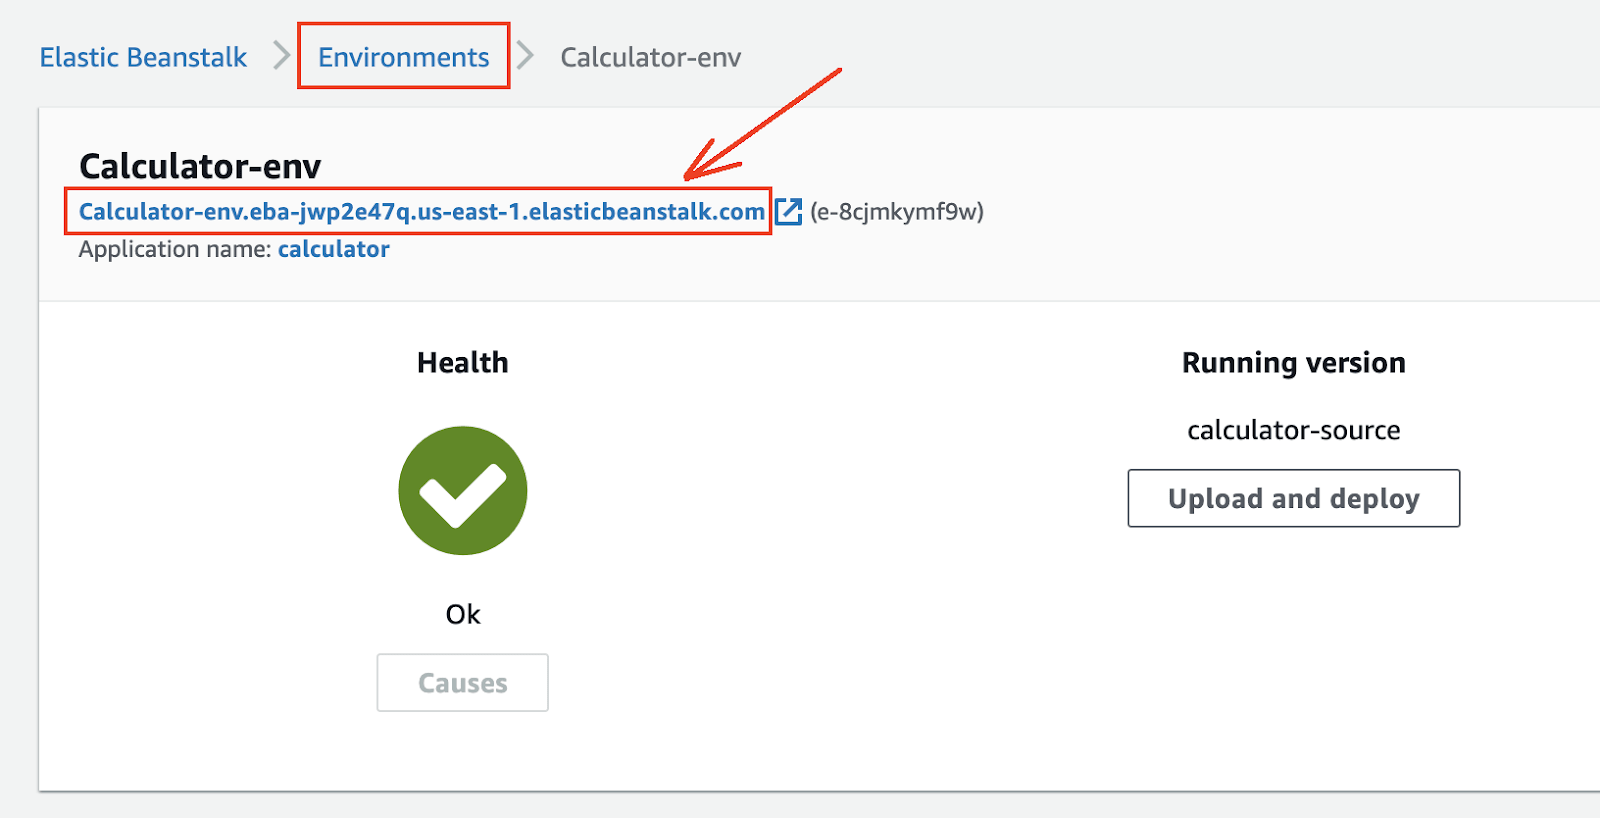
Now click on Environments, select the only environment being displayed, and right on top, you should see the public URL under which the application is available. 

(05-eb-environments.png)

If you click on the link displayed, you will get a 404 Not found status code, and that is expected. If you get a different status code, please check the Troubleshooting section within this article. Add /add?a=1&b=2 to the address, and you should see the response.

(06-eb-app.png)

Congratulations! You have just deployed a Java application to AWS with only a few clicks. 

How to deploy to AWS from Jenkins

So far, the process has been manual, but it has ensured that our application works on the AWS infrastructure. Since we want to automate this process, we need to use the terminal to do the steps that we did manually. 

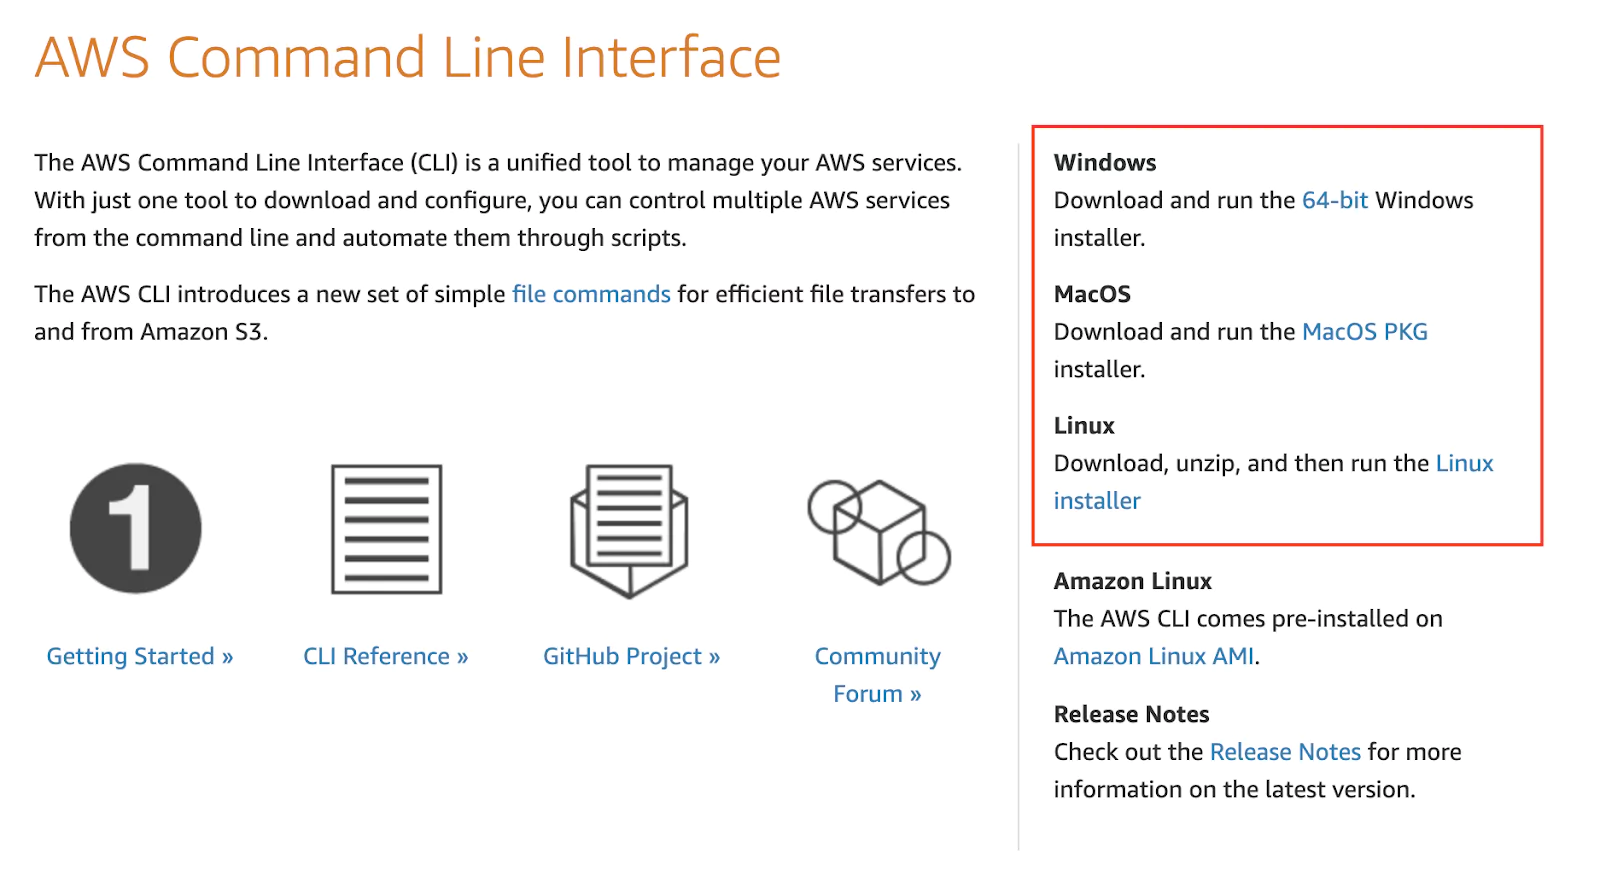
Fortunately, AWS provides the tools needed to automate this process. The main tool that will allow us to interact with AWS is the AWS CLI, a software tool that has no graphical interface. 

The deploy the Java application to AWS from Jenkins, there are a series of steps we need to follow: 

  1. Upload the jar archive to AWS S3 (S3 is like Dropbox for the cloud and the main entry point to the AWS infrastructure when dealing with files).
  2. Create a new version of the application within EB by providing the jar achieve, which is now inside S3.
  3. Update the EB environment with the latest application version.

You can easily download and install AWS from https://aws.amazon.com/cli/ . You will find installers for Windows, macOS, and Linux.

(07-aws-cli.png)

After the installation has completed successfully, open any terminal window and run the command aws –version. This will confirm that the installation has been successful and will display the AWS CLI version.

(08-aws-cli-locally.png)

If you have Jenkins installed on macOS, to get AWS CLI to work in Jenkins, you may need to create or adapt the PATH variable with the value: /usr/local/bin:$PATH

How to upload a file to AWS S3 from Jenkins

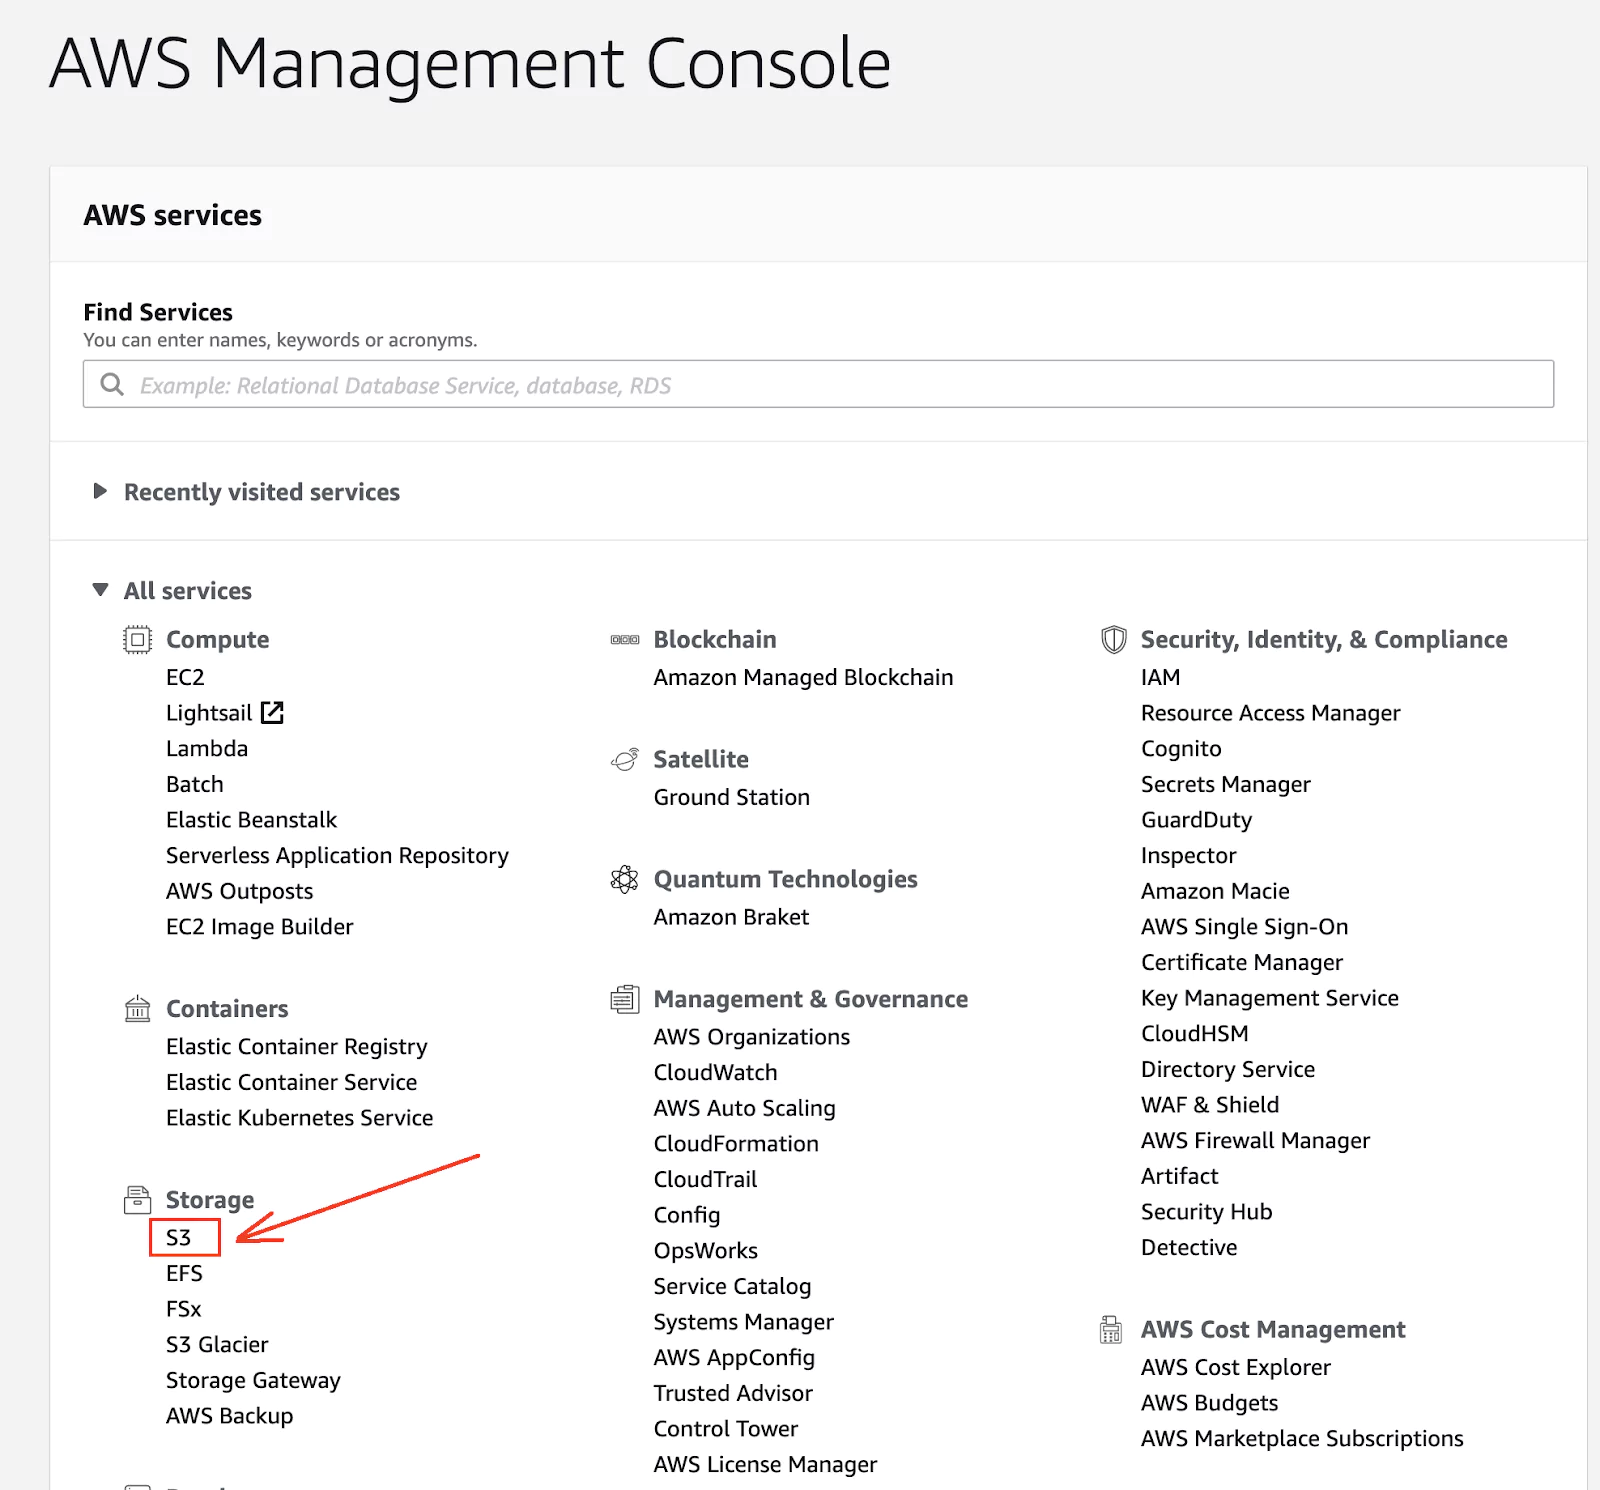
S3 stands for Simple Storage Service and is the gateway to the AWS infrastructure when working with files. You can see it like Dropbox but for the AWS infrastructure. Let’s go back to the AWS Management Console and select the S3 service.

(09-aws-s3.png)

In S3, files are organized in buckets, which are containers for storing data. Inside buckets, you can store files and folders, just as you would do on your computer. 

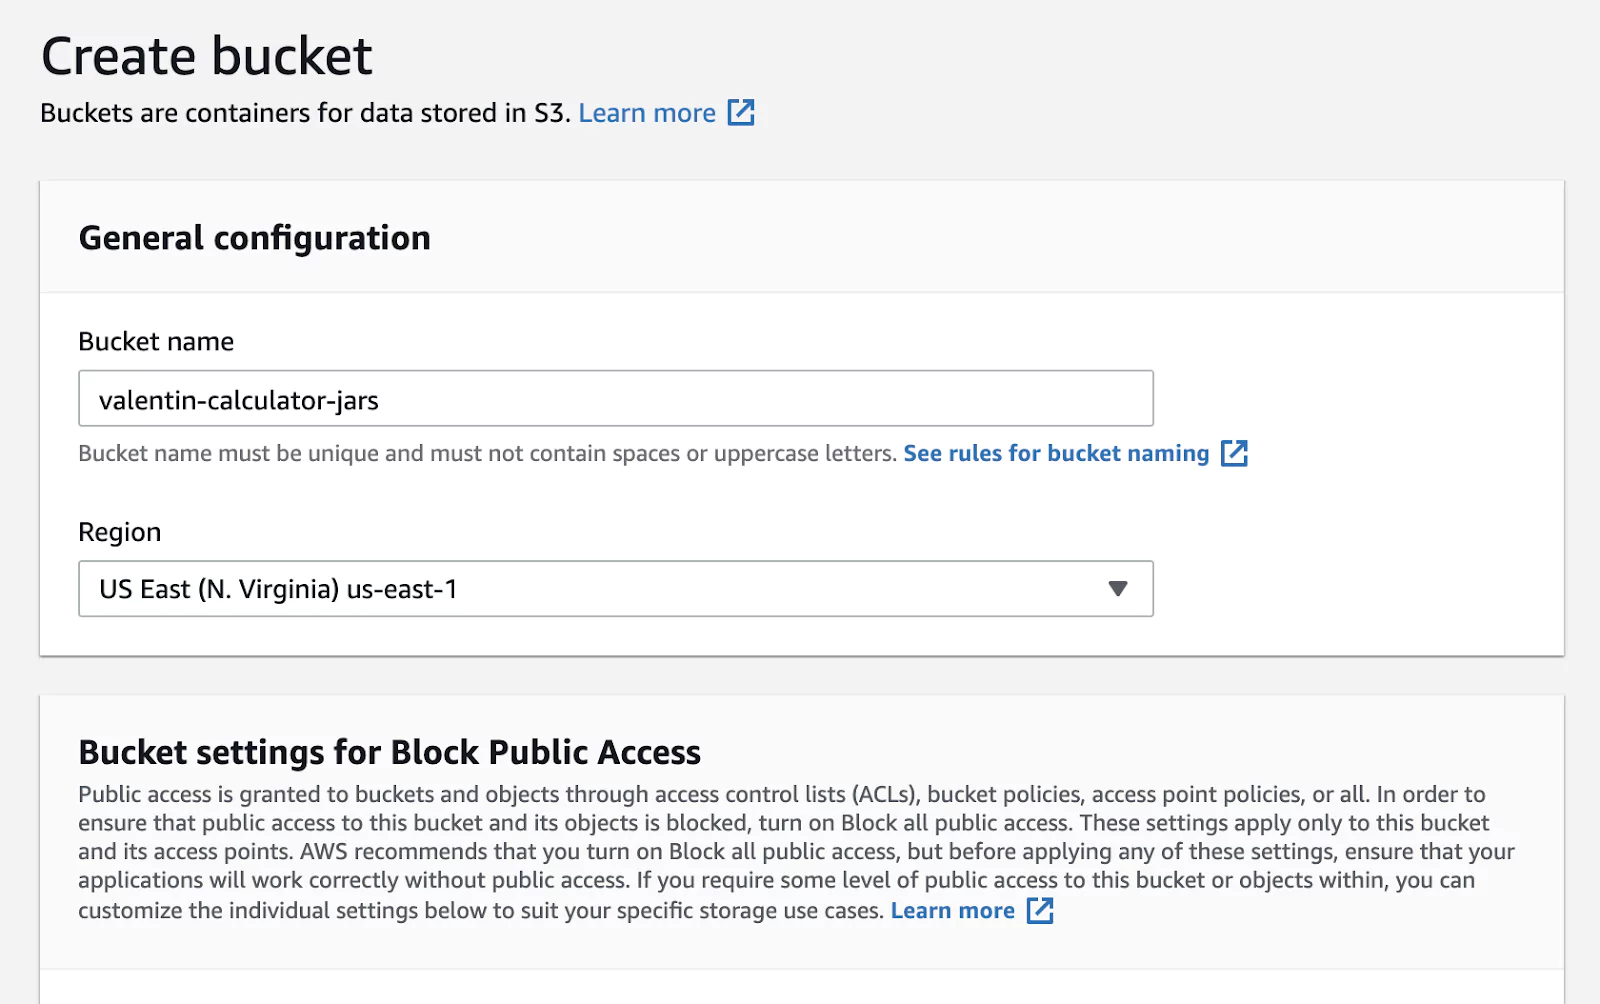
Let’s continue by creating a bucket for storing our jar archives. Your bucket name needs to be unique, and you may face conflicts if you decide to use common names. I choose to prefix the bucket with my name to avoid naming conflicts.

(10-create-s3-bucket.png)

At this point, all you need to do is remember the name of the bucket and the region in which the bucket has been created (in the screenshot above, the region is us-east-1).

To interact with any AWS service from the CLI, we cannot use our AWS account’s username and password. Not only would this be highly risky, but in many cases also impractical. We will create a special user that will only have access to the services required to perform the tasks needed.

For this reason, from the AWS Management console, identify the block Security, Identity, & Compliance and select the IAM service (Identity and Access Management). 

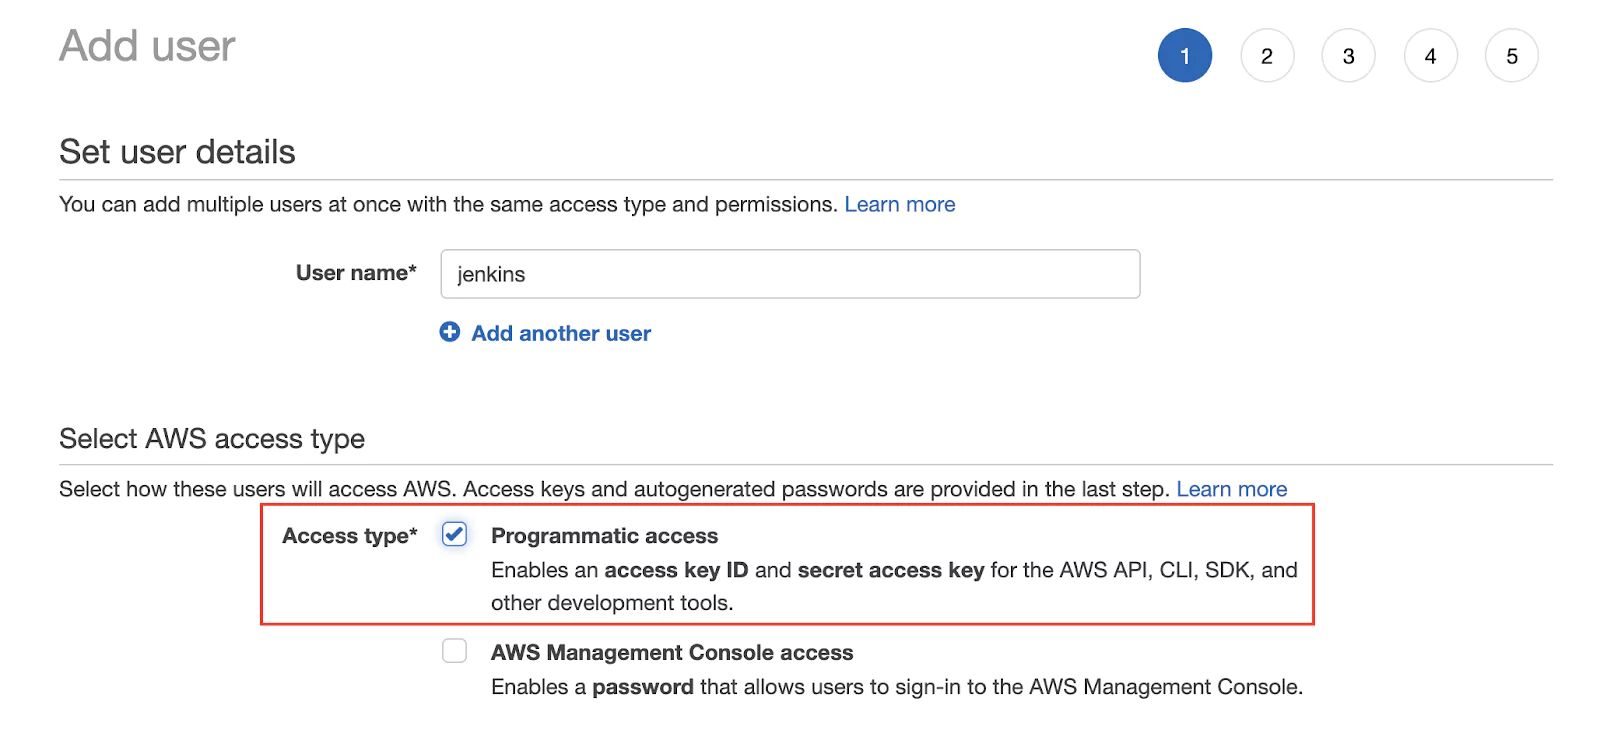
Click on Users > Add user. I will call this user jenkins, so that I can quickly identify it. Make sure to enable the Programmatic access to use this user from the AWS CLI. 

(11-iam-user.png)

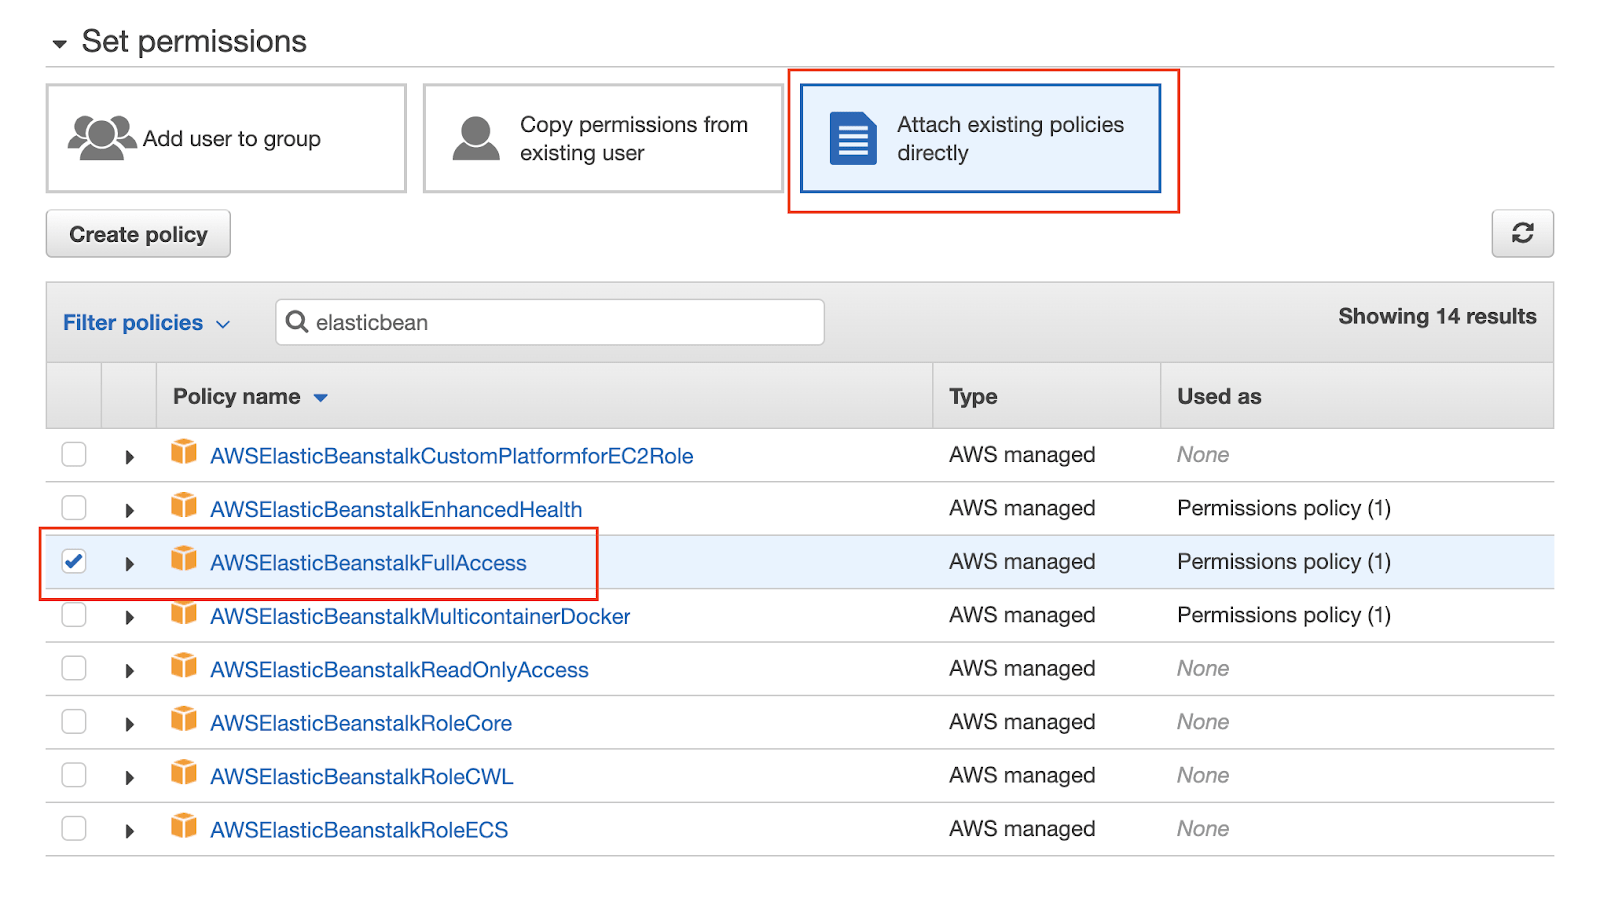
The next step will handle the Permissions that the user will have. We will use some predefined rules to get started. Select Attach existing policies directly. Using the search field, you can search for permissions, which often include the service name. Make sure that the user has the following permissions: AWSElasticBeanstalkFullAccess, AmazonS3FullAccess.

(12-iam-policies.png)

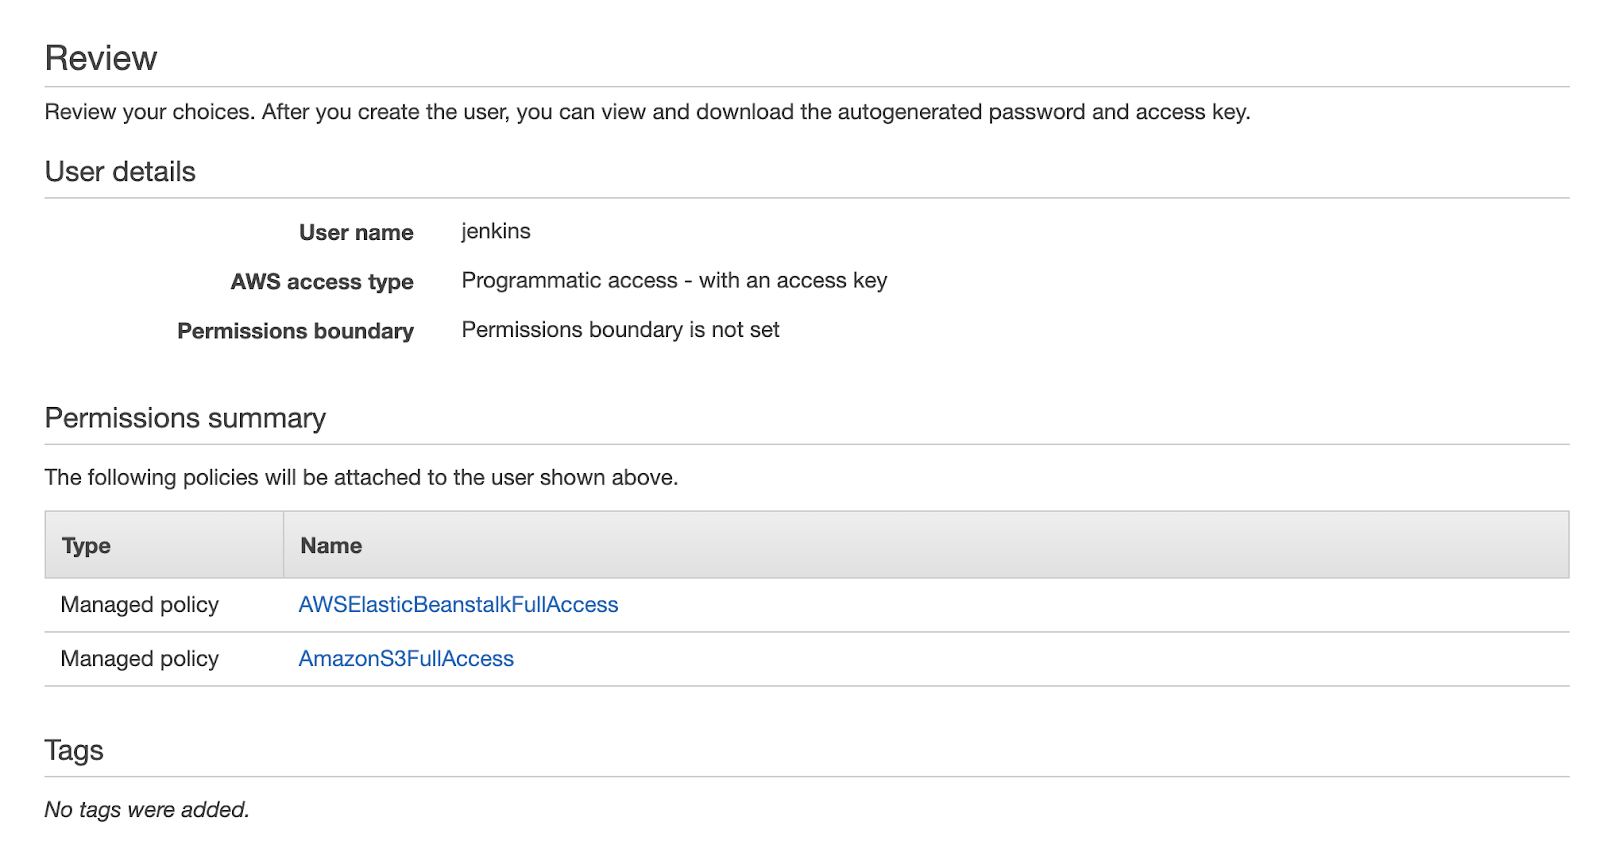
You can skip the Tags page, and on the Review page, your configuration should look very similar to the screenshot below. 

(13-iam-review.png)

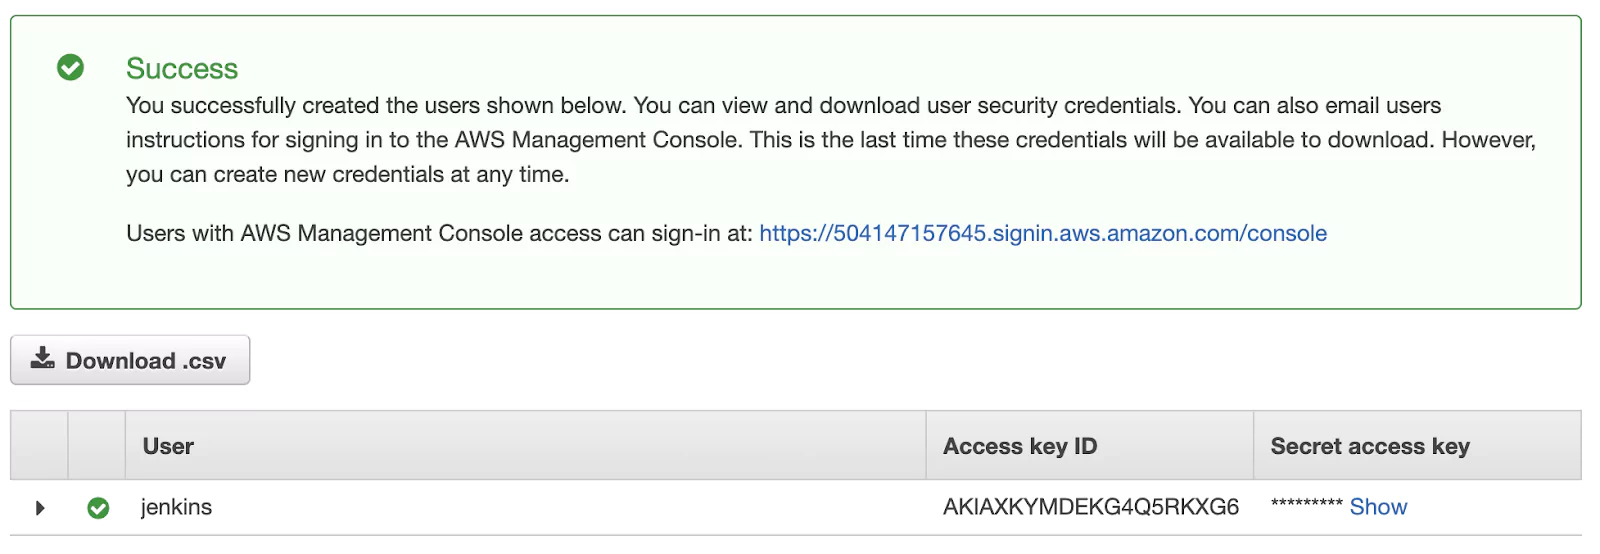
If everything looks right, go ahead and create the user. The final page will display the credentials that have been generated.

(14-iam-user-credentials.png)

Make sure that you store these credentials somewhere safe or keep this page open for a while. They won’t be displayed again. In case you lose them, delete the user and repeat the same process.

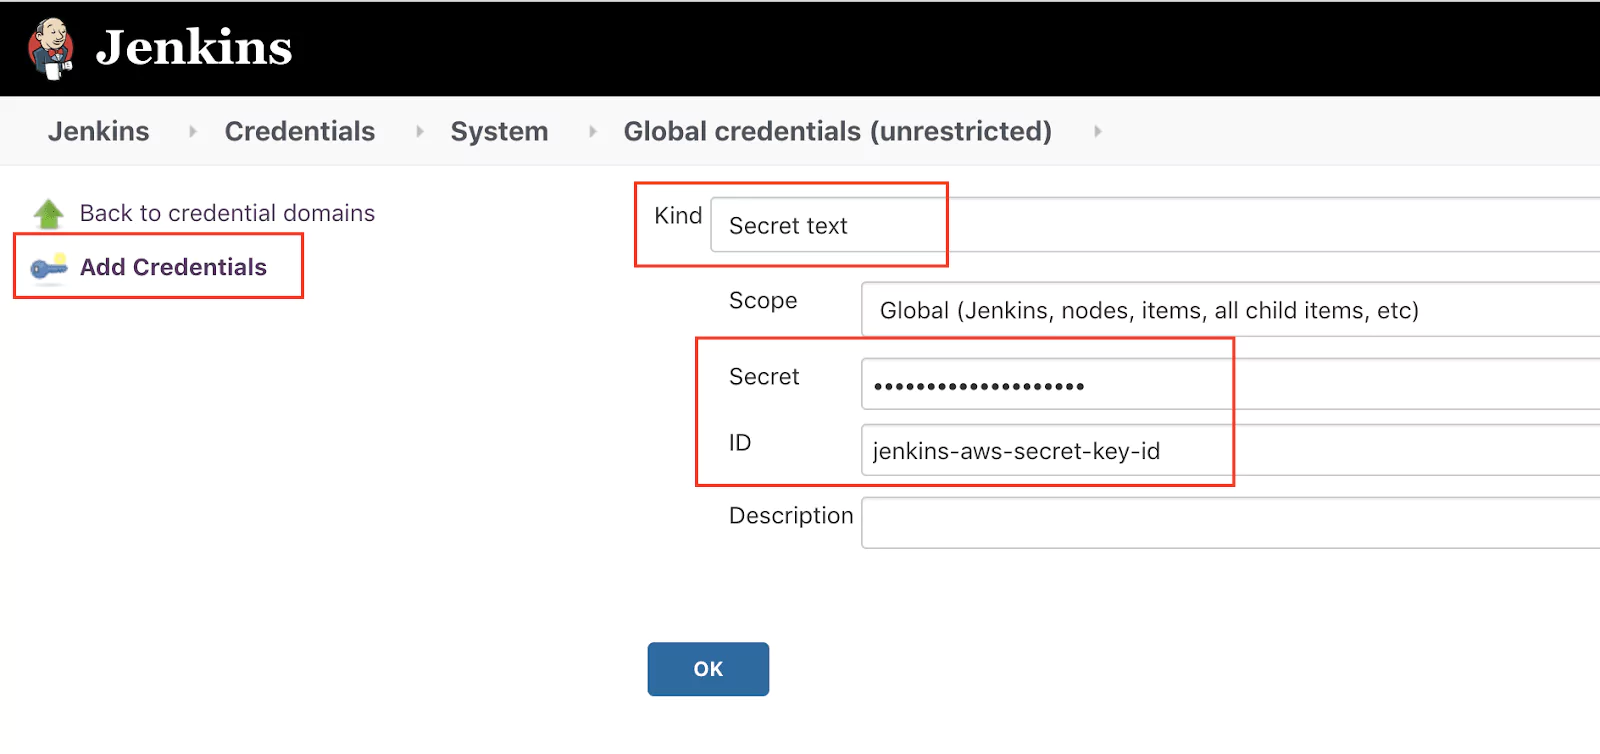
Now it is time to jump into Jenkins and store these credentials so that we can later use them in our pipeline. Go to Manage Jenkins > Credentials and click on the Jenkins store > Global credentials. If you see a menu item called Add Credentials on the right-hand side, you have reached the right place. 

Add for both the access key id and the secret access key (two entries in total). I have used the IDs jenkins-aws-secret-key-id and jenkins-aws-secret-access-key.

(15-jenkins-credentials-add.png)

After adding both credentials, the credentials overview page should look similar to the screenshot below.

(16-jenkins-credentials-overview.png)

By using this approach of storing the credentials within Jenkins, we ensure that this sensitive data does not land into our Git repository, and the use of the values will not be displayed in any logs. 

The AWS CLI will automatically pick-up the credentials stored in Jenkins, if we expose them as environment variables using a predefined name. The advantage of using environment variables is that many tools will automatically look for predefined names and use them. This makes the commands shorter and easier to read.

Inside the Jenkinsfile inside the pipeline block, add the following lines:

    environment {
        AWS_ACCESS_KEY_ID     = credentials('jenkins-aws-secret-key-id')
        AWS_SECRET_ACCESS_KEY = credentials('jenkins-aws-secret-access-key')
    }

This will instruct Jenkins to create two environment variables (AWS_ACCESS_KEY_ID, AWS_SECRET_ACCESS_KEY) and initialize them with the values stored in the Jenkins credential store.

Now we have everything in place to use the AWS CLI for uploading the jar archive to AWS S3.

There are two commands that we will execute.

The first command will let AWS know in which region you are operating. In my case, I have used the us-east-1 region for both S3 and EB:

aws configure set region us-east-1

The second command will do the upload from Jenkins to S3:

aws s3 cp ./target/calculator-0.0.1-SNAPSHOT.jar s3://YOUR-BUCKET-NAME/calculator.jar

The copy (cp) command for the S3 service will take two parameters: the source and the destination. During this process, we will rename the jar file. 

We will add both of these commands inside the success block of the publishing stage. The simplified pipeline after this step will look as follows:

pipeline {
    agent any 

     environment {
        AWS_ACCESS_KEY_ID     = credentials('jenkins-aws-secret-key-id')
        AWS_SECRET_ACCESS_KEY = credentials('jenkins-aws-secret-access-key')
    }      

    stages {
        stage('Build') {
            // build stage
        }
        stage('Test') {
           // test stage
        }
        stage('Publish') {
            steps {
                sh './mvnw package'
                // bat '.mvnw package'
            }
            post {
                success {
                    archiveArtifacts 'target/*.jar'
                    sh 'aws configure set region us-east-1'
                    sh 'aws s3 cp ./target/calculator-0.0.1-SNAPSHOT.jar s3://YOUR-BUCKET-NAME/calculator.jar'
                    // bat 'aws configure set region us-east-1'
                    // bat 'aws s3 cp ./target/calculator-0.0.1-SNAPSHOT.jar s3://YOUR-BUCKET-NAME/calculator.jar'
                }
            }
        }
    }
}

Note: If Jenkins is running on Windows, use bat inside of sh.

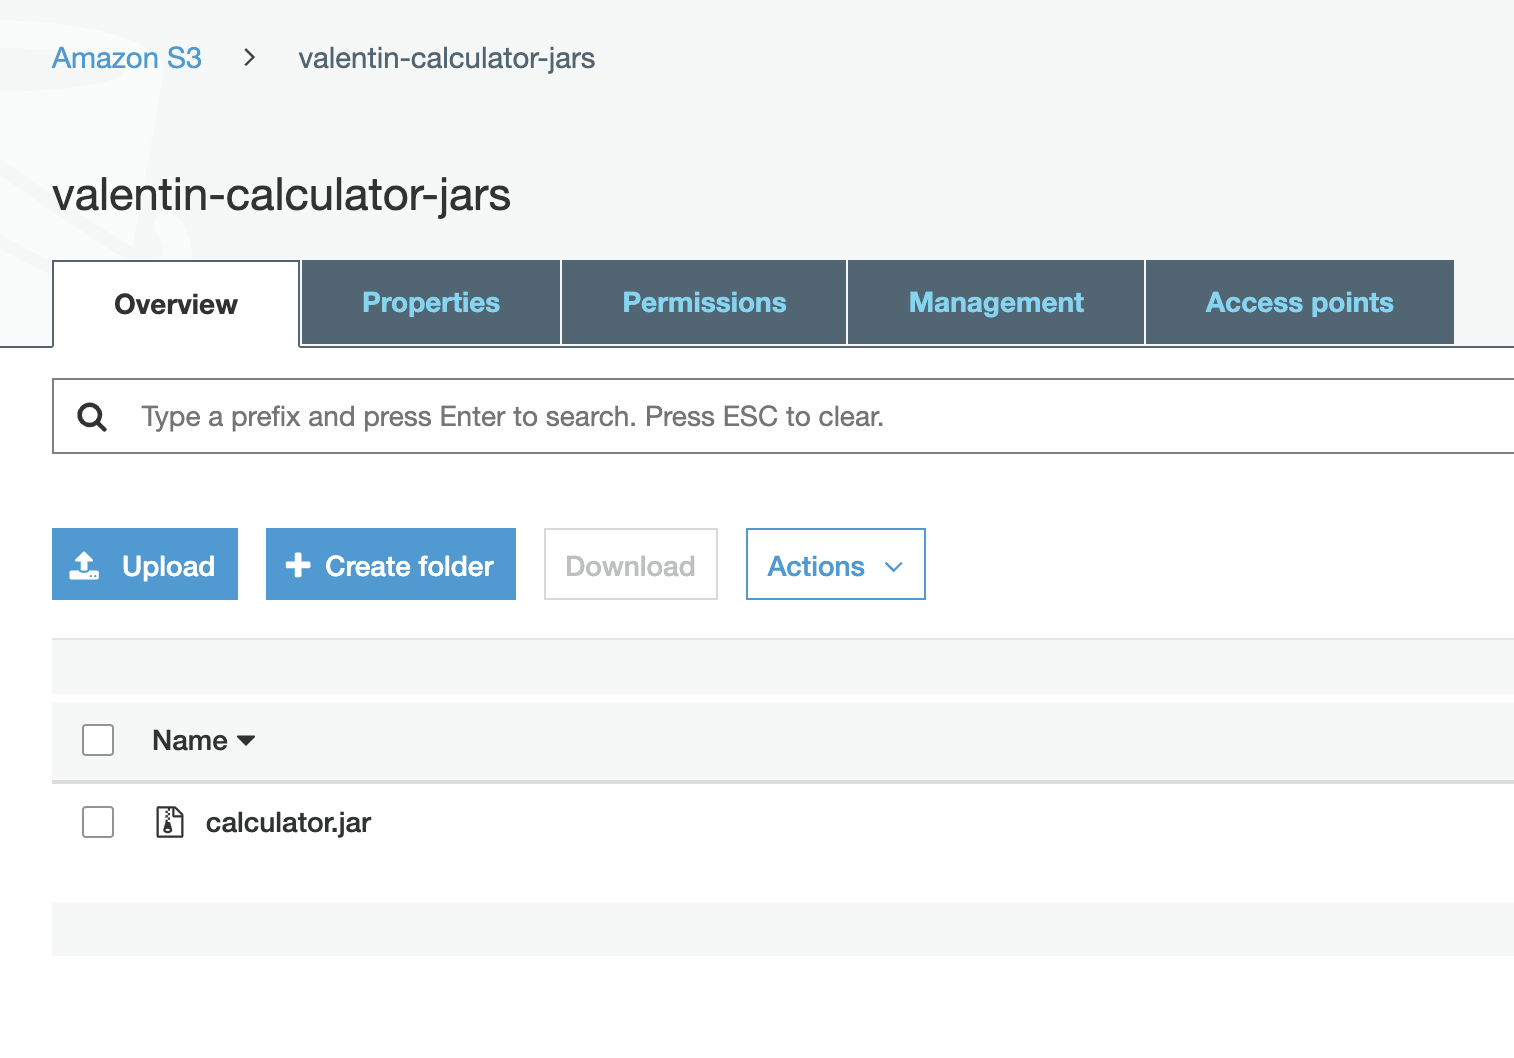
If the pipeline’s execution does not indicate any errors, you should soon see the jar archive inside the newly created S3 bucket in your AWS account. Please check the Troubleshooting section at the end of the article if you notice any errors in the console. 

(17-s3-upload-done.png)

How to deploy a new application version to AWS EB from Jenkins

Since we will start handling many parameters in the following commands, it is time to clean-up the pipeline code and organize all variables. We will begin to define new environment variables that will store the application-specific configuration. Make sure that the following values match the values you have configured in AWS.

    environment {
        AWS_ACCESS_KEY_ID     = credentials('jenkins-aws-secret-key-id')
        AWS_SECRET_ACCESS_KEY = credentials('jenkins-aws-secret-access-key')
        ARTIFACT_NAME = 'calculator.jar'
        AWS_S3_BUCKET = 'YOUR S3 BUCKET NAME'
        AWS_EB_APP_NAME = 'calculator'
        AWS_EB_ENVIRONMENT = 'Calculator-env'
        AWS_EB_APP_VERSION = "${BUILD_ID}"
    }

The first step in deploying a new version to EB is to create a new application version, by referencing a new jar artifact from S3 and specifying the application name and the artifact version.

On an Unix-like system you will access environment variables using the notation $VARIABLE_NAME while on a Windows system the notation will be %VARIABLE_NAME%.

aws elasticbeanstalk create-application-version --application-name $AWS_EB_APP_NAME --version-label $AWS_EB_APP_VERSION --source-bundle S3Bucket=$AWS_S3_BUCKET,S3Key=$ARTIFACT_NAME

You can view the full documentation and the available options at the official AWS CLI documentation for the create-application-version command ( https://awscli.amazonaws.com/v2/documentation/api/latest/reference/elasticbeanstalk/create-application-version.html)

Please note that this command will only create a new application version ready for usage in EB, but it will not affect the existing running version. 

To deploy a new application version, we need to use the update-environment command. This command will only work if we use a version that has already been created previously. The command options will be similar to the create-application-version command.

aws elasticbeanstalk update-environment --application-name $AWS_EB_APP_NAME --environment-name $AWS_EB_ENVIRONMENT --version-label $AWS_EB_APP_VERSION

You can view the full documentation and the available options at the official AWS CLI documentation for the update-environment  command. (https://awscli.amazonaws.com/v2/documentation/api/latest/reference/elasticbeanstalk/update-environment.html)

The complete publish stage will look as follows:

        stage('Publish') {
            steps {
                sh './mvnw package'
                // bat '.mvnw package'
            }
            post {
                success {
                    archiveArtifacts 'target/*.jar'
                    sh 'aws configure set region us-east-1'
                    sh 'aws s3 cp ./target/calculator-0.0.1-SNAPSHOT.jar s3://$AWS_S3_BUCKET/$ARTIFACT_NAME'
                    sh 'aws elasticbeanstalk create-application-version --application-name $AWS_EB_APP_NAME --version-label $AWS_EB_APP_VERSION --source-bundle S3Bucket=$AWS_S3_BUCKET,S3Key=$ARTIFACT_NAME'
                    sh 'aws elasticbeanstalk update-environment --application-name $AWS_EB_APP_NAME --environment-name $AWS_EB_ENVIRONMENT --version-label $AWS_EB_APP_VERSION'
                }
            }
        }

If you look inside the AWS console, you should be able to notice the latest version available.

(18-ec-new-version.png)

Troubleshooting tips

Deploying to AWS is a complex topic, and errors sometimes occur, often due to mistakes in the pipeline configuration. Below you will find some ideas on how to troubleshoot some of the most common errors.

How to find errors in the Jenkins console logs

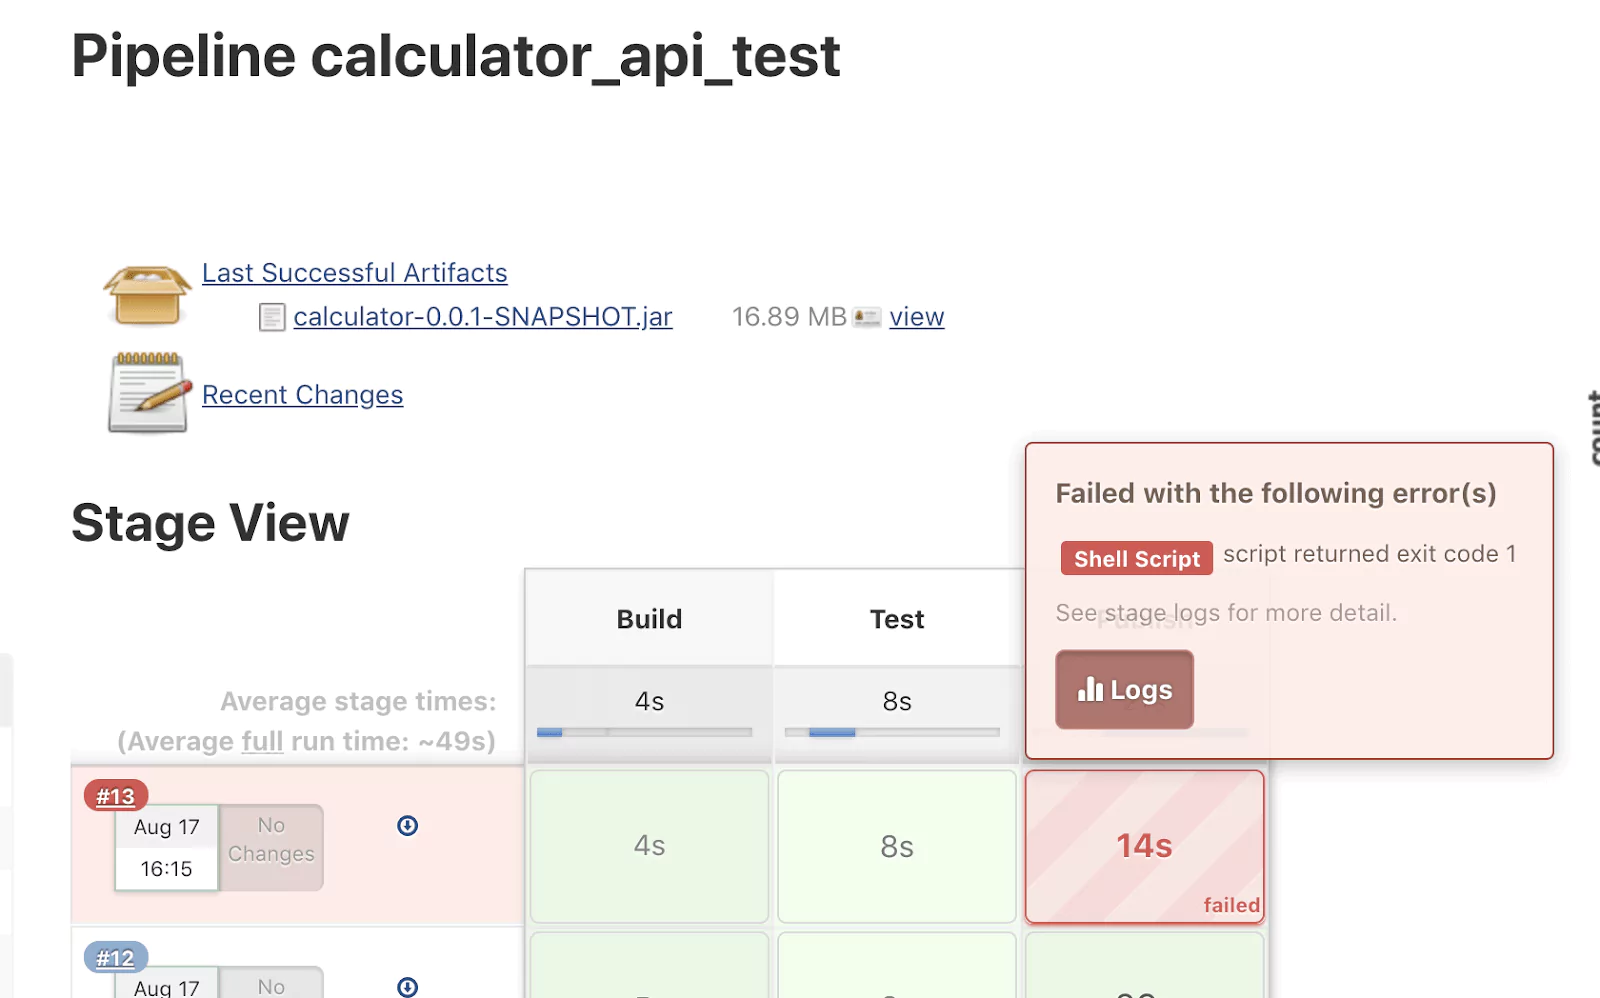
Should the pipeline fail at any stage, it is essential to read the logs for hints on what has failed. You can view the logs by clicking on the build number or clicking on the failed stage. 

(19-jenkins-error-logs.png)

Try to identify the error and the command that has generated the respective error. 

S3 upload failed – Unable to locate credentials

This error is an indication that the AWS CLI was unable to read the environment variables that contain the credentials needed: AWS_ACCESS_KEY_ID, AWS_SECRET_ACCESS_KEY. Make sure that both variables are defined and correctly spelled.

S3 upload failed – Invalid bucket name “”: Bucket name must match the regex

Take a look at the entire aws s3 cp command in the Jenkins logs. You may notice that the bucket name is empty. This is typically due to a missing or misspelled environment variable. 

An error occurred (InvalidParameterCombination) when calling the CreateApplicationVersion operation: Both S3 bucket and key must be specified.

Take a look at the entire aws elasticbeanstalk create-application-version command in the Jenkins logs. You may notice that the S3Bucket or S3Key is empty. 

The application endpoint responds with 502 Bad Gateway

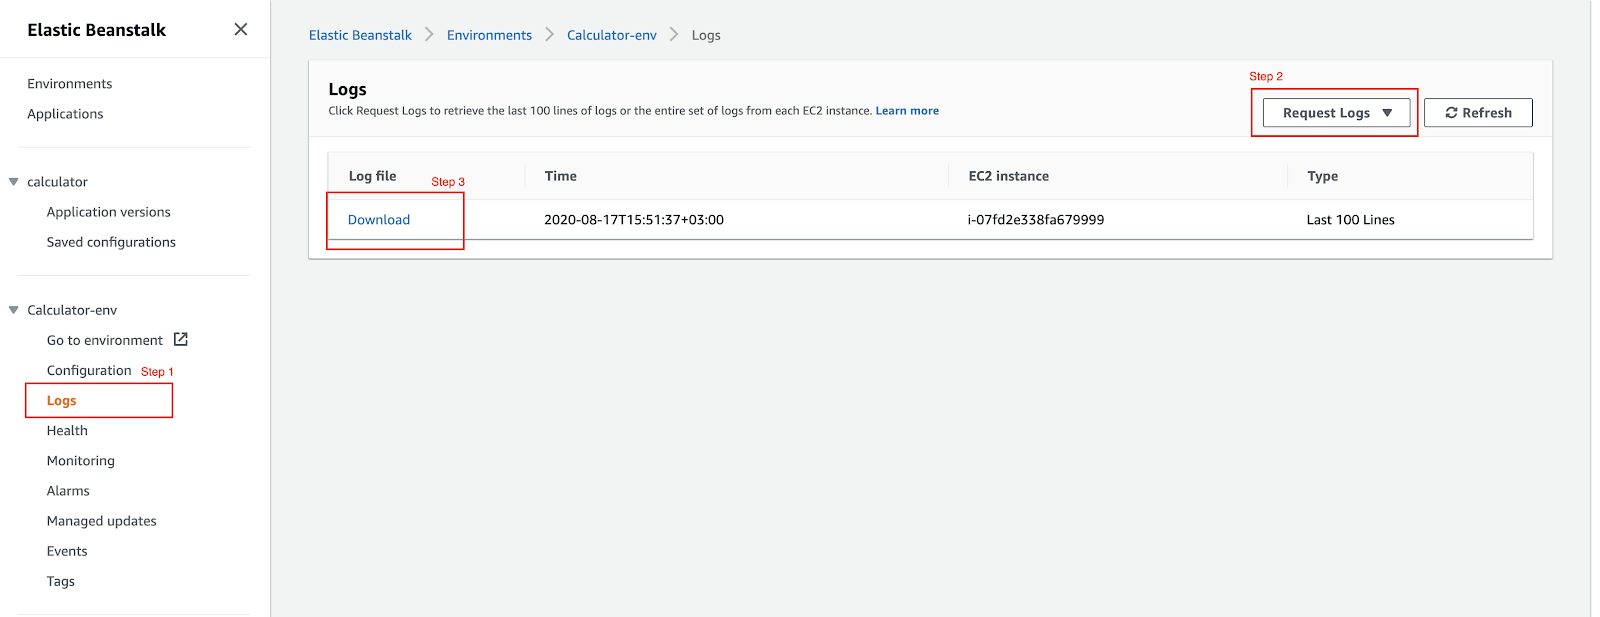
This is an indication that the application had some issues starting. It is hard to tell the root cause precisely, but the first place where you can look for hints is in the application logs. To get them, go to the respective environment and select the menu item called Logs.

(20-ec-app-logs.png)

From the list with Request Logs, get the last 100 entries. Once the logs are available, click on Download.

‘aws’ is not recognized as an internal or external command error in Jenkins

This is an error indicating that the aws command could not be found by Windows. The first step is to restart the computer and in many cases this will solve the problem. 

Conclusion and next steps

We now have the foundation for a simple but fully working CI/CD pipeline. While we are building, testing, and deploying a Java application to AWS, this solution is not production-ready. 

The CI pipeline may include additional code review, code quality, test or security stages to ensure the artifact fulfills all requirements before attempting a deployment.

For the CD pipeline, you may also want to include additional environments and tests to ensure that a deployment to the production environment will work without any issues.

Five Tools Every Java Developer Needs

If you search the internet for “Java Developer Tools”, millions of articles come back. You’ll see results that recommend the eight best Java development tools, and even those that want to share the 20 best Java tools. The problem is that sometimes too much of a good thing can be bad.

As a Java developer, you need the consensus, the best-of-breed tools in each category. You want someone to tell you the best tool for each purpose, grab it and start working. You don’t need to sit and evaluate an endless selection of tools to find out which is 2% better than the other.

We want to help you save time by pinpointing the best tool for each development requirement. There are five essential categories of tools you will need as a Java developer:

  1.  An Integrated Development Environment (IDE)
  2.  A build tool
  3.  A Java profiler
  4.  A framework for writing and running tests
  5.  A troubleshooter

What is Java?

Java is a programming language and platform that was released in 1995. As all developers know, Java is a huge part of the ever-evolving digital space and a reliable platform for many to build services and applications. It’s fast, reliable, and secure, which makes it perfect for coding everything, from enterprise software to mobile applications.

The five tools every Java developer needs

Whether you’re looking for Java build tools or Java script development tools, we’ve got you covered. Here are the five tools every Java developer needs:

 1. Integrated Development Environment (IDE)

An IDE is a comprehensive suite of software tools that every developer needs. An IDE should include, at a minimum, a source code editor, build automation tools and a debugger.

The consensus best-of-breed IDE is the open source Eclipse IDE. Surveys indicate that it is the preferred IDE for almost half of Java developers. It is so widely adopted that there is a large selection of third-party plugins that extend its core functionality. You can’t go wrong choosing Eclipse for your IDE.

2. Build Tool

Build tools automate the building, publishing, and deploying of software applications. The honor for best Java build tool goes to the open source Gradle.

Gradle isn’t currently the most widely adopted tool, Maven is. However, since Gradle builds on the features of Maven, it is quickly increasing its adoption rate. Gradle prides itself on developers being able to build anything, automate everything and deliver faster. It also allows you to build in any language, whether it be Java, Kotlin or CC+. 

Similar to Eclipse, Gradle comes with a vast ecosystem of plugins for extending its capabilities. It’s just a matter of time before Gradle becomes the most widely adopted build tool around.

 3. Java Profiler

A Java profiler is a tool used to analyze a Java program and estimate its CPU and memory requirements. It is used primarily to optimize code.

The YourKit Java Profiler has already been recognized by many IT professionals and analysts as the best profiling tool and has even received the Java Developer’s Journal Editor’s Choice Award. Key features of YourKit include:

  • Tight integration with IDEs
  • Profile remote applications
  • CPU profiling
  • Flame graphs
  • Database queries and web requests
  • Memory profiling
  • Comparing CPU and memory snapshots
  • Performance inspections
  • Thread synchronization issues

And more you can view here.

4. Framework for Testing

Whether testing a smaller project or a unit of a larger project, you’re going to need the ability to conduct white-box testing. White-box testing is a method of testing software that tests the internal structures or workings of an application as opposed to its functionality. A unit test framework is a core tool of test-driven development and enables repeatable white-box testing.

The open source JUnit is a simple, open source framework for writing and running white-box tests. It can test classes and methods, as well as functionality. In the past, it has also won Java Editor’s Choice Award for best performance testing tool.

5. Troubleshooter

When it comes to your Java code, you’re going to want an all-in-one troubleshooter. A tool that can allow you to generate and analyze heap data, track down memory leaks, and monitor the garbage collector. You’ll also want it designed for both development and production time.

VisualVM, which makes it easy to diagnose performance issues in real-time, fits the bill. VisualVM actually comes with the Java Development Kit (JDK), the most widely used Software Development Kit (SDK).

VisualVM perfectly fits all the requirements of application developers, system administrators, quality engineers, and end users. In a survey conducted by Rebel Labs, they found that VisualVM is used by 46.5% of developers.

Final thoughts

There are a lot of tools available to you as a Java developer, and sometimes the choices can be overwhelming. When making your decisions, you want to ensure you are selecting widely adopted, award-winning tools with full-scale capabilities. 

If you’re unsure where to start, remember you can’t go wrong with Eclipse, Gradle, YourKit, JUnit, and VirtualVM.

(This blog post was updated August 2023)

Java Logging Guide: How To Do It Right

Log monitoring is something you want to plan and standardize before you start writing your code, especially if it involves different teams or separate locations.

During the last couple of years, we witnessed the strong connection between quality and standardized logging and the ability to track and resolve production problems.

In this post, we will focus on a few lessons we’ve learned about Java logging and how to do it right.

What is Java logging? 

Java logging, commonly known as logging, serves a crucial role in undetstanding system performance and identifying the root causes of failures. It aids the analysis of program executions by keeping a record of events, which makes it invaluable for tasks such as auditing and debugging.

However, it’s important to note that logging does not occur automatically. Developers must proactively implement logging rules to ensure they can effectively manage the logging process.

9 tips for effective Java logging Setting up your logging correctly is crucial for the future and can help you get the most from your logging. Here are some tips and Java logging best practices to get you started:

9 tips for effective Java logging

Setting up your logging correctly is crucial for the future and can help you get the most from your logging. Here are some tips and Java logging best practices to get you started:

1) Set your log severity right

Many times, too often actually,  we see a complete log file written with the same log severity. This makes your logs harder to understand and hides the important logs you want to notice.

To make it easier for you to decide what severity to set for each log, here are some simple log severity guidelines:

  • Debug/Verbose: Logs that are mainly used by the developers and contain data such as response times, health checks, queues status etc. An example for a debug log would be “Number of messages in the user creation queue = 3482”
  • Info: Business processes and transactions, these logs should be readable for QA, Support and even advanced users to understand the system’s behavior. An example of an info log will contain data on a product purchase on your e-commerce platform, a user creation on your social media or a successful batch process on your data analytics solution.
  • Warning: These logs mean something unusual happened or something isn’t right, but it does not necessarily mean that anything failed or the user will notice a problem. An example of a warning would be “Received illegal character for username – “Jame$” , ignoring char”  
  • Error: A problem that must be investigated; use the Error severity to log Disconnections, failed tasks or failures that reflect to your users. If you see an error in your log that does not require immediate investigation, you should probably lower its severity.
  • Critical/Fatal: Something terrible happened, stop everything and handle it,. This could beCrashes, Serious latency or performance issues, security problems. All these must be logged with the log severity Critical.

2) Remember you will not be the only one reading these logs

When writing your application logs, remember that besides you, other people will read these logs. Whether it’s programmers, QA or support consuming the logs you wrote, they better be clear and informative. 

On the other hand, logs that are long and detailed can be hard to parse automatically (grep, awk, etc.), so either you find a way to write a clear log that can also be parsed easily, or you can simply print two logs, one for humans and one for computers:

E.g – Print these two logs together, the first log for humans and the second for computers:

  • “transaction was completed successfully” + transactionID “total time for transaction =” + TimeElapsed
  • “success” + transactionID  “time” + TimeElapsed

3) Track your communication with other systems

Integration issues can be the hardest to debug; our suggestion is that you log every event that comes in/out of your system to an external system, whether it is HTTP headers, authentications, keep alive, etc.

In complex and high scale systems this can be a performance overhead, but in case you experience performance issues, you can always switch off the logging for that particular log level (usually Debug or Trace) and use it when something goes wrong with your production.

4) Add metadata to your logs

Often, programmers write great log text and severity but forget to add the log metadata such as Category, Class, method or threadID. 

Adding metadata to your logs can significantly enhance your capability of pinpointing production problems as you can search and identify problematic categories, classes or methods or follow a thread to understand the root cause of an error you see. The more metadata you add, the better your log is.

5) Use a logging API

Logging APIs make it much easier to add log destinations and integrate with logging tools seamlessly and without any code modifications. In addition, they make your logs more clear by standardizing them and enriching them with metadata fields such as thread ID.

The two most common logging API’s for Java are Log4J and Logback (slf4j).

Note that one of the greatest benefits of Log4J and Logback is that they allow you to send logs from any Java-based Apache project easily! (Kafka, Hazelcast, etc.)

A Logback log will be written in the following structure:

log.warning(“Retried {} times before succeeding to create user: ‘{}’”, retries, username);

The same log in Log4J would be:

log.warning(“retried” + retries + “times before succeeding to create user” + username);

6) Make sure you know what you are logging

When writing logs, especially when calling functions and variables within that log, make sure you understand what will be the outcome of that print. Bad logs can be:

  • inconsistent – values that arrive NULL or with different data types
  • Too long – Printing a list of URLs that is impossible to read or printing HEX values, for instance
  • Null – printing logs that rely on a variable that may or may not have content, for instance: log.error(monitor.get_ERR_reason)

7) Don’t write huge logs

It’s great to write detailed and descriptive logs, but many times we see single log entries with an enormous amount of characters (20K+) as the logs are used to store data that is completely unrelated to logs and should be managed separately. This can cause serious performance issues when writing logs to your disk and create bandwidth issues when using hosted logging solutions.  

Remember what the is the main purpose of your logs and stick to it. You want clear logs that tell the story of your software for you to understand its behavior and be able to debug it.

8) Log exceptions correctly

We all probably agree that reporting exceptions is a crucial part of the logging process. On that basis, some tend to both report the exception and then wrap it with their own custom exception and throw it again. This will probably cause the stack trace to be printed twice, a fact that will most likely cause confusion. We suggest never to report and re-throw, decide what works for you best and stick to it. 

We generally recommend throwing the exception with your own custom exception and catching them all in a centralized handler which will log them and handle any other activities that are needed.

Here are some examples of Java exception logging:

BAD:

try {

   Integer x = null;

   ++x;

} catch (Exception e) {

log.error(“IO exception”, e);

throw new MyCustomException(e);

}

BETTER:

try {

   Integer x = null;

   ++x;

} catch (Exception e) {

log.error(“IO exception”, e);

}

BEST:

try {

   Integer x = null;

   ++x;

} catch (Exception e) {

throw new MyCustomException(e);

}

As a rule of thumb, let the logging framework you are using help you log exceptions and don’t do it yourself. Remember, the first argument is always the text message; write something about the nature of the problem. 

Don’t include the exception message, as it will be printed automatically after the log statement preceding the stack trace. But to do so, you must pass the exception itself as the second argument; other logging standards will most likely cause the message to be printed wrongly.

BAD:

log.error(e);

log.error(e, e);  

log.error(“” + e);

log.error(e.toString());  

log.error(e.getMessage());

log.error(null, e);

log.error(“”, e);

log.error(“{}”, e);

log.error(“{}”, e.getMessage());

log.error(“Error reading configuration file: ” + e);

log.error(“Error reading configuration file: ” + e.getMessage());

GOOD:

log.error(“Error reading configuration file”, e);

9) Use an ID to track your events

This method will allow you to easily filter or search for a specific event that you want to track. The idea is that whoever is responsible for creating an event (e.g. client, worker etc) generates a unique ID that is passed through all functions and service calls that are used to process that event. Then once an exception or error occurs, it is simple to take the event ID from that error and query for its history throughout the different functions, services and components.

Closing thoughts

In the Java logging community, there are many logging methods that exist, which presents developers with a plethora of options to choose based on their specific needs and requirements. 

The selection of an appropriate logging approach can massively impact the effectiveness and efficiency of the logging process. The choice ultimately depends on the complexity of the project, the desired level of customisation, and the need for compatiability with existing systems. 

By following our tips above, you can create a well-executed logging strategy that can factilitate system monitoring and debugging, whilst enhancing the maintainability and staibility of Java applications.

(This blog post was updated August 2023)