If your organization is embracing cloud-native practices, then breaking systems into smaller components or services and moving those services to containers is an essential step in that journey.
Containers allow you to take advantage of cloud-hosted distributed infrastructure, move and replicate services as required to ensure your application can meet demand, and take instances offline when they’re no longer needed to save costs.
Once you’re dealing with more than a handful of containers in production, a container orchestration platform becomes practically essential. Kubernetes, or K8s for short, has become the de-facto standard for container orchestration, with all major cloud providers offering K8s support and their own Kubernetes managed service.
With Kubernetes observability, you can automate your containers’ deployment, management, and scaling, making it possible to work with hundreds or thousands of containers and ensure reliable and resilient service.
Fundamental to the design of Kubernetes is its declarative model: you define what you want the state of your system to be, and Kubernetes works to ensure that the cluster meets those requirements, automatically adding, removing, or replacing pods (the wrapper around individual containers) as required.
The self-healing design can give the impression that observability and monitoring are all taken care of when you deploy with Kubernetes. Unfortunately, that’s not the case. While some things are handled automatically – like replacing failed cluster nodes or scaling services – Kubernetes observability still needs to be built in and used to ensure the health and performance of a K8s deployment.
Log data plays a central role in creating an observable system. By monitoring logs in real-time, you gain a better understanding of how your system is operating and can be proactive in addressing issues as they emerge, before they cause any real damage. This article will look at how Kubernetes observability can be built into your Kubernetes-managed cluster, starting at the bottom of the stack.
Observability for K8s infrastructure
As a container orchestration platform, Kubernetes handles the containers running your application workloads but doesn’t manage the underlying infrastructure that hosts those containers.
A Kubernetes cluster consists of multiple physical and/or virtual machines (the cluster nodes) connected over a network. While Kubernetes will take care of deploying containers to the nodes (according to the declared configuration) and packing them efficiently, it cannot manage the nodes’ health.
Your cloud provider is responsible for keeping servers online and providing computing resources on demand in a public cloud context. However, to avoid the risk of a huge bill, you’ll want to keep an eye on your usage – and potentially set quotas – to prevent auto-scaling and elastic resources from running wild. If you’ve set quotas, you’ll need to monitor your usage and be ready to provision additional capacity as demand grows.
If you’re running Kubernetes on a private cloud or on-premise infrastructure, monitoring the health of your servers – including disk space, memory, and CPU – and keeping them patched and up-to-date is essential.
Although Kubernetes will take care of moving pods to healthy nodes if a machine fails, with a fixed set of resources, that approach can only stretch so far before running out of server nodes. To use Kubernetes’ self-healing and auto-scaling features to the best effect, you must ensure sufficient cluster nodes are online and available at all times.
Using Kubernetes’ metrics and logs
Once you’ve considered the observability of the servers hosting your Kubernetes cluster, the next layer to consider is the Kubernetes deployment itself.
Although Kubernetes is self-healing, it is still dependent on the configuration you specify; by getting visibility into how your cluster is being used, you can identify misconfigurations, such as faulty replica sets, and spot opportunities to streamline your setup, like underused nodes.
As you might expect, the various components of Kubernetes each emit log messages so that the inner workings of the system can be observed. This includes:
kube-apiserver – This serves the REST API that allows you, as an end-user, to communicate with the cluster components via kubectl or a GUI application, and enables communication between control plane components over gRPC. The API server logs include details of error messages and requests. Monitoring these logs can alert you to early signs of the server needing to be scaled out to accommodate increased load or issues down the pipeline that are slowing down the processing of incoming requests.
kube-scheduler – The scheduler assigns pods to cluster nodes according to configuration rules and node availability. Unexpected changes in the number of pods assigned could signify a misconfiguration or issues with the infrastructure hosting the pods.
kube-controller-manager – This runs the controller processes. Controllers are responsible for monitoring the status of the different elements in a cluster, such as nodes or endpoints, and moving them to the desired state when needed. By monitoring the controller manager over time, you can determine a baseline for normal operations and use that information to spot increases in latency or retries. This may indicate something is not working as expected.
The Kubernetes logging library, klog, generates log messages for these system components and others, such as kubelet. Configuring the log verbosity allows you to control whether logs are only generated for critical or error states or lower severity levels too.
While you can view log messages from the Kubernetes CLI, kubectl, forwarding logs to a central platform allows you to gain deeper insights. By building up a picture of the log data over time, you can identify trends and compare these to the latest data in real-time, using it to identify changes in cluster behavior.
Monitoring a Kubernetes-hosted application
In addition to the cluster-level logging, you need to generate logs at the application level for full observability of your system. Kubernetes observability ensures your services are available, but it lacks visibility or understanding of your application logic.
Instrumenting your code to generate logs at appropriate severity levels makes it possible to understand how your application is behaving at runtime and can provide essential clues when debugging failures or investigating security issues.
Once you’ve enabled logging into your application, the next step is to ensure those logs are stored and available for analysis. By their very nature, containers are ephemeral – spun up and taken offline as demand requires.
Kubernetes stores the logs for the current pods and the previous pods on a given node, but if a pod is created and removed multiple times, the earlier log data is lost.
As log data is essential for determining what normal behavior looks like, investigating past incidents and for audit purposes, it’s a good idea to consider shipping logs to a centralized platform for storage and analysis.
The two main patterns for shipping logs from Kubernetes are to use either a node logging agent or a sidecar logging agent:
With a node logging agent, the agent is installed on the cluster node (the physical or virtual server) and forwards the logs for all pods on that node.
With a sidecar logging agent, each pod holds the application container together with a sidecar container hosting the logging agent. The agent forwards all logs from the container.
Once you’ve forwarded your application logs to a log observability platform, you can start analyzing the log data in real-time. Tracking business metrics, such as completed transactions or order quantities, can help to spot unusual patterns as they begin to emerge.
Monitoring these alongside lower-level application, cluster, and infrastructure health data makes it easier to correlate data and drill down into the root cause of issues.
Summary
While Kubernetes offers many benefits when running distributed, complex systems, it doesn’t prevent the need to build observability into your application and monitor outputs from all levels of the stack to understand how your system is behaving.
With Coralogix, you can perform real-time analysis of log data from each part of the system to build a holistic view of your services. You can forward your logs using Fluentd, Fluent-Bit, or Filebeat, and use the Coralogix Kubernetes operator to apply log parsing and alerting features to your Kubernetes deployment natively using Kubernetes custom resources.
Since Google first introduced Kubernetes, it’s become one of the most popular DevOps platforms on the market.
Unfortunately, increasingly widespread usage has made Kubernetes a growing target for hackers. To illustrate the scale of the problem, a Stackrox report found that over 90% of respondents had experienced some form of security breach in 2020. These breaches were due primarily to poorly-implemented Kubernetes security.
This is such a serious problem it is even slowing the pace of innovation. Businesses are struggling to find people with the right Kubernetes skills to tackle security issues.
The way we see it, making Kubernetes secure is part of a wider conversation around integrating cybersecurity into DevOps practice. We’ve previously talked about how organizations are embracing DevSecOps as a way of baking security into DevOps.
Kubernetes security is really about taking those insights and applying them to Kubernetes systems.
1. Kubernetes Role-Based Access Control for Security
Many IT systems enhance security by giving different access rights to different levels of users. Kubernetes is no exception. RBAC Authorization (Role Based Access Control)allows you to control who can access your Kubernetes cluster. This reduces the possibility of an unauthorized third party stealing sensitive information.
RBAC can be easily enabled with a Kubernetes command that includes ‘RBAC’ in its authorization mode flags. For example:
The Kubernetes API allows you to specify the access rights to a cluster using four special-purpose objects.
ClusterRole and Role
These two objects define access permissions through sets of rules. The ClusterRole object can define these rules over your whole Kubernetes cluster. A typical ClusterRole might look like this.
apiVersion:rbac.authorization.k8s.io/v1kind:ClusterRolemetadata:# "namespace" omitted since ClusterRoles are not namespacedname:secret-readerrules:- apiGroups:[""]## at the HTTP level, the name of the resource for accessing Secret# objects is "secrets"resources:["secrets"]verbs:["get","watch","list"]
ClusterRoles are useful for granting access to nodes, the basic computational units of clusters. They are also useful when you want to specify permissions for resources such as pods without specifying a namespace.
In contrast, the Role object is scoped to particular namespaces, virtual clusters that are contained within your cluster. An example Role might look something like this.
apiVersion:rbac.authorization.k8s.io/v1kind:Rolemetadata:namespace:my-namespacename:pod-readerrules:- apiGroups:[""]# "" indicates the core API groupresources:["pods"]verbs:["get","watch","list"]
Roles are useful when you want to define permissions for particular namespaces.
ClusterRoleBinding and RoleBinding
These two objects can take the permissions defined in a Role/ClusterRole and grant them to particular groups of users. In these objects, the users, called subjects) are linked to the Role through a reference called RoleRef, similar to how your contacts can be grouped into “work” or “home”.
ClusterRoleBinding gives the permissions for a specific role to a group of users across an entire cluster. To enhance security, RoleRef is immutable. Once ClusterRoleBinding has granted a group of users a particular role, that role can’t be swapped out for a different role without creating a new ClusterRoleBinding.
Kubernetes Pod Security
Kubernetes also lets you specify permissions for pods, which sit on top of clusters and contain your application. Through the use of Kubernetes security contexts, you can define access privileges with Policies.
Policies come in three flavors. Privileged is the most permissive policy. It’s useful if you’re an admin. After this comes Baseline. This has minimal restrictions and is appropriate for trusted users who aren’t admins.
Restricted is the most restricted policy. With security features such as disallowing containers from running non-root, it’s adapted for maximal pod-hardening. Restricted should be used for applications where Kubernetes security is critical.
2. Kubernetes Security Monitoring and Logging
Malicious actors often betray themselves through their effects on the systems they’re trying to penetrate. Looking out for anomalous changes in web traffic or CPU usage can alert you to a security breach in time for you to stop it before it does any real damage.
To track these kinds of metrics successfully, you need really good monitoring and logging. That’s where Coralogix comes in handy. You can use FluentD to integrate Coralogix logging into your Kubernetes cluster.
This lets you leverage the power of machine learning to extract insights and trends from your logs. Machine learning allows computers to detect patterns in large datasets. With this tool, Coralogix can use your logs to identify behavior that shows a divergence from the norm in the future.
In the context of Kubernetes security, this predictive capability can allow you to spot a potential data breach before it happens. The benefits this brings to cybersecurity can’t be overstated.
Additionally, the Coralogix Kubernetes Operator enables you to configure Coralogix to do just what you need for Kubernetes security.
3. Kubernetes Service Meshes
In a previous post, we discussed the changing landscape of network security. In the early 2000s, most websites used 3-tier architectures which were vulnerable to attacks. The advent of containerized solutions like Kubernetes has increased security but required novel solutions to scale applications in a security-friendly way. Luckily, we’ve got Kubernetes service meshes to help with this.
A service mesh works to decouple security concerns from the particular application you happen to be running. Instead, security is handed off to the infrastructure layer through the use of a sidecar. One capability a service mesh has is encrypting traffic in a cluster. This prevents hackers from intercepting traffic, lowering the risk of data breaches.
In Kubernetes, service meshes typically integrate through the service mesh interface. This is a standard interface that provides features for the most common use cases, including security.
Service meshes can also help with observability. Observability, in this case, involves seeing how traffic flows between services. We’ve previously covered service meshes in the context of observability and monitoring more in-depth.
4. Kubernetes Security in the Cloud
Due to the popularity of cloud-based solutions, many organizations are opting for cloud-native Kubernetes. Cloud-native security splits into four layers. Going from the bottom up these are cloud, cluster, container, and code.
We’ve already talked about cluster and container security earlier in this article, so let’s discuss cloud and code.
Cloud security is contingent on the security of whichever cloud provider you happen to be using. Kubernetes recommends you read their documentation to understand how good their security is.
Code security, by contrast, is an area where you can take a lot of initiative. A running Kubernetes application is a primary attack surface for potential hackers to exploit. Because your development team writes the application code, there’s plenty of opportunities to implement good security features.
For example, if you’re using third-party libraries, you should scan them for potential security vulnerabilities to avoid being caught off guard. It’s also good to make sure your application has as few ports exposed as possible. This limits the effective attack surface of your system, making it harder for malicious actors to penetrate.
5. Kubernetes Security Through Containerization Best Practices
Kubernetes is founded on the concept of containerization. Systems like Docker wrap your application in layers of containers, which perform the role of a traditional server, but without any complex setup and configuration.
Trouble with Docker
When containerization isn’t done properly, Kubernetes security can be seriously compromised. Let’s look at Docker, for example. Docker applications are made of layers. This means they are constructed a bit like a pastry. The innermost layer provides for basic language support while successive layers, or images, add functionality.
Because each Docker layer is maintained in a Docker Hub and under the control of a central repository owner, there is nothing to stop the inner layer from changing without warning. In the worst case, a Docker image can be intentionally modified by a hacker trying to cause a Kubernetes security breach.
Docker Image Fixes
The problem of Docker layers changing can be solved by changing how Docker layers are tagged. Each Docker layer normally has a latest tag, signifying it is the most recent update in Docker Hub. It’s possible to swap out latest for a version-specific tag like node:14.5.0. With this, you can stop the inner layers from changing and guarantee security for your application.
Alternatively, there are third-party tools such as Clair. This particular tool scans external databases for known vulnerabilities and scans images layer by layer to check for vulnerabilities.
Wrapping Up
Google named their containerization solution Kubernetes, Greek for steersman/helmsman. To developers up to their necks in the vagaries of server management, Kubernetes can act like a lighthouse, guiding them smoothly through the high seas of CI/CD.
Kubernetes and containerization are fast becoming the most popular way to deploy and scale applications. But this popularity brings increasing security risks, particularly if DevOps teams aren’t always following best practices.
This part 2 of a 3-part series on running ELK on Kubernetes with ECK. If you’re just getting started, make sure to checkout Part 1.
Setting Up Elasticsearch on Kubernetes
Picking up where we left off, our Kubernetes cluster is ready for our Elasticsearch stack. We’ll first create an Elasticsearch Node and then continue with setting up Kibana.
Importing Elasticsearch Custom Resource Definitions (CRD) and Operators
Currently, Kubernetes doesn’t yet know about how it should create and manage our various Elasticsearch components. We would have to spend a lot of time manually creating the steps it should follow. But, we can extend Kubernetes’ understanding and functionality, with Custom Resource Definitions and Operators.
Luckily, the Elasticsearch team provides a ready-made YAML file that defines the necessary resources and operators. This makes our job a lot easier, as all we have to do is feed this file to Kubernetes.
Let’s first log in to our master node:
vagrant ssh kmaster
Note: if your command prompt displays “vagrant@kmaster:~$“, it means you’re already logged in and you can skip this command.
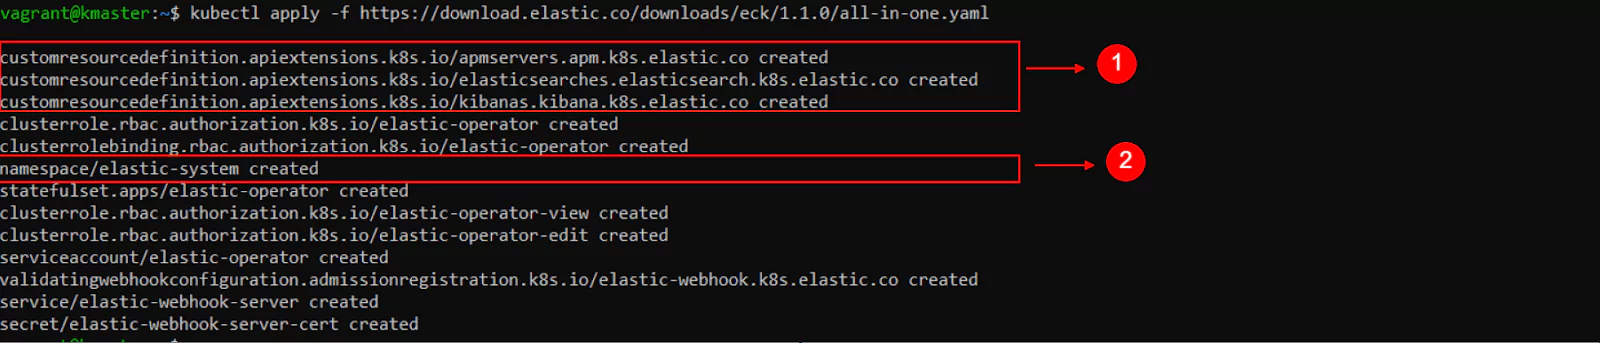
With the next command, we import and apply the structure and logic defined in the YAML file:
Optionally, by copying the “https” link from the previous command and pasting it into the address bar of a browser, we can download and examine the file.
Many definitions have detailed descriptions which can be helpful when we want to understand how to use them.
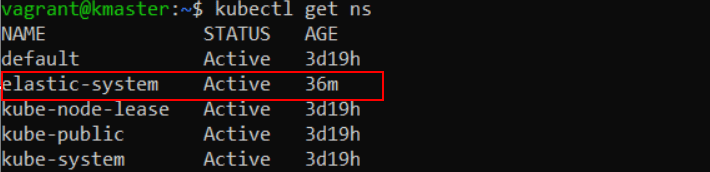
We can see in the command’s output that a new namespace was created, named “elastic-system”.
Let’s go ahead and list all namespaces in our cluster:
kubectl get ns
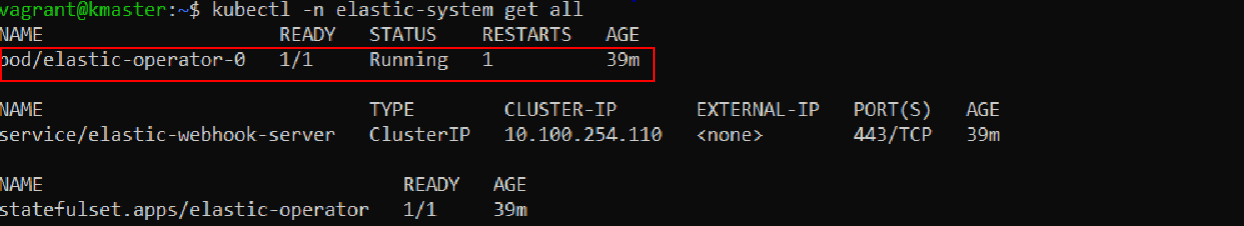
Now let’s look at the resources in this namespace:
kubectl -n elastic-system get all
“-n elastic-system” selects the namespace we want to work with and “get all” displays the resources.
The output of this command will be useful when we need to check on things like which Pods are currently running, what services are available, at which IP addresses they can be reached at, and so on.
If the “STATUS” for “pod/elastic-operator-0” displays “ContainerCreating“, then wait a few seconds and then repeat the previous command until you see that the status change to “Running“.
We need the operator to be active before we continue.
Launching an Elasticsearch Node in Kubernetes
Now it’s time to tell Kubernetes about the state we want to achieve.
The Kubernetes Operator will then proceed to automatically create and manage the necessary resources to achieve and maintain this state.
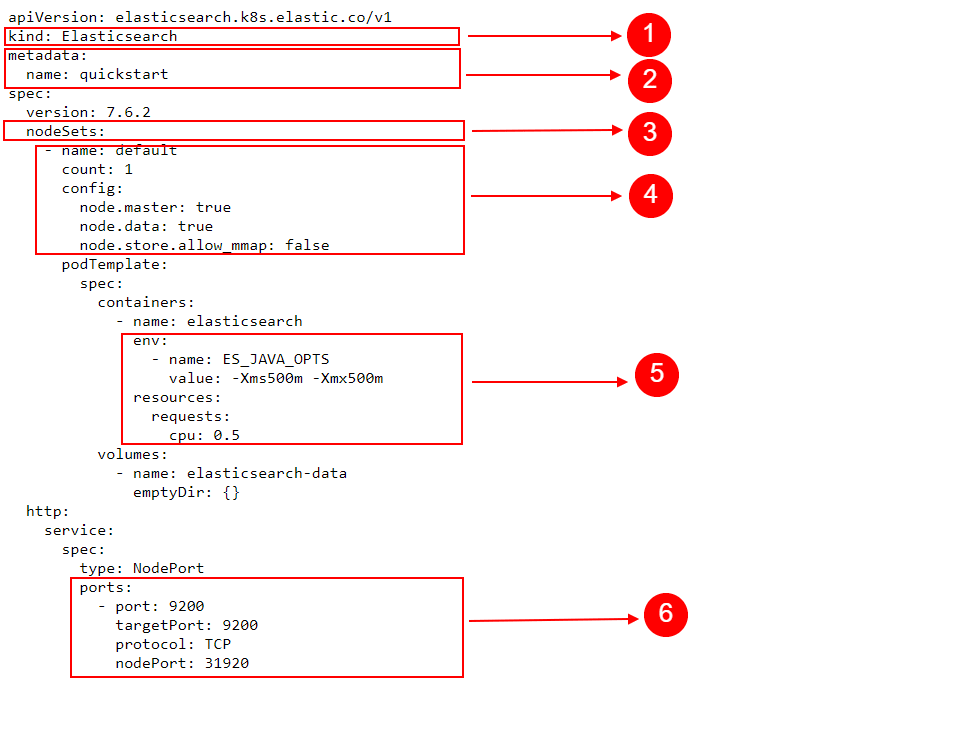
We’ll accomplish this with the help of a YAML file. Let’s analyze its contents before passing it to the kubectl command:
kind here means the type of object that we’re describing and intend to create
Under metadata, the name, a value of our choosing, helps us identify the resources that’ll be created
Under nodeSets, we define things like:
The name for this set of nodes.
In count, we choose the number of Elasticsearch nodes we want to create.
Finally, under config, we define how the nodes should be configured. In our case, we’re choosing a single Elasticsearch instance that should be both a Master Node and a Data Node. We’re also using the config option “node.store.allow_mmap: false“, to quickly get started. Note, however, that in a production environment, this section should be carefully configured. For example, in the case of the allow_mmap config setting, users should read Elasticsearch’s documentation about virtual memory before deciding on a specific value.
Under podTemplate we have spec (or specifications) for containers.
Under env we’re passing some environment variables. These ultimately reach the containers in which our applications will run and some programs can pick up on those variables to change their behavior in some way. The Java Virtual Machine, running in the container and hosting our Elasticsearch application, will notice our variable and change the way it uses memory by default.
Also, notice that under resources we define requests with a cpu value of “0.5“. This decreases the CPU priority of this pod.
Under http, we define a service, of the type: NodePort. This creates a service that will be accessible even from outside of Kubernetes’ internal network. In this lesson, we will analyze why this option is important and when we’d want to use it.
Under the ports section we find:
Port tells the service on which port to accept connections. Only apps running inside the Kubernetes cluster can connect to this, so no external connections allowed. For external connections, nodePort will be used.
targetPort makes the requests received by the Kubernetes service on the previously defined port to be redirected to this targetPort in one of the Pods. Of course, the application running in that Pod/Container will also need to listen on this port, to be able to receive the requests. For example, a program makes a request on port 12345, the service will redirect the request to a pod, on targetPort 54321.
Kubernetes runs on Nodes, that is physical or virtual machines. Each physical or virtual machine can have its own IP address, on which other computers can communicate with it. This is called the Node’s IP address or external IP address. nodePort opens up a port, on every node in your cluster, that can be accessed by computers that are outside of Kubernetes’ internal network. For example, if one node would be using a publicly accessible IP address, we could connect to that IP and the specified nodePort and Kubernetes would accept the connection and redirect it to the targetPort to one of the Pods.
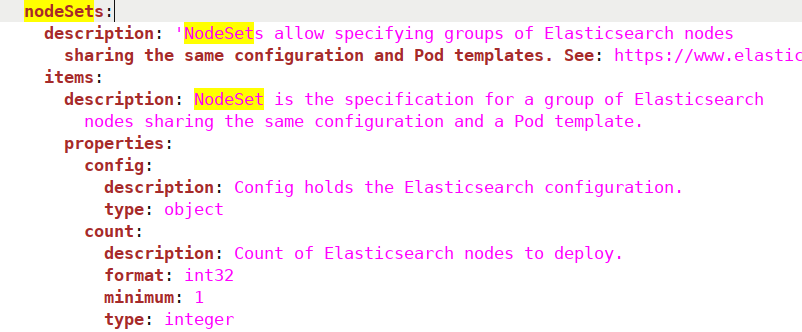
As mentioned earlier, we can find a lot of the Elasticsearch-specific objects defined in the “all-in-one.yaml” file we used to import Custom Resource Definitions. For example, if we would open the file and search for “nodeSets“, we would see the following:
This will take a while, but we can verify progress by looking at the resources available. Initially, the status for our Pod will display “Init:0/1”.
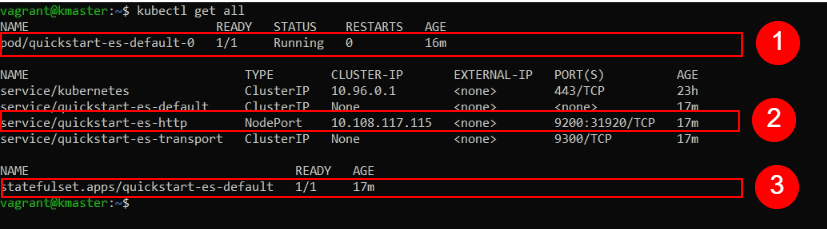
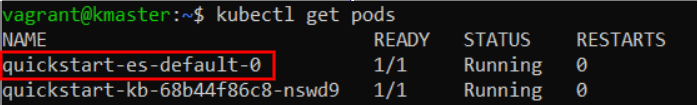
kubectl get all
When the Pod containing our Elasticsearch node is finally created, we should notice in the output of this command that “pod/quickstart-es-default-0” has availability of “1/1” under READY and a STATUS of “Running“.
Link to image file
Now we’re set to continue.
Retrieving a Password from Kubernetes Secrets
First, we’ll need to authenticate our cURL requests to Elasticsearch with a username and password. Storing this password in the Pods, Containers, or other parts of the filesystem would not be secure, as, potentially, anyone and anything could freely read them.
Kubernetes has a special location where it can store sensitive data such as passwords, keys or tokens, called Secrets.
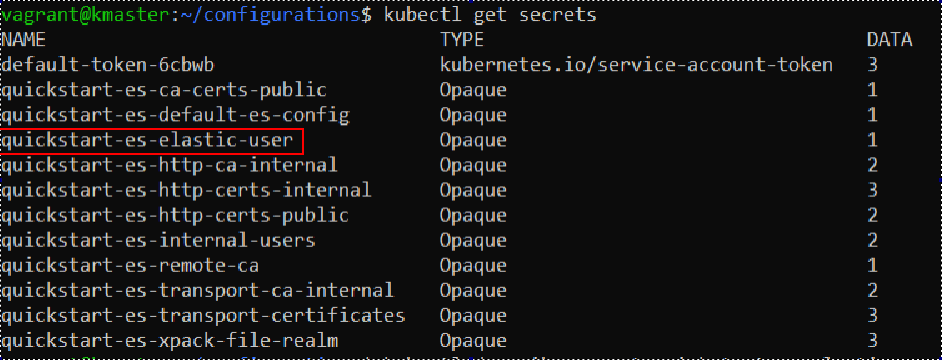
To list all secrets protected by Kubernetes, we use the following command:
kubectl get secrets
In our case, the output should look something like this:
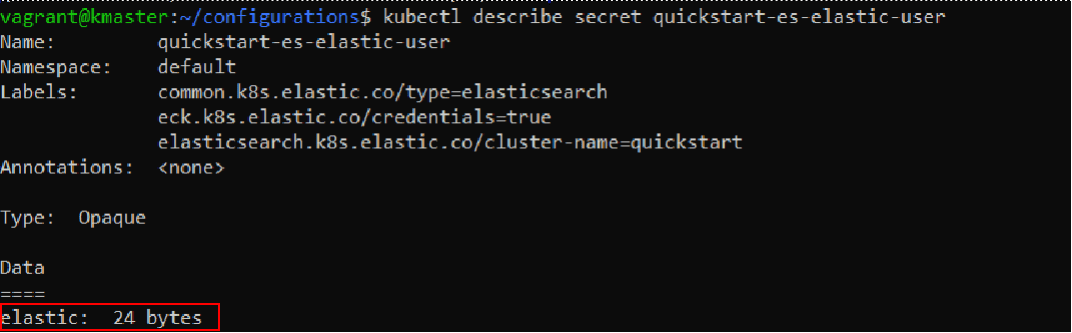
We will need the “quickstart-es-elastic-user” secret. With the following command we can examine information about the secret:
Let’s extract the password stored here and save it to a variable called “PASSWORD”.
PASSWORD=$(kubectl get secret quickstart-es-elastic-user -o go-template='{{.data.elastic | base64decode}}')
To display the password, we can type:
echo $PASSWORD
Making the Elasticsearch Node Publicly Accessible
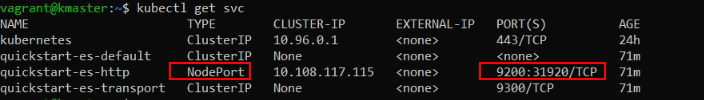
Let’s list the currently available Kubernetes services:
kubectl get svc
Here’s an example output we will analyze:
A lot of IP addresses we’ll see in Kubernetes are so-called internal IP addresses. This means that they can only be accessed from within the same network. In our case, this would imply that we can connect to certain things only from our Master Node or the other two Worker Nodes, but not from other computers outside this Kubernetes cluster.
When we will run a Kubernetes cluster on physical servers or virtual private servers, these will all have external IP addresses that can be accessed by any device connected to the Internet. By using the previously discussed NodePort service, we open up a certain port on all Nodes. This way, any computer connected to the Internet can get access to services offered by our pods, by sending requests to the external IP address of a Kubernetes node and the specified NodePort number.
Alternatively, instead of NodePort, we can also use a LoadBalancer type of service to make something externally available.
In our case, we can see that all incoming requests, on the external IP of the Node, to port 31920/TCP will be routed to port 9200 on the Pods.
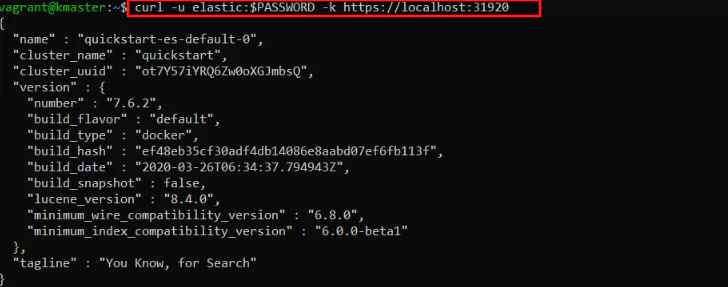
We extracted the necessary password earlier, so now we can fire a cURL request to our Elasticsearch node:
Since we made this request from the “kmaster” Node, it still goes through Kubernetes’ internal network.
So to see if our service is indeed available from outside this network, we can do the following.
First, we need to find out the external IP address for the Node we’ll use. We can list all external IPs of all Nodes with this command:
kubectl get nodes --selector=kubernetes.io/role!=master -o jsonpath={.items[*].status.addresses[?(@.type=="InternalIP")].address} ; echo
Alternatively, we can use another method:
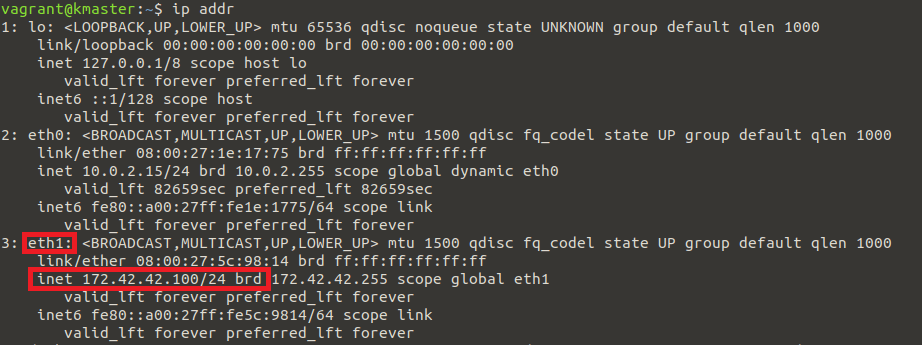
ip addr
And look for the IP address displayed under “eth1”, like in the following:
However, this method requires closer attention, as the external IP may become associated with a different adapter name in the future. For example, the identifier might start with the string “enp”.
In our case, the IP we extracted here belongs to the VirtualBox machine that is running this specific Node. If the Kubernetes Node would run on a server instead, it would be the publicly accessible IP address of that server.
Now, let’s assume for a moment that the external IP of our node is 172.42.42.100. If you want to run this exercise, you’ll need to replace this with the actual IP of your own Node, in case it differs.
You will also need to replace the password, with the one that was generated in your case.
Let’s display the password again:
echo $PASSWORD
Select and copy the output you get since we’ll need to paste it in another window.
In our example, the output is 3sun1I8PB41X2C8z91Xe7DGy, but you shouldn’t use this. We brought attention to this value just so you can see where your password should be placed in the next command.
Next, minimize your current SSH session or terminal window, don’t close it, as you’ll soon return to that session.
Windows: If you’re running Windows, open up a Command Prompt and execute the next command.
Linux/Mac: On Linux or Mac, you would need to open up a new terminal window instead.
Windows 10 and some versions of Linux have the cURL utility installed by default. If it’s not available out of the box for you, you will have to install it before running the next command.
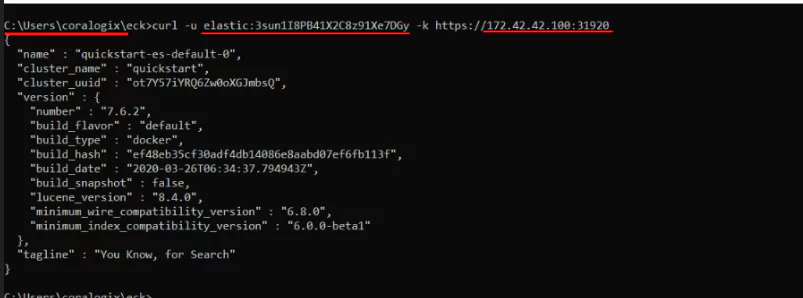
Remember to replace highlighted values with what applies to your situation:
And there it is, you just accessed your Elasticsearch Node that’s running in a Kubernetes Pod by sending a request to the Kubernetes Node’s external IP address.
Now let’s close the Command Prompt or the Terminal for Mac users and return to the previously minimized SSH session, where we’re logged in to the kmaster Node.
Setting Up Kibana
Creating the Kibana Pod
As we did with our Elasticsearch node, we’ll declare to Kubernetes what state we want to achieve, and it will take the necessary steps to bring up and maintain a Kibana instance.
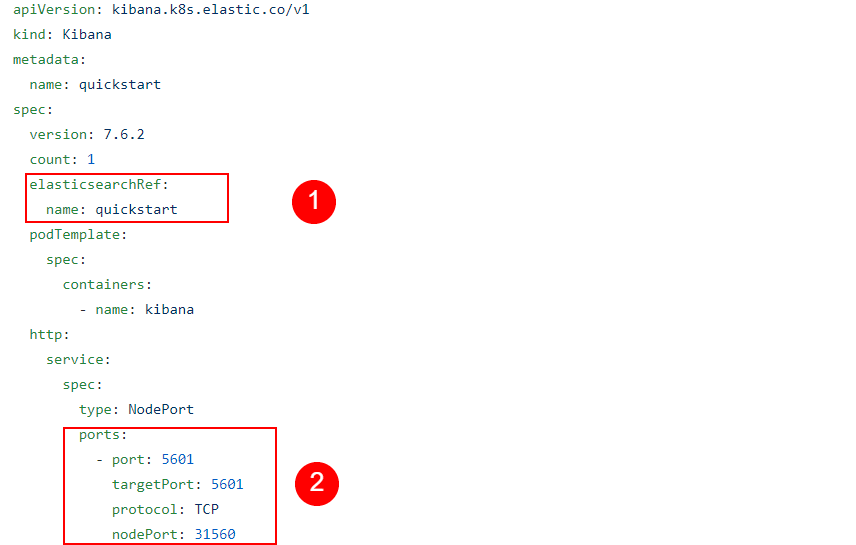
Let’s look at a few key points in the YAML file that we’ll pass to the kubectl command:
The elasticsearchRef entry is important, as it points Kibana to the Elasticsearch cluster it should connect to.
In the service and ports sections, we can see it’s similar to what we had with the Elasticsearch Node, making it available through a NodePort service on an external IP address.
Now let’s apply these specifications from our YAML file:
It will take a while for Kubernetes to create the necessary structures. We can check its progress with:
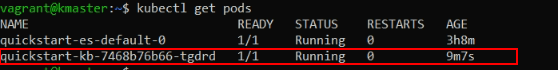
kubectl get pods
The name of the Kibana pod will start with the string “quickstart-kb-“. If we don’t see “1/1” under READY and a STATUS of Running, for this pod, we should wait a little more and repeat the command until we notice that it’s ready.
Accessing the Kibana Web User Interface
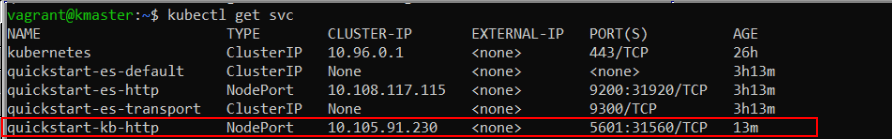
Let’s list the services again to extract the port number where we can access Kibana.
kubectl get svc
We can see the externally accessible port is 31560. We also need the IP address of a Kubernetes Node.
The procedure is the same as the one we followed before and the external IPs should also be the same:
kubectl get nodes --selector=kubernetes.io/role!=master -o jsonpath={.items[*].status.addresses[?(@.type=="InternalIP")].address} ; echo
Finally, we can now open up a web browser, where, in the URL address bar we type “https://” followed by the IP address and the port number. The IP and port should be separated by a colon (:) sign.
Here’s an example of how this could look like:
https://172.42.42.100:31560
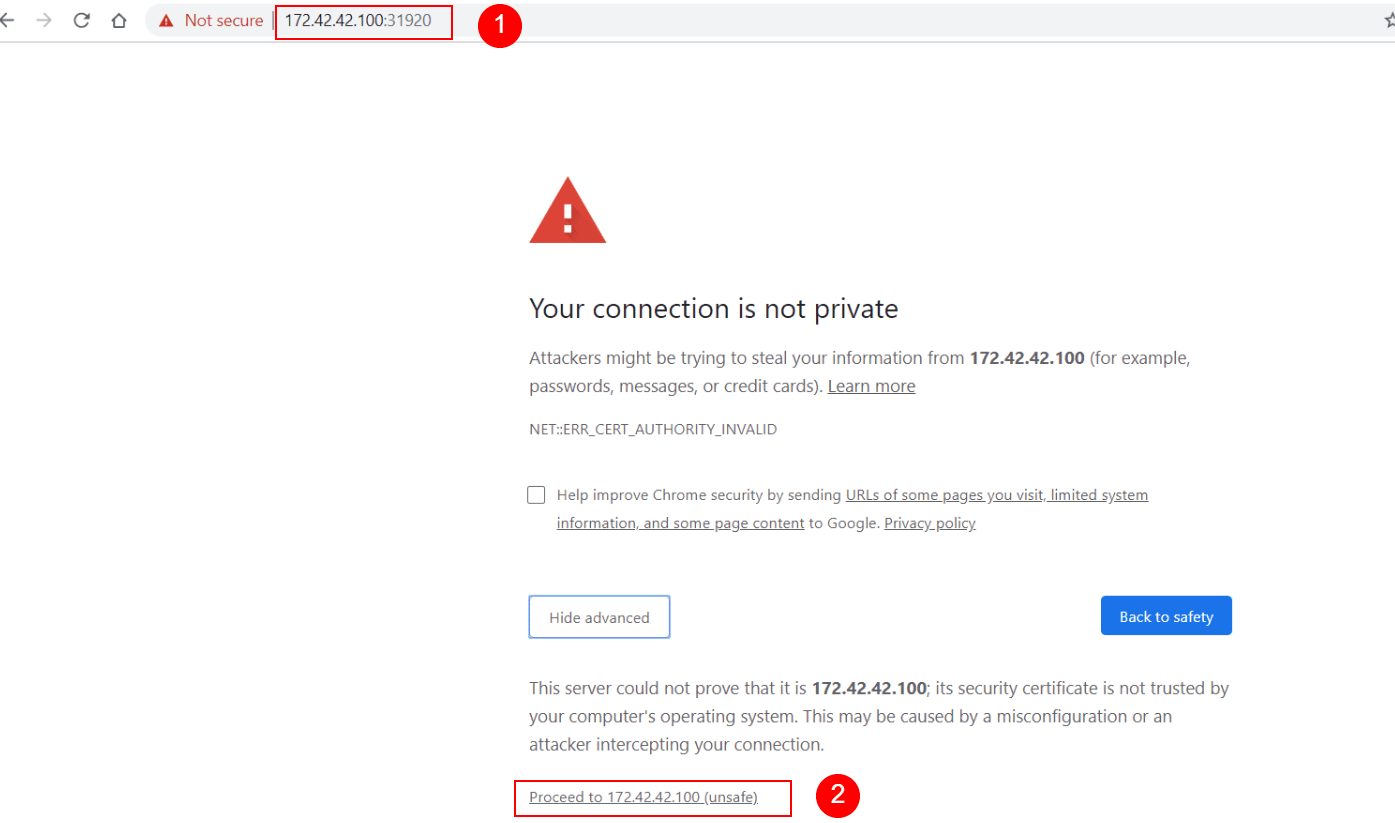
Since Kibana currently uses a self-signed SSL/TLS security certificate, not validated by a certificate authority, the browser will automatically refuse to open the web page.
To continue, we need to follow the steps specific to each browser. For example, in Chrome, we would click on “Advanced” and then at the bottom of the page, click on “Proceed to 172.42.42.100 (unsafe)“.
On production systems, you should use valid SSL/TLS certificates, signed by a proper certificate authority. The Elasticsearch documentation has instructions about how we can import our own certificates when we need to.
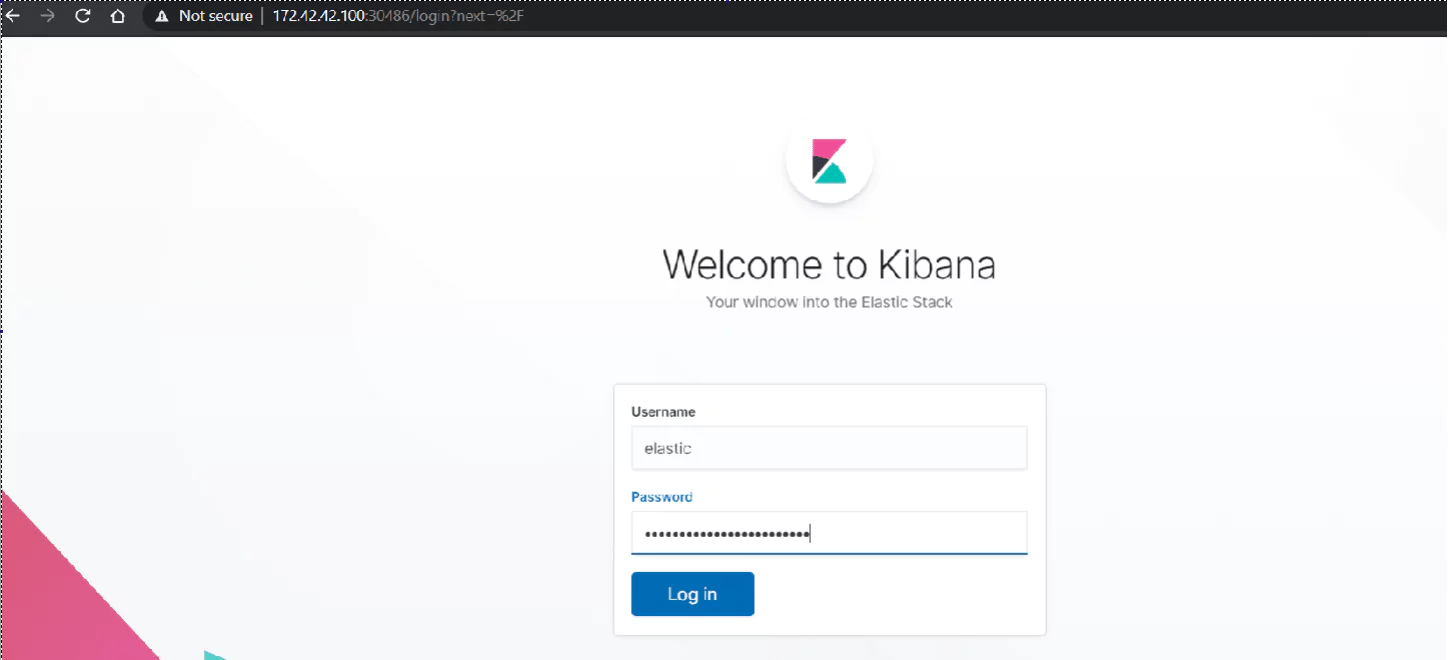
Finally, the Kibana dashboard appears:
Under username, we enter “elastic” and the password is the same one we retrieved in the $PASSWORD variable. If we need to display it again, we can go back to our SSH session on the kmaster Node and enter the command:
echo $PASSWORD
Inspecting Pod Logs
Now let’s list our Pods again:
kubectl get pods
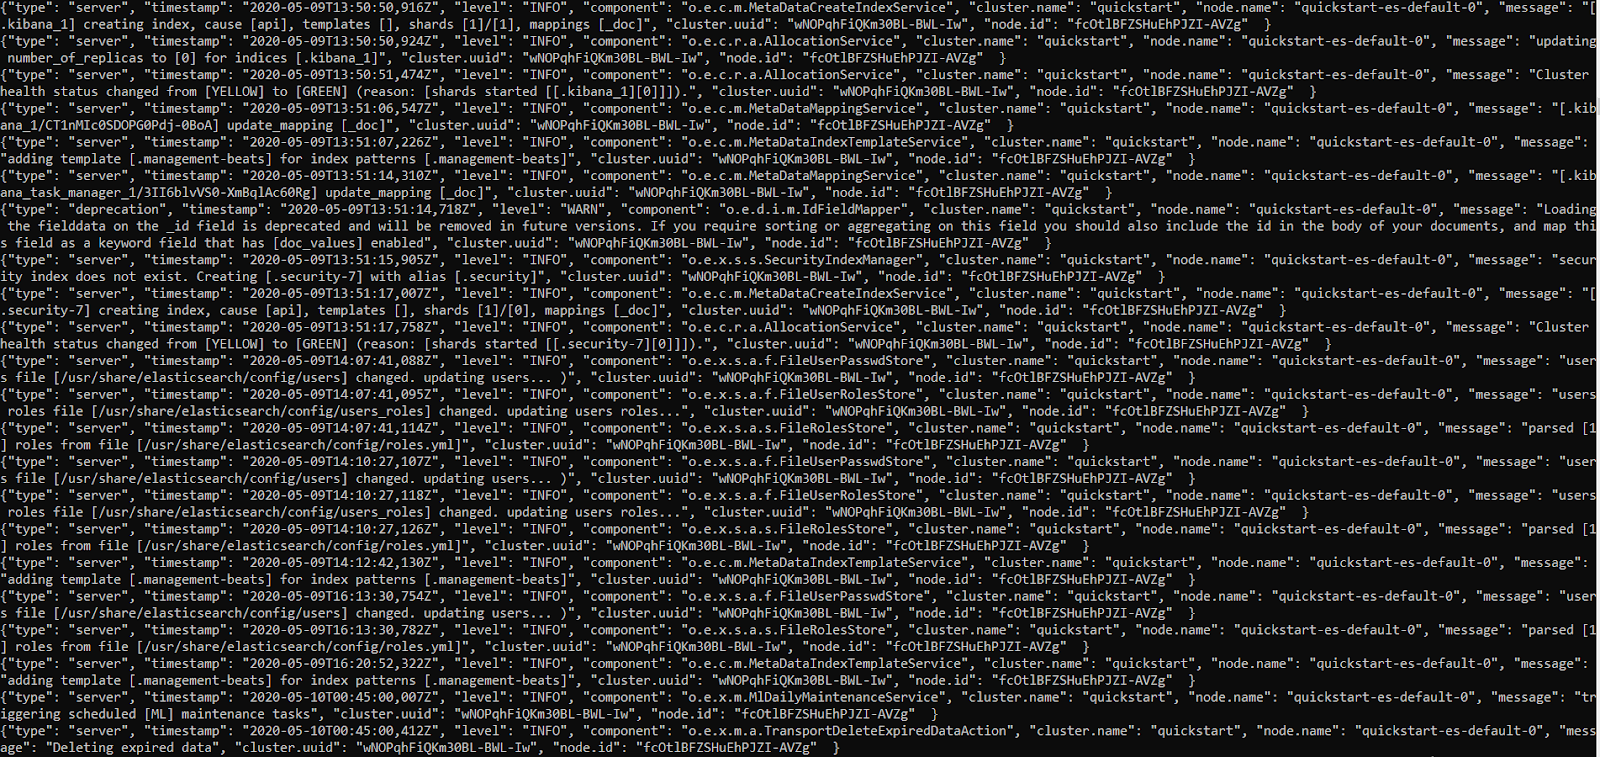
By copying and pasting the pod name to the next command, we can look at the logs Kubernetes keeps for this resource. We also use the “-f” switch here to “follow” our log, that is, watch it as it’s generated.
kubectl logs quickstart-es-default-0 -f
Whenever we open logs in this “follow” mode, we’ll need to press CTRL+C when we want to exit.
Installing The Kubernetes Dashboard
So far, we’ve relied on the command line to analyze and control various things in our Kubernetes infrastructure. But just like Kibana can make some things easier to visualize and analyze, so can the Kubernetes Web User Interface.
Important Note: Please note that the YAML file used here is meant just as an ad-hoc, simple solution to quickly add Kubernetes Web UI to the cluster. Otherwise said, we used a modified config that gives you instant results, so you can experiment freely and effortlessly. But while this is good for testing purposes, it is NOT SAFE for a production system as it will make the Web UI publicly accessible and won’t enforce proper login security. If you intend to ever add this to a production system, follow the steps in the official Kubernetes Web UI documentation.
Let’s pass the next YAML file to Kubernetes, which will do the heavy lifting to create and configure all of the components necessary to create a Kubernetes Dashboard:
As usual, we can check with the next command if the job is done:
kubectl get pods
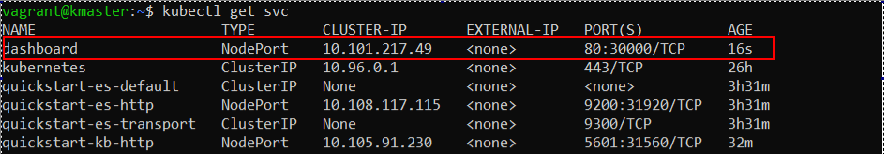
Once the Dashboard Pod is running, let’s list the Services, to find the port we need to use to connect to it:
kubectl get svc
In our example output, we see that Dashboard is made available at port 30000.
Just like in the previous sections, we use the Kubernetes Node’s external IP address, and port, to connect to the Service. Open up a browser and type the following in the address bar, replacing the IP address and port, if necessary, with your actual values:
https://172.42.42.100:30000
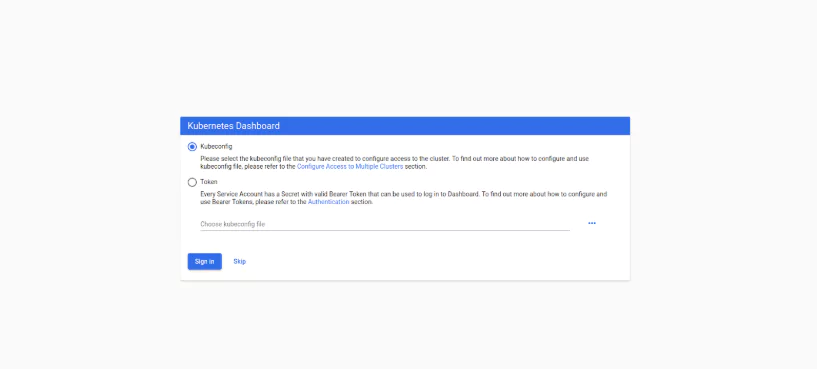
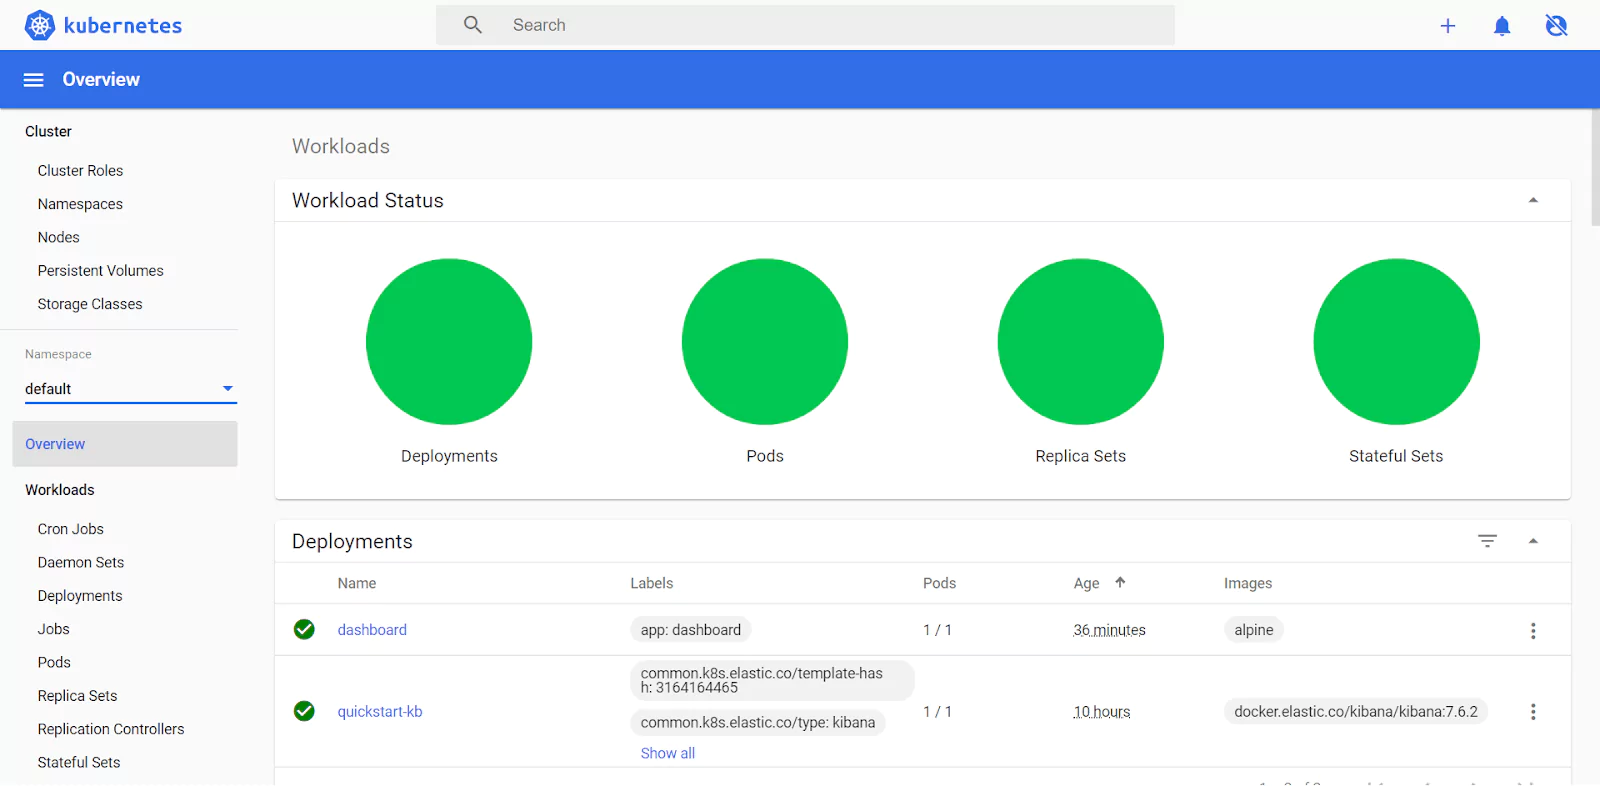
The following will appear:
Since we’re just testing functionality here, we don’t need to configure anything and we can just click “Skip” and then we’ll be greeted with the Overview page in the Kubernetes Web UI.
Installing Plugins to an Elasticsearch Node Managed by Kubernetes
We might encounter a need for plugins to expand Elasticsearch’s basic functionality. Here, we will assume we need the S3 plugin to access Amazon’s object storage service.
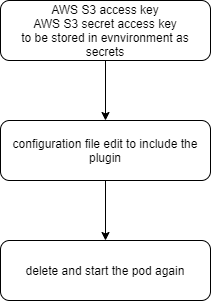
The process we’ll go through looks like this:
Storing S3 Authentication Keys as Kubernetes Secrets
We previously explored how to extract values from Kubernetes’ secure Secret vault. Now we’ll learn how to add sensitive data here.
To make sure that only authorized parties can access them, S3 buckets will ask for two keys. We will use the following fictional values.
AWS_ACCESS_KEY=123456
AWS_SECRET_ACCESS_KEY=123456789
If, in the future, you want to adapt this exercise for a real-world scenario, you would just copy the key values from your Amazon Dashboard and paste them in the next two commands.
To add these keys, with their associated values, to Kubernetes Secrets, we would enter the following commands:
Each command will output a message, informing the user that the secret has been created.
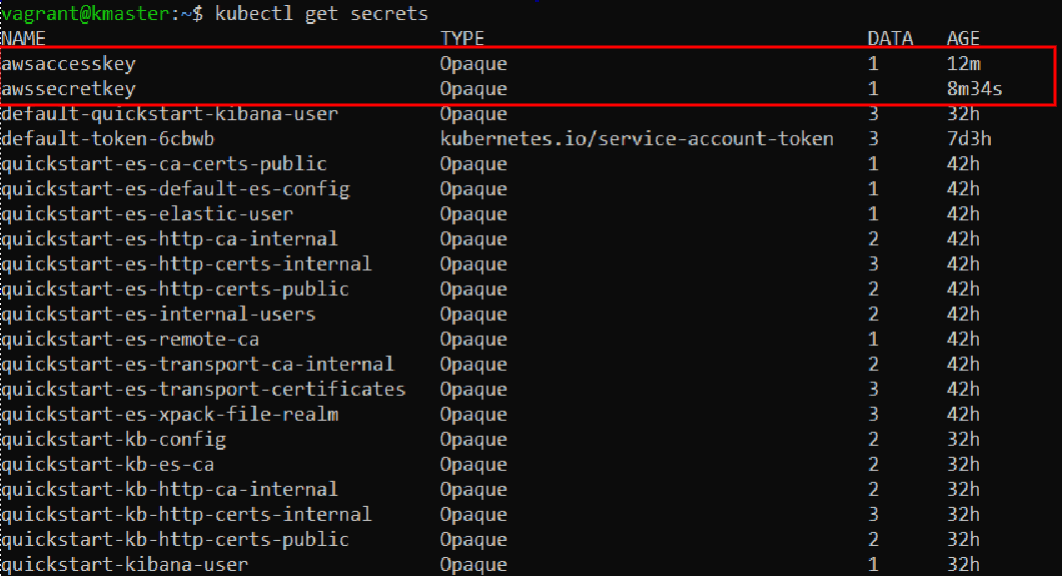
Let’s list the secrets we have available now:
kubectl get secrets
Notice our newly added entries:
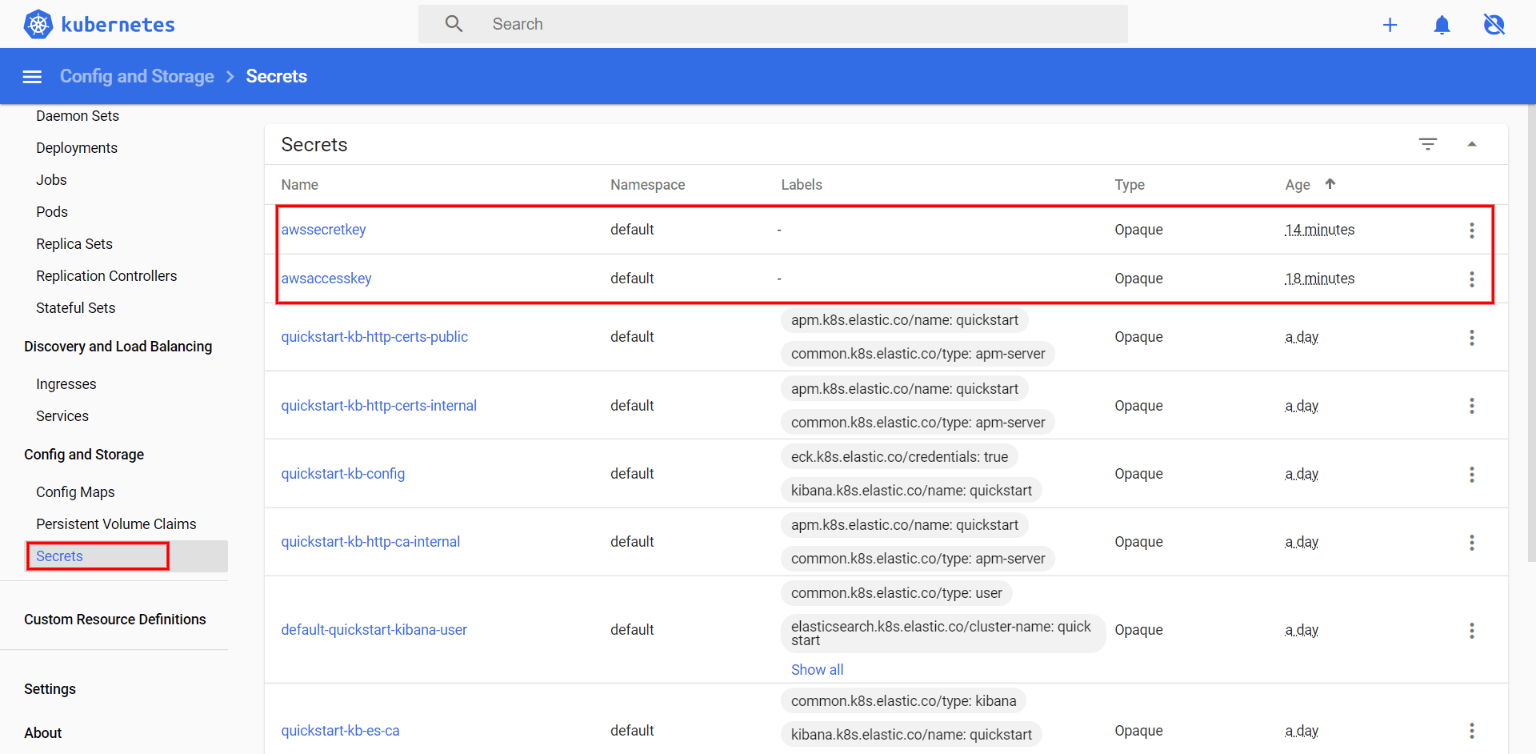
We can also visualize these in the Kubernetes Dashboard:
Installing the Elasticsearch S3 Plugin
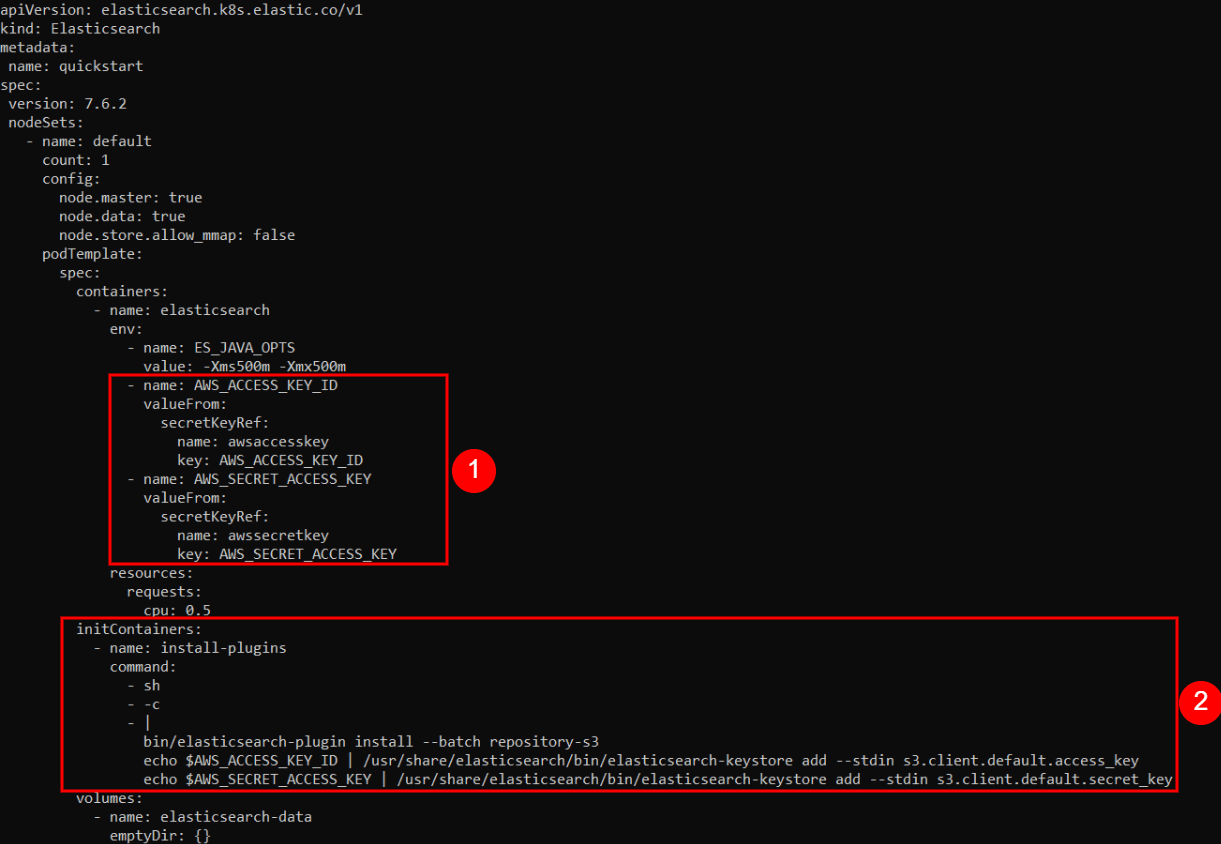
When we created our Elasticsearch node, we described the desired state in a YAML file and passed it to Kubernetes through a kubectl command. To install the plugin, we simply describe a new, changed state, in another YAML file, and pass it once again to Kubernetes.
The modifications to our original YAML config are highlighted here:
Here, we create environment variables named AWS_ACCESS_KEY_ID and AWS_SECRET_ACCESS_KEY, inside the Container. We assign them the values of our secret keys, extracted from the Kubernetes Secrets vault.
Here, we simply instruct Kubernetes to execute certain commands when it initializes the Containers. The commands will first install the S3 plugin and then configure it with the proper secret key values, passed along through the $AWS_ACCESS_KEY_ID and $AWS_SECRET_ACCESS_KEY environment variables.
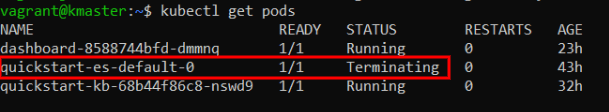
To get started, let’s first delete the Elasticsearch node from our Kubernetes cluster, by removing its associated YAML specification:
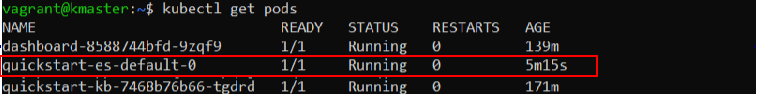
After a while, we can check the status of the Pods again to see if Kubernetes finished setting up the new configuration:
kubectl get pods
As usual, a STATUS of “Running” means the job is complete:
Verifying Plugin Installation
Since we’ve created a new Elasticsearch container, this will use a newly generated password to authenticate cURL requests. Let’s retrieve it, once again, and store it in the PASSWORD variable:
PASSWORD=$(kubectl get secret quickstart-es-elastic-user -o go-template='{{.data.elastic | base64decode}}')
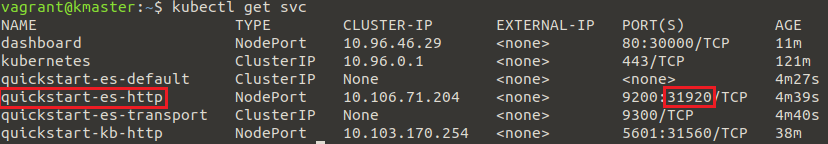
It’s useful to list the Services again, to check which port we’ll need to use in order to send cURL requests to the Elasticsearch Node:
kubectl get svc
Take note of the port displayed for “quickstart-es-http” since we’ll use it in the next command:
Finally, we can send a cURL request to Elasticsearch to display the plugins it is using:
More and more employers are looking for people experienced in building and running Kubernetes-based systems, so it’s a great time to start learning how to take advantage of the new technology. Elasticsearch consists of multiple nodes working together, and Kubernetes can automate the process of creating these nodes and taking care of the infrastructure for us, so running ELK on Kubernetes can be a good options in many scenarios.
We’ll start this with an overview of Kubernetes and how it works behind the scenes. Then, armed with that knowledge, we’ll try some practical hands-on exercises to get our hands dirty and see how we can build and run Elastic Cloud on Kubernetes, or ECK for short.
What we’ll cover:
Fundamental Kubernetes concepts
Use Vagrant to create a Kubernetes cluster with one master node and two worker nodes
Create Elasticsearch clusters on Kubernetes
Extract a password from Kubernetes secrets
Publicly expose services running on Kubernetes Pods to the Internet, when needed.
How to install Kibana
Inspect Pod logs
Install the Kubernetes Web UI (i.e. Dashboard)
Install plugins on an Elasticsearch node running in a Kubernetes container
System Requirements: Before proceeding further, we recommend a system with at least 12GB of RAM, 8 CPU cores, and a fast internet connection. If your computer doesn’t meet the requirements, just use a VPS (virtual private server) provider. Google Cloud is one service that meets the requirements, as it supports nested virtualization on Ubuntu (VirtualBox works on their servers).
There’s a trend, lately, to run everything in isolated little boxes, either virtual machines or containers. There are many reasons for doing this so we won’t get into it here, but if you’re interested, you can read Google’s motivation for using containers.
Let’s just say that containers make some aspects easier for us, especially in large-scale operations.
Managing one, two, or three containers is no big deal and we can usually do it manually. But when we have to deal with tens or hundreds of them, we need some help.
This is where Kubernetes comes in.
What is Kubernetes?
By way of analogy, if containers are the workers in a company, then Kubernetes would be the manager, supervising everything that’s happening and taking appropriate measures to keep everything running smoothly.
After we define a plan of action, Kubernetes does the heavy lifting to fulfill our requirements.
Examples of what you can do with K8s:
Launch hundreds of containers, or whatever number needed with much less effort
Set up ways that containers can communicate with each other (i.e. networking)
Automatically scale up or down. When demand is high, create more containers, even on multiple physical servers, so that the stress of the high demand is distributed across multiple machines, making it easier to process. As soon as demand goes down, it can remove unneeded containers, as well as the nodes that were hosting them (if they’re sitting idle).
If there are a ton of requests coming in, Kubernetes can load balance and evenly distribute the workload to multiple containers and nodes.
Containers are carefully monitored with health checks, according to user-defined specifications. If one stops working, Kubernetes can restart it, create a new one as a replacement, or kill it entirely. If a physical machine running containers fails, those containers can be moved to another physical machine that’s still working correctly.
Kubernetes Cluster Structure
Let’s analyze the structure from the top down to get a good handle on things before diving into the hands-on section.
First, Kubernetes must run on computers of some kind. It might end up being on dedicated servers, virtual private servers, or virtual machines hosted by a capable server.
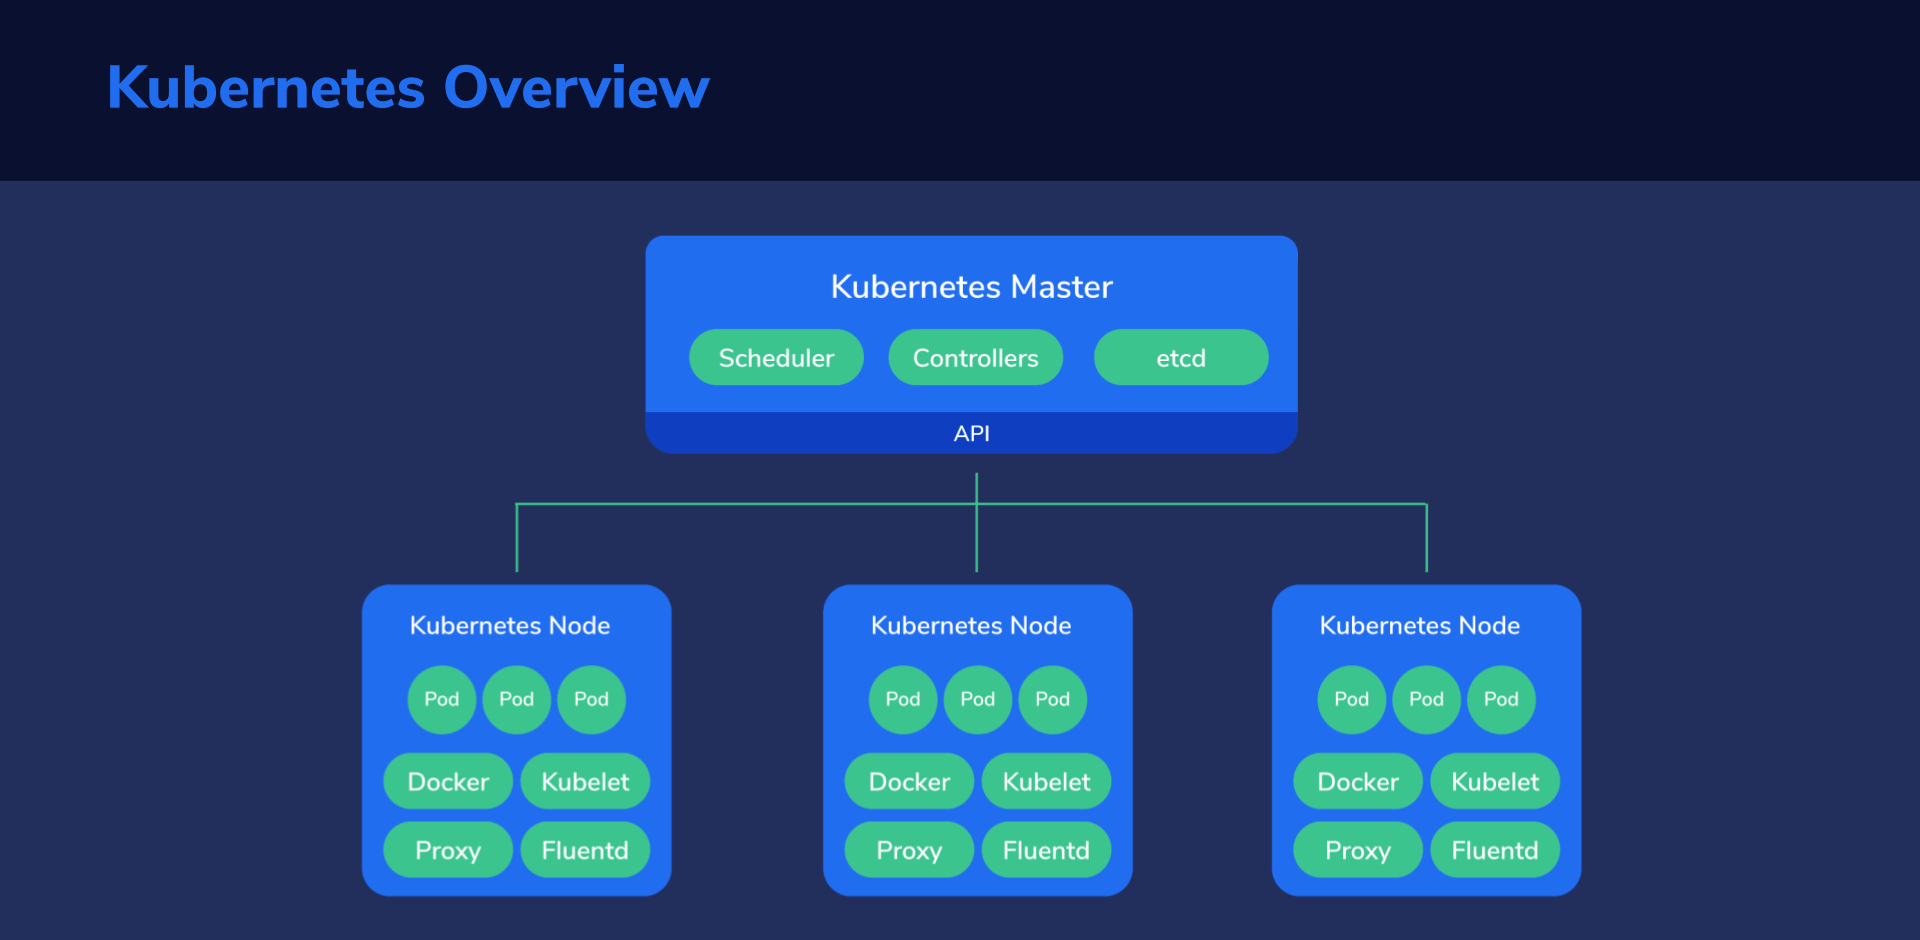
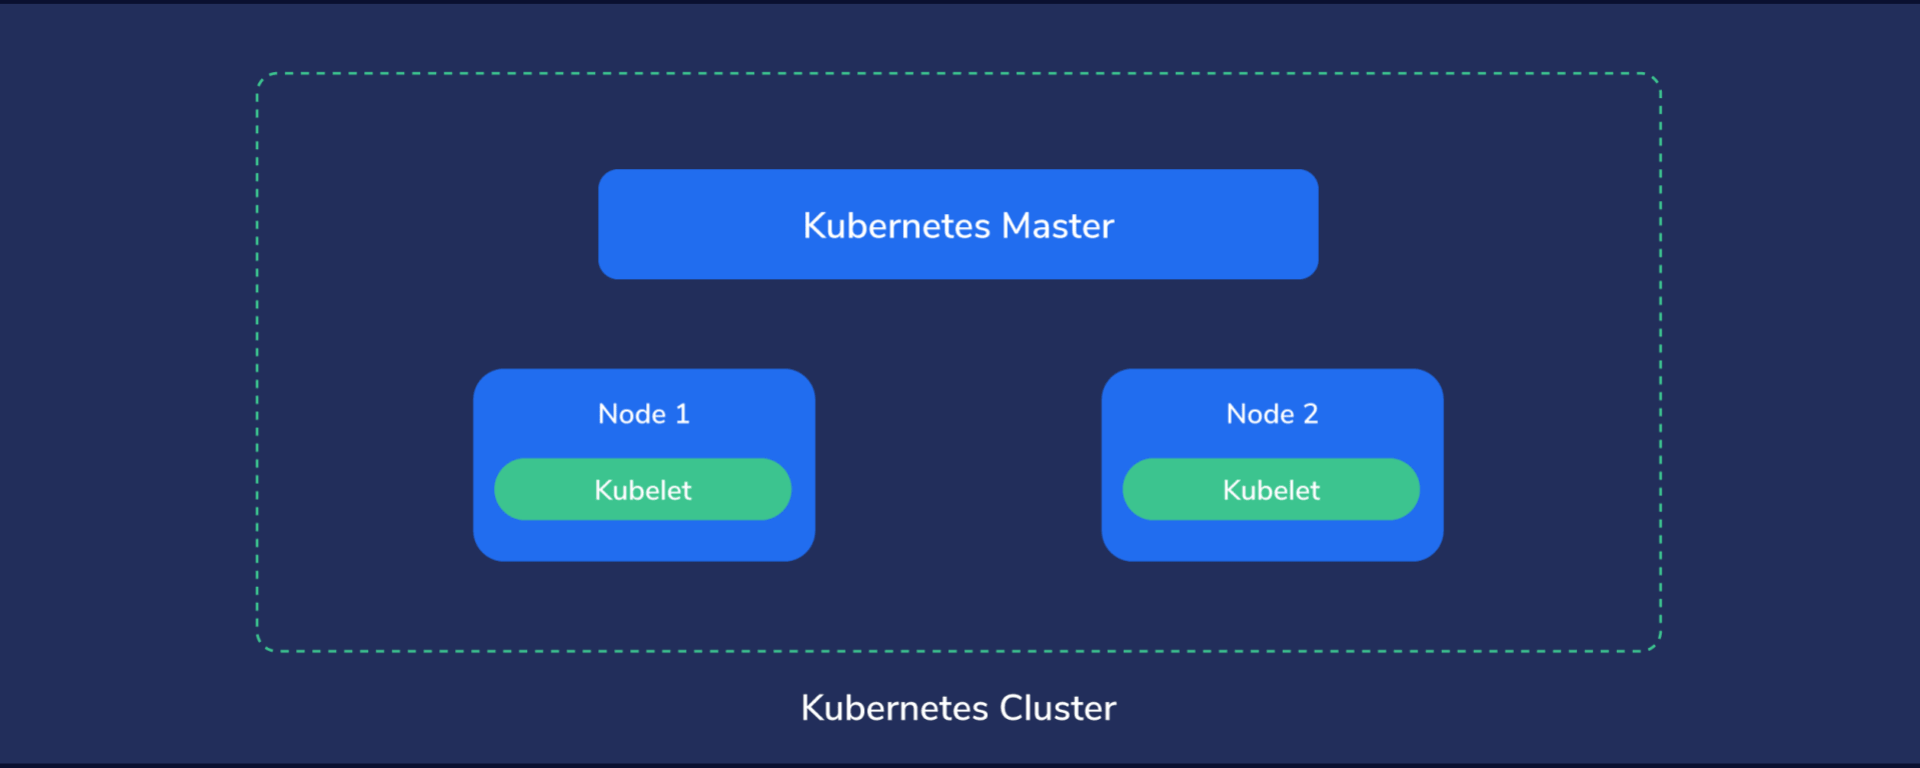
Multiple such machines running Kubernetes components form a Kubernetes cluster, which is considered the whole universe of Kubernetes, because everything, from containers to data, to monitoring systems and networking exists here.
In this little universe, there has to be a central point of command, like the “brains” of Kubernetes. We call this the master node. This node assumes control of the other nodes, sometimes also called worker nodes. The master node manages the worker nodes, while these, in turn, run the containers and do the actual work of hosting our applications, services, processing data, and so on.
Master Node
Basically, we’re the master of our master node, and it, in turn, is the master of every other node.
We instruct our master node about what state we want to achieve which then proceeds to take the necessary steps to fulfill our demands.
Simply put, it automates our plan of action and tries to keep the system state within set parameters, at all times.
Nodes (or Worker Nodes)
The Nodes are like the “worker bees” of a Kubernetes cluster and provide the physical resources, such as CPU, storage space, memory, to run our containers.
Basic Kubernetes Concepts
Up until this point, we kept things simple and just peaked at the high-level structure of a Kubernetes cluster. So now let’s zoom in and take a closer look at the internal structure so we better understand what we’re about to get our hands dirty with.
Pods
Pods are like the worker ants of Kubernetes – the smallest units of execution. They are where applications run and do their actual work, processing data. A Pod has its own storage resources, and its own IP address and runs a container, or sometimes, multiple containers grouped together as a single entity.
Services
Pods can appear and disappear at any moment, each time with a different IP address. It would be quite hard to send requests to Pods since they’re basically a moving target. To get around this, we use Kubernetes Services.
A K8s Service is like a front door to a group of Pods. The service gets its own IP address. When a request is sent to this IP address, the service then intelligently redirects it to the appropriate Pod. We can see how this approach provides a fixed location that we can reach. It can also be used as a mechanism for things like load balancing. The service can decide how to evenly distribute all incoming requests to appropriate Pods.
Namespaces
Physical clusters can be divided into multiple virtual clusters, called namespaces. We might use these for a scenario in which two different development teams need access to one Kubernetes cluster.
With separate namespaces, we don’t need to worry if one team screws up the other team’s namespace since they’re logically isolated from one another.
Deployments
In deployments, we describe a state that we want to achieve. Kubernetes then proceeds to work its magic to achieve that state.
Deployments enable:
Quick updates – all Pods can gradually be updated, one-by-one, by the Deployment Controller. This gets rid of having to manually update each Pod. A tedious process no one enjoys.
Maintain the health of our structure – if a Pod crashes or misbehaves, the controller can replace it with a new one that works.
Recover Pods from failing nodes – if a node should go down, the controller can quickly launch working Pods in another, functioning node.
Automatically scale up and down based on the CPU utilization of Pods.
Rollback changes that created issues. We’ve all been there 🙂
Labels and Selectors
First, things like Pods, services, namespaces, volumes, and the like, are called “objects”. We can apply labels to objects. Labels help us by grouping and organizing subsets of these objects that we need to work with.
The way Labels are constructed is with key/value pairs. Consider these examples:
app:nginx
site:example.com
Applied to specific Pods, it can easily help us identify and select those that are running the Nginx web server and are hosting a specific website.
And finally, with a selector, we can match the subset of objects we intend to work with. For example, a selector like
app = nginx
site = example.com
This would match all the Pods running Nginx and hosting “example.com”.
Ingress
In a similar way that Kubernetes Services sit in front of Pods to redirect requests, Ingress sits in front of Services to load balance between different Services using SSL/TLS to encrypt web traffic or using name-based hosting.
Let’s take an example to explain name-based hosting. Say there are two different domain names, for example, “a.example.com” and “b.example.com” pointing to the same ingress IP address. Ingress can be made to route requests coming from “a.example.com” to service A and requests from “b.example.com” to service B.
Stateful Sets
Deployments assume that applications in Kubernetes are stateless, that is, they start and finish their job and can then be terminated at any time – with no state being preserved.
However, we’ll need to deal with Elasticsearch, which needs a stateful approach.
Kubernetes has a mechanism for this called StatefulSets. Pods are assigned persistent identifiers, which makes it possible to do things like:
Preserve access to the same volume, even if the Pod is restarted or moved to another node.
Assign persistent network identifiers, even if Pods are moved to other nodes.
Start Pods in a certain order, which is useful in scenarios where Pod2 depends on Pod1 so, obviously, Pod1 would need to start first, every time.
Rolling updates in a specific order.
Persistent Volumes
A persistent volume is simply storage space that has been made available to the Kubernetes cluster. This storage space can be provided from the local hardware, or from cloud storage solutions.
When a Pod is deleted, its associated volume data is also deleted. As the name suggests, persistent volumes preserve their data, even after a Pod that was using it disappears. Besides keeping data around, it also allows multiple Pods to share the same data.
Before a Pod can use a persistent volume, though, it needs to make a Persistent Volume Claim on it.
Headless Service
We previously saw how a Service sits in front of a group of Pods, acting as a middleman, redirecting incoming requests to a dynamically chosen Pod. But this also hides the Pods from the requester, since it can only “talk” with the Service’s IP address.
If we remove this IP, however, we get what’s called a Headless Service. At that point, the requester could bypass the middle man and communicate directly with one of the Pods. That’s because their IP addresses are now made available to the outside world.
This type of service is often used with Stateful Sets.
Kubectl
Now, we need a way to interact with our entire Kubernetes cluster. The kubectl command allows us to enter commands to get kubectl to do what we need. It then interacts with the Kubernetes API, and all of the other components, to execute our desired actions.
Let’s look at a few simple commands.
For example, to check the cluster information, we’d would enter:
kubectl cluster-info
If we wanted to list all nodes in the cluster, we’d enter:
kubectl get nodes
We’ll take a look at many more examples in our hands-on exercises.
Operators
Some operations can be complex. For example, upgrading an application might require a large number of steps, verifications, and decisions on how to act if something goes wrong. This might be easy to with one installation, but what if we have 1000 to worry about?
In Kubernetes, hundreds, thousands, or more containers might be running at any given point. If we would have to manually do a similar operation on all of them, it’s why we’d want to automate that.
Enter Operators. We can think of them as a sort of “software operators,” replacing the need for human operators. These are written specifically for an application, to help us, as service owners, to automate tasks.
Operators can deploy and run the many containers and applications we need, react to failures and try to recover from them, automatically backup data, and so on. This essentially lets us extend Kubernetes beyond its out-of-the-box capabilities without modifying the actual Kubernetes code.
Custom Resources
Since Kubernetes is modular by design, we can extend the API’s basic functionality. For example, the default installation might not have appropriate mechanisms to deal efficiently with our specific application and needs. By registering a new Custom Resource Definition, we can add the functionality we need, custom-tailored for our specific application. In our exercises, we’ll explore how to add Custom Resource Definitions for various Elasticsearch applications.
Hands-On Exercises
Basic Setup
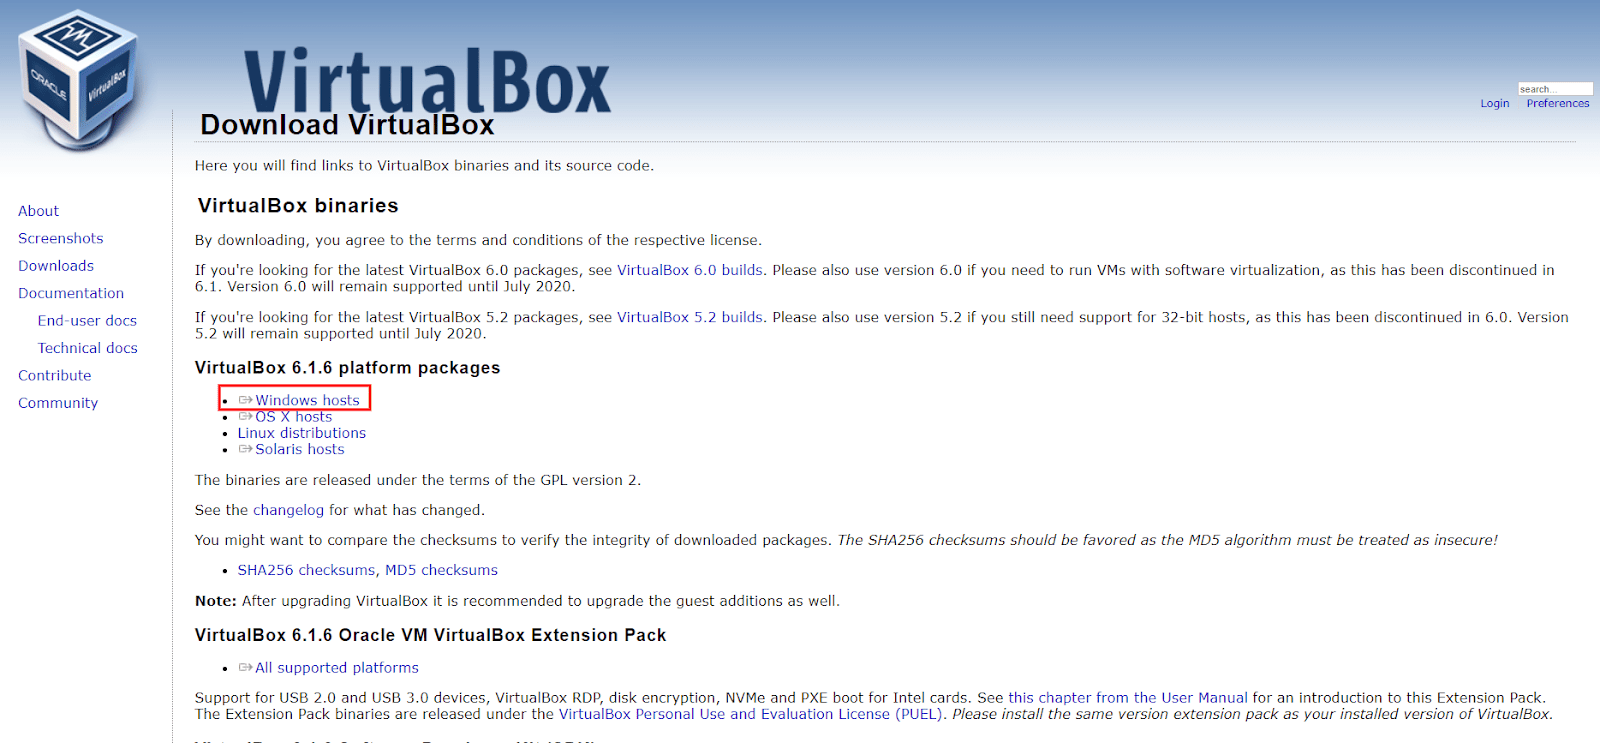
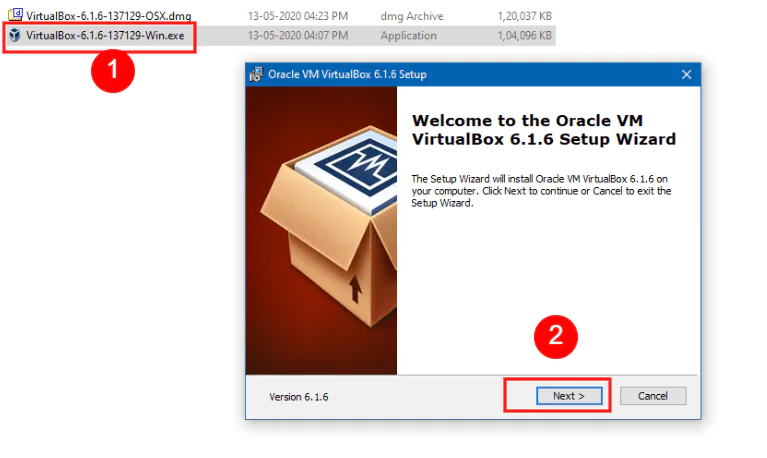
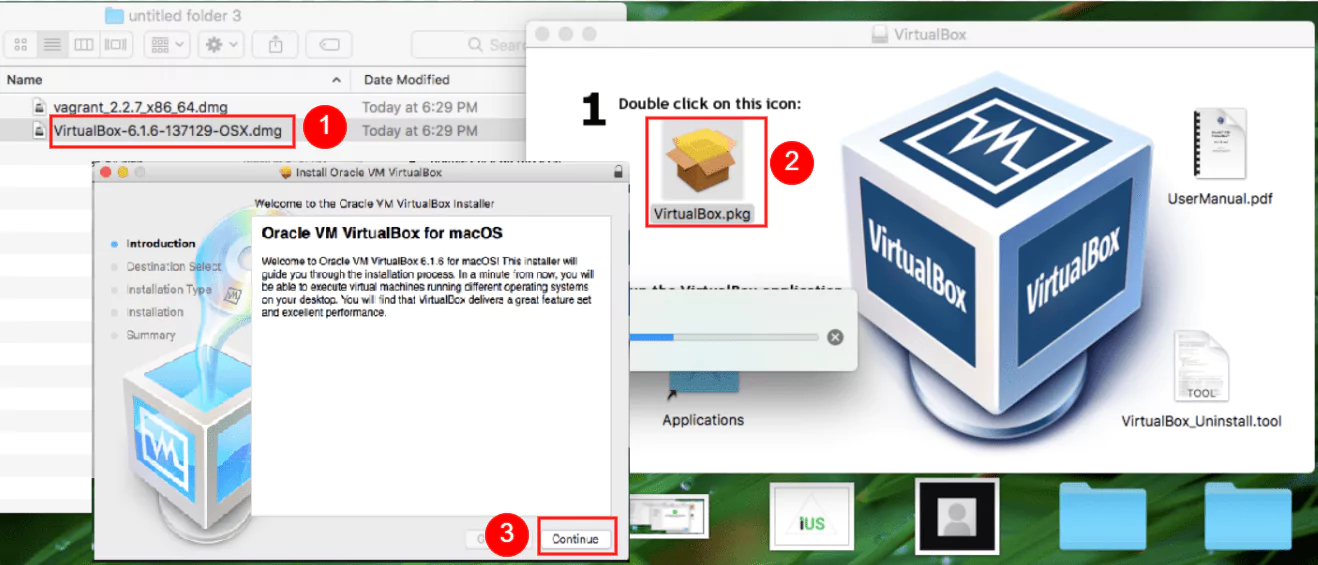
Ok, now the fun begins. We’ll start by creating virtual machines that will be added as nodes to our Cluster. We will use VirtualBox to make it simpler.
We can then open the setup file we just downloaded and click “Next” in the installation wizard, keeping the default options selected.
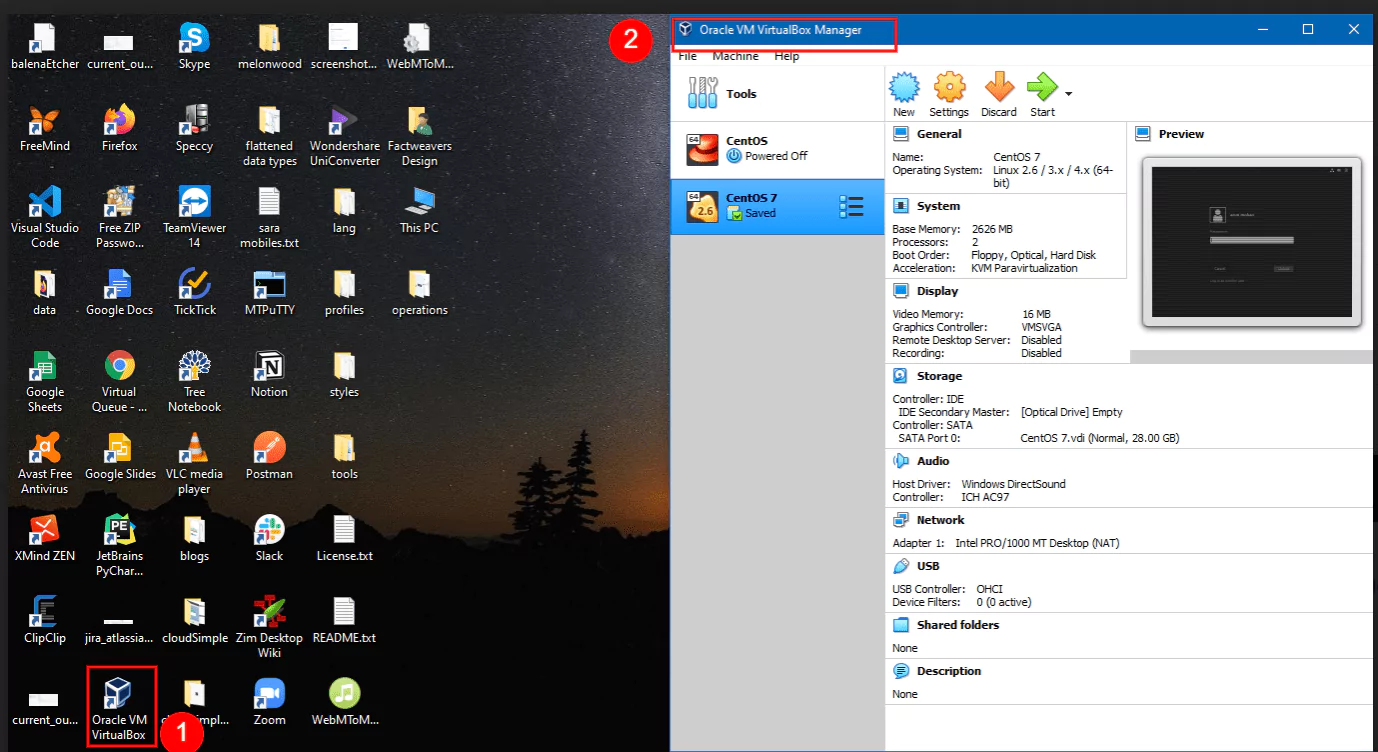
After finishing with the installation, it’s a good idea to check if everything works correctly by opening up VirtualBox, either from the shortcut added to the desktop, or the Start Menu.
If everything seems to be in order, we can close the program and continue with the Vagrant setup.
1.2 Installing VirtualBox on Ubuntu
First, we need to make sure that the Ubuntu Multiverse repository is enabled.
Afterward, we install VirtualBox with the next command:
We can now open the DMG file, execute the PKG inside and run the installer. We keep the default options selected and continue with the steps in the install wizard.
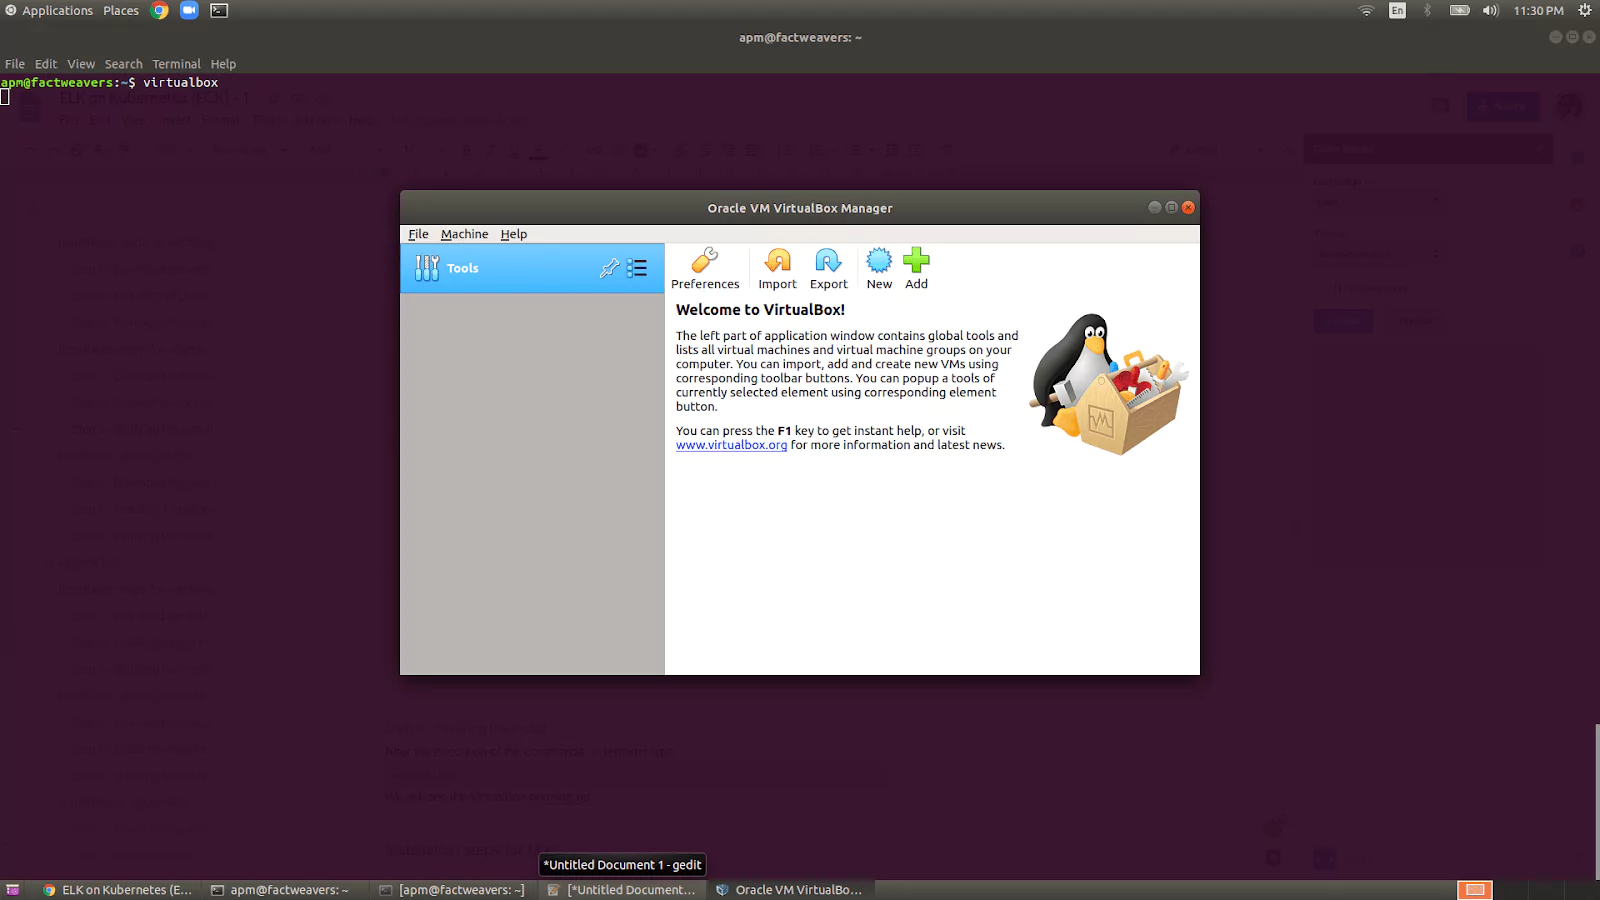
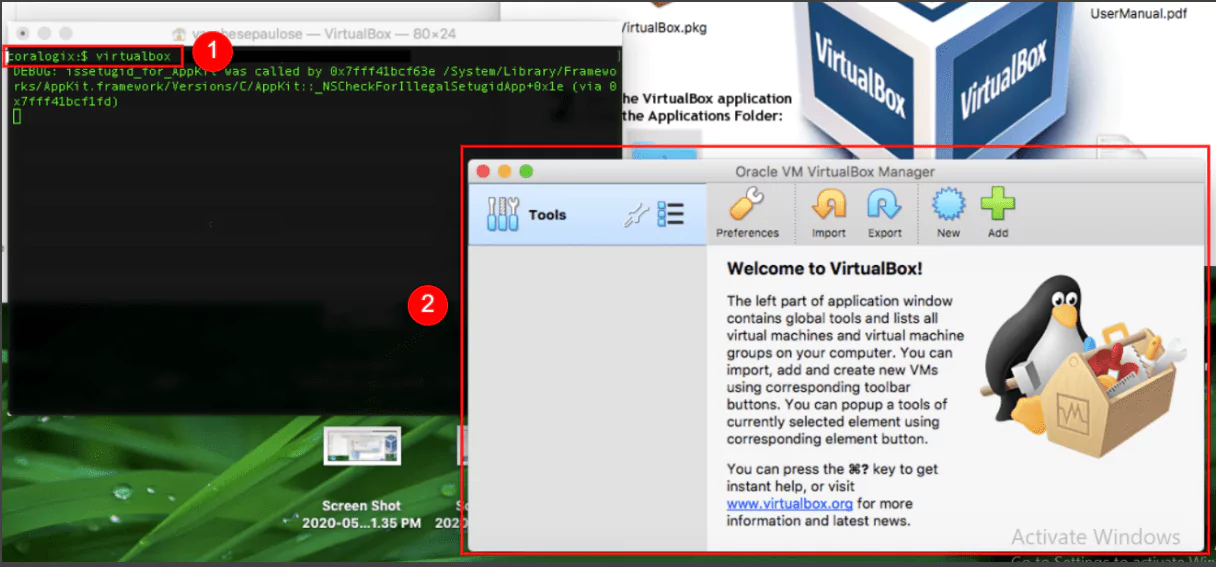
Let’s open up the terminal and check if the install was successful.
virtualbox
If the application opens up and everything seems to be in order, we can continue with the Vagrant setup.
2. Installing Vagrant
It would be pretty time-consuming to set up each virtual machine for use with Kubernetes. But we will use Vagrant, a tool that automates this process, making our work much easier.
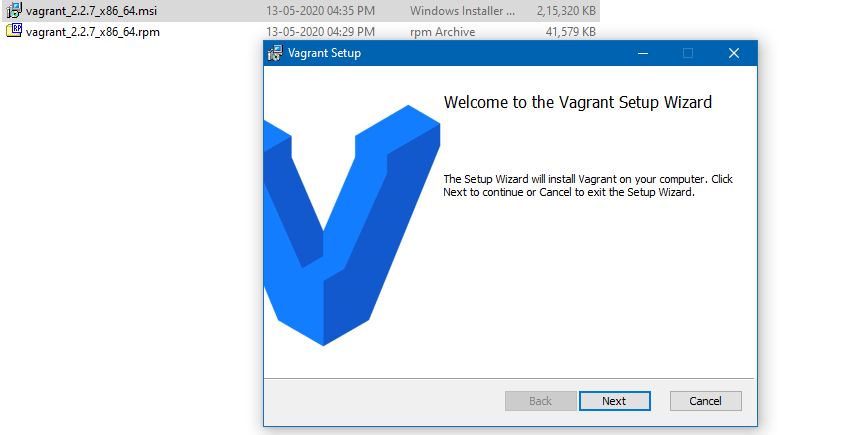
2.1 Installing Vagrant on Windows
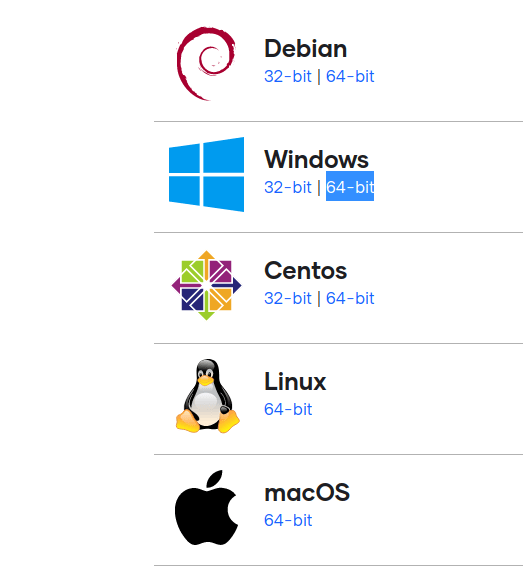
Installing on Windows is easy. We just need to visit the following address, https://www.vagrantup.com/downloads.html, and click on the appropriate link for the Windows platform. Nowadays, it’s almost guaranteed that everyone would need the 64-bit executable. Only download the 32-bit program if you’re certain your machine has an older, 32-bit processor.
Now we just need to follow the steps in the install wizard, keeping the default options selected.
If at the end of the setup you’re prompted to restart your computer, please do so, to make sure all components are configured correctly.
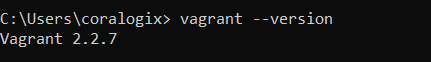
Let’s see if the “vagrant” command is available. Click on the Start Menu, type “cmd” and open up “Command Prompt”. Next, type:
vagrant --version
If the program version is displayed, we can move on to the next section and provision our Kubernetes cluster.
2.2 Installing Vagrant on Ubuntu
First, we need to make sure that the Ubuntu Universe repository is enabled.
If that’s enabled, installing Vagrant is as simple as running the following command:
Finally, let’s double-check that the program was successfully installed, with:
vagrant --version
2.3 Installing Vagrant on macOS
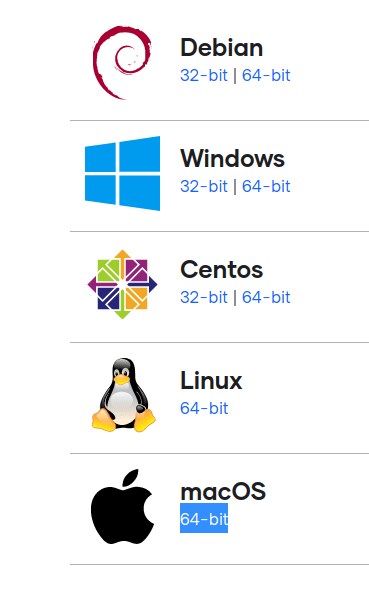
Let’s first download the setup file from https://www.vagrantup.com/downloads.html, which, at the time of this writing, would be found at the bottom of the page, next to the macOS icon.
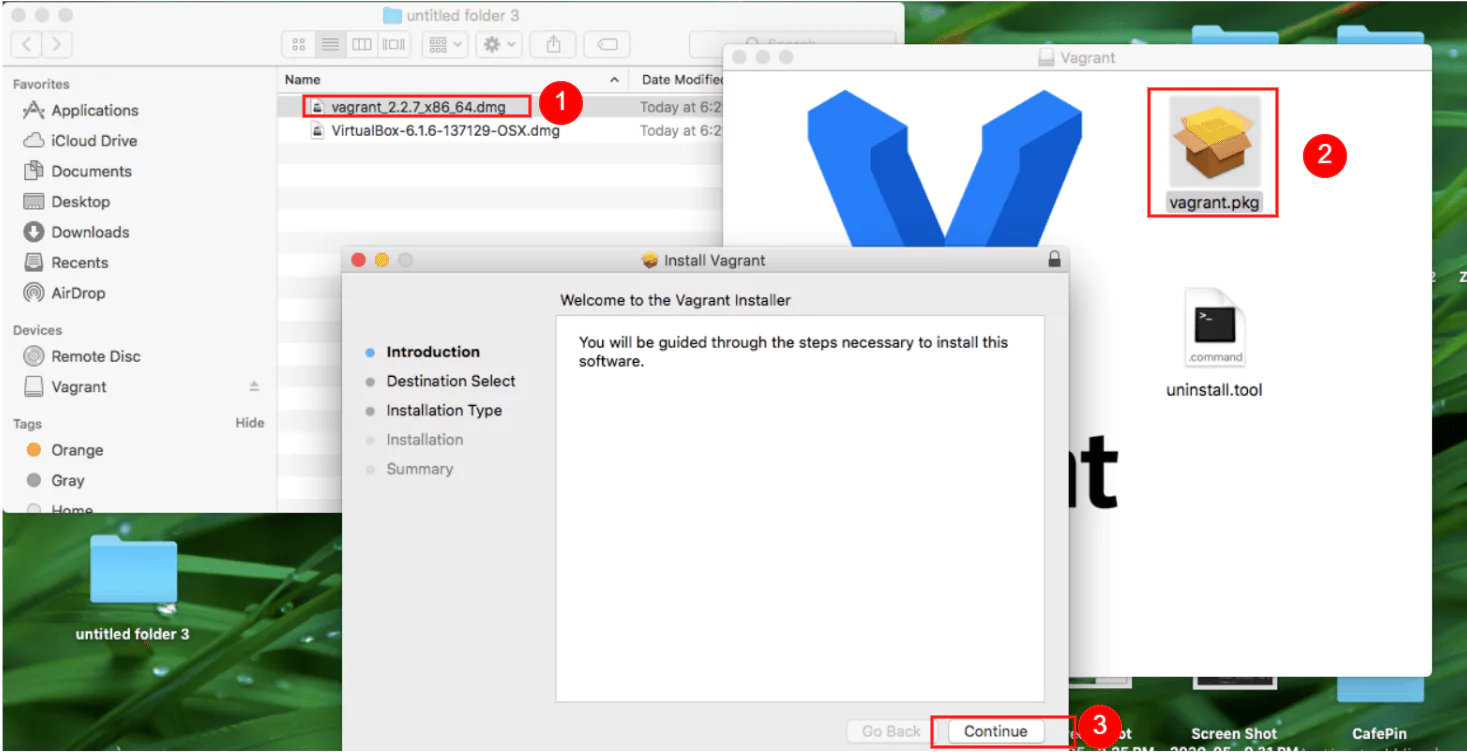
Once the download is finished, let’s open up the DMG file, execute the PKG inside, and go through the steps of the install wizard, leaving the default selections as they are.
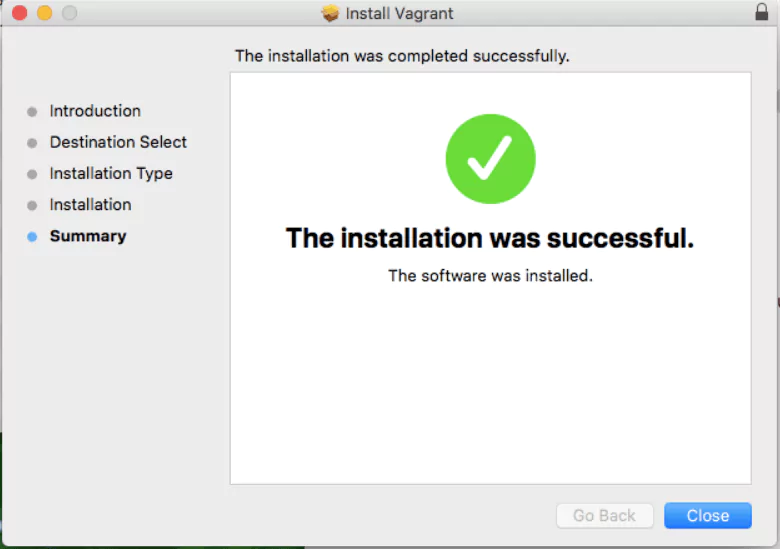
Once the install is complete, we will be presented with this window.
But we can double-check if Vagrant is fully set up by opening up the terminal and typing the next command:
vagrant --version
Provisioning the Kubernetes Cluster
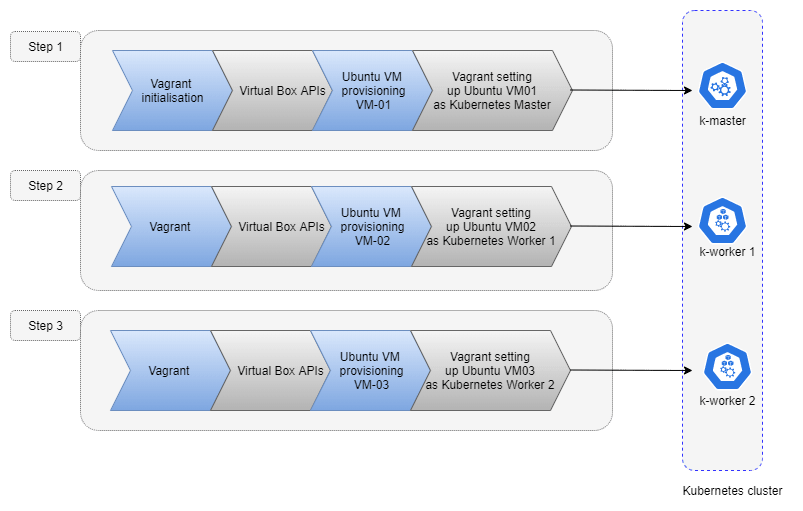
Vagrant will interact with the VirtualBox API to create and set up the required virtual machines for our cluster. Here’s a quick overview of the workflow.
Once Vagrant finishes the job, we will end up with three virtual machines. One machine will be the master node and the other two will be worker nodes.
Next, we have to extract the directory “k8s_ubuntu” from this ZIP file.
Now let’s continue, by entering the directory we just unzipped. You’ll need to adapt the next command to point to the location where you extracted your files.
For example, on Windows, if you extracted the directory to your Desktop, the next command would be “cd Desktopk8s_ubuntu”.
On Linux, if you extracted to your Downloads directory, the command would be “cd Downloads/k8s_ubuntu”.
cd k8s_ubuntu
We’ll need to be “inside” this directory when we run a subsequent “vagrant up” command.
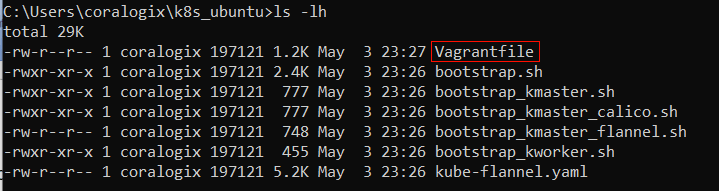
Let’s take a look at the files within. On Windows, enter:
dir
On Linux/macOS, enter:
ls -lh
The output will look something like this:
We can see a file named “Vagrantfile”. This is where the main instructions exist, telling Vagrant how it should provision our virtual machines.
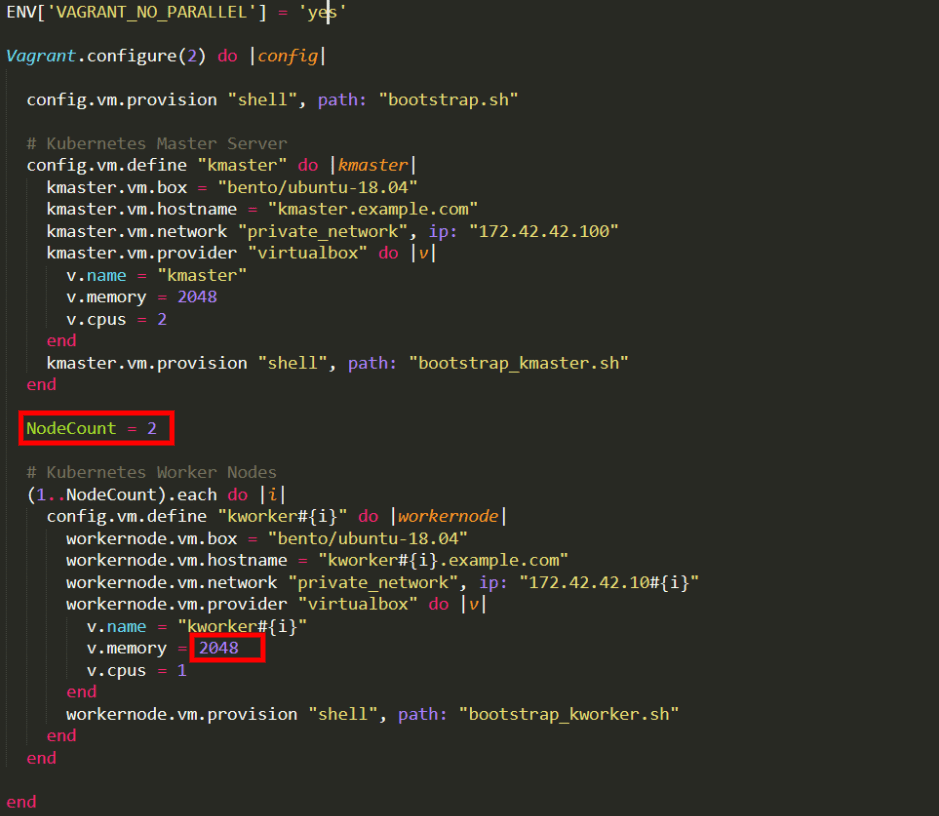
Let’s open the file, since we need to edit it:
Note: In case you’re running an older version of Windows, we recommend you edit in WordPad instead of Notepad. Older versions of Notepad have trouble interpreting EOL (end of line) characters in this file, making the text hard to read since lines wouldn’t properly be separated.
Look for the text “v.memory” found under the “Kubernetes Worker Nodes” section. We’ll assign this variable a value of 4096, to ensure that each Worker Node gets 4 GB of RAM because Elasticsearch requires at least this amount to function properly with the 4 nodes we will add later on. We’ll also change “v.cpus” and assign it a value of 2 instead of 1.
After we save our edited file, we can finally run Vagrant:
vagrant up
Now, this might take a while since there’re quite a few things that need to be downloaded and set up. We’ll be able to follow its progress in the output and we may get a few prompts to accept some changes.
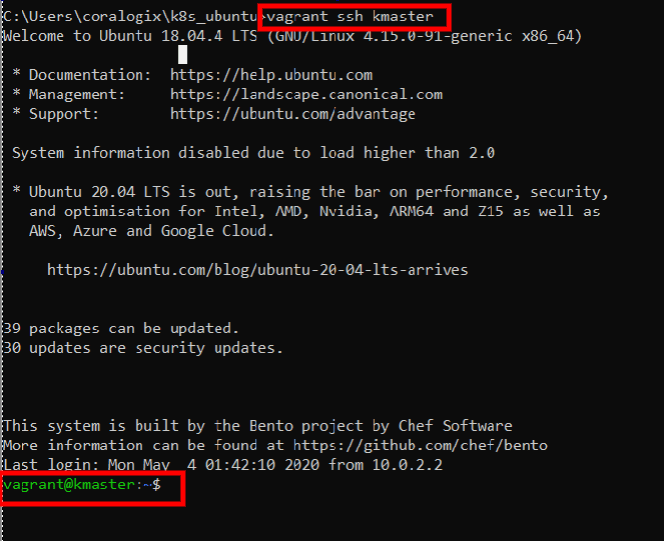
When the job is done, we can SSH into the master node by typing:
vagrant ssh kmaster
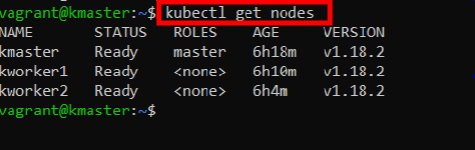
Let’s check if Kubernetes is up and running:
kubectl get nodes
This will list the nodes that make up this cluster:
Pretty awesome! We are well on our way to implementing the ELK stack on Kubernetes. So far, we’ve created our Kubernetes cluster and just barely scratched the surface of what we can do with such automation tools.
Stay tuned for more about Running ELK on Kubernetes with the rest of the series!
Kubernetes log monitoring can be complex. To do it successfully requires several components to be monitored simultaneously. First, it’s important to understand what those components are, which metrics should be monitored and what tools are available to do so.
In this post, we’ll take a close look at everything you need to know to get started with monitoring your Kubernetes-based system.
Monitoring Kubernetes Clusters vs. Kubernetes Pods
Monitoring Kubernetes Clusters
When monitoring the cluster, a full view across all areas is obtained, giving a good impression of the health of all pods, nodes, and apps.
Key areas to monitor at the cluster level include:
Node load: Tracking the load on each node is integral to monitoring efficiency. Some nodes are used more than others. Rebalancing the load distribution is key to keeping workloads fluid and effective. This can be done via DaemonSets.
Unsuccessful pods: Pods fail and abort. This is a normal part of Kubernetes processes. When a pod that should be working at a more efficient level or is inactive, it is essential to investigate the reason behind the anomalies in pod failures.
Cluster usage: Monitoring cluster infrastructure allows adjustment of the number of nodes in use and the allocation of resources to power workloads efficiently. The visibility of resources being distributed allows scaling up or down and avoids the costs of additional infrastructure. It is important to set a container’s memory and CPU usage limit accordingly.
Monitoring Kubernetes Pods
Cluster monitoring provides a global view of the Kubernetes environment, but collecting data from individual pods is also essential. It reveals the health of individual pods and the workloads they are hosting, providing a clearer picture of pod performance at a granular level, beyond the cluster.
Key areas to monitor at the cluster level include:
Total pod instances: There needs to be enough instances of a pod to ensure high availability. This way hosting bandwidth is not wasted, however consideration is needed to not run ‘too many extra’ pod instances.
Actual pod instances: Monitoring the number of instances for each pod that’s running versus what is expected to be running will reveal how to redistribute resources to achieve the desired state in terms of pods instances. ReplicaSets could be misconfigured with varying metrics, so it’s important to analyze these regularly.
Pod deployment: Monitoring pods deployment allows to view any misconfigurations that might be diminishing the availability of pods. It’s critical to monitor how resources distribute to nodes.
Important Metrics for Kubernetes Monitoring
To gain a higher visibility into a Kubernetes installation, there are several metrics that will provide valuable insight into how the apps are running.
Common metrics
These are metrics collected from the Kubernetes code, written in Golang. They allow understanding of performance in the platform at a cellular level and display the state of what is happening in the GoLang processes.
Node metrics –
Monitoring the standard metrics from the operating systems that power Kubernetes nodes provides insight into the health of each node.
Each Kubernetes Node has a finite capacity of memory and CPU and that can be utilized by the running pods, so these two metrics need to be monitored carefully. Other common node metrics to monitor include CPU load, memory consumption, filesystem activity and usage and network activity.
One approach to monitoring all cluster nodes is to create a special kind of Kubernetes pod called DaemonSets. Kubernetes ensures that every node created has a copy of the DaemonSet pod, which virtually enables one deployment to watch each machine in the cluster. As nodes are destroyed, the pod is also terminated.
Kubelet metrics –
To ensure the Control Plane is communicating efficiently with each individual node that a Kubelet runs on, it is recommended to monitor the Kubelet agent regularly. Beyond the common GoLang common metrics described above, Kubelet exposes some internals about its actions that are useful to track as well.
Controller manager metrics –
To ensure that workloads are orchestrated effectively, monitor the requests that the Controller is making to external APIs. This is critical in cloud-based Kubernetes deployments.
Scheduler metrics
To identify and prevent delays, monitor latency in the scheduler. This will ensure Kubernetes is deploying pods smoothly and on time.
The main responsibility of the scheduler is to choose which nodes to start newly launched pods on, based on resource requests and other conditions.
The scheduler logs are not very helpful on their own. Most of the scheduling decisions are available as Kubernetes events, which can be logged easily in a vendor-independent way, thus are the recommended source for troubleshooting. The scheduler logs might be needed in the rare case when the scheduler is not functioning, but a kubectl logs call is usually sufficient.
etcd metrics –
etcd stores all the configuration data for Kubernetes. etcd metrics will provide essential visibility into the condition of the cluster.
Container metrics –
Looking specifically into individual containers will allow monitoring of exact resource consumption rather than more general Kubernetes metrics. CAdvisor analyzes resource usage happening inside containers.
API Server metrics –
The Kubernetes API server is the interface to all the capabilities that Kubernetes provides. The API server controls all the operations that Kubernetes can perform. Monitoring this critical component is vital to ensure a smooth running cluster.
The API server metrics are grouped into a major categories:
Request Rates and Latencies
Performance of controller work queues
etcd helper cache work queues and cache performance
General process status (File Descriptors/Memory/CPU Seconds)
Golang status (GC/Memory/Threads)
kube-state-metrics –
kube-state-metrics is a service that makes cluster state information easily consumable. Where the Metrics Server exposes metrics on resource usage by pods and nodes, kube-state-metrics listens to the Control Plane API server for data on the overall status of Kubernetes objects (nodes, pods, Deployments, etc) as well as the resource limits and allocations for those objects. It then generates metrics from that data that are available through the Metrics API.
kube-state-metrics is an optional add-on. It is very easy to use and exports the metrics through an HTTP endpoint in a plain text format. They were designed to be easily consumed / scraped by open source tools like Prometheus.
In Kubernetes, the user can fetch system-level metrics from various out of the box tools like cAdvisor, Metrics Server, and Kubernetes API Server. It is also possible to fetch application level metrics from integrations like kube-state-metrics and Prometheus Node Exporter.
Prometheus scrapes metrics from instrumented jobs, either directly or via an intermediary push gateway for short-lived jobs. It locally stores all scraped samples and runs rules over this data to either aggregate and record new time series from existing data or generate alerts. Grafana or other API tools can be used to visualize the collected data.
Prometheus, Grafana and Alertmanager
One of the most popular Kubernetes monitoring solutions is the open-source Prometheus, Grafana and Alertmanager stack, deployed alongside kube-state-metrics and node_exporter to expose cluster-level Kubernetes object metrics as well as machine-level metrics like CPU and memory usage.
What is Prometheus?
Prometheus is a pull-based tool used specifically for containerized environments like Kubernetes. It is primarily focused on the metrics space and is more suited for operational monitoring. Exposing and scraping prometheus metrics is straightforward, and they are human readable, in a self-explanatory format. The metrics are published using a standard HTTP transport and can be checked using a web browser.
Apart from application metrics, Prometheus can collect metrics related to:
Node exporter, for the classical host-related metrics: cpu, mem, network, etc.
Kube-state-metrics for orchestration and cluster level metrics: deployments, pod metrics, resource reservation, etc.
Kube-system metrics from internal components: kubelet, etcd, scheduler, etc.
Prometheus can configure rules to trigger alerts using PromQL, Alertmanager will be in charge of managing alert notification, grouping, inhibition, etc.
Using Prometheus with Alertmanager and Grafana
PromQL (Prometheus Query Language) lets the user choose time-series data to aggregate and then view the results as tabular data or graphs in the Prometheus expression browser. Results can also be consumed by the external system via an API.
How does Alertmanager fit in? The Alertmanager component configures the receivers, gateways to deliver alert notifications. It handles alerts sent by client applications such as the Prometheus server and takes care of deduplicating, grouping, and routing them to the correct receiver integration such as email, PagerDuty or OpsGenie. It also takes care of silencing and inhibition of alerts.
Grafana can pull metrics from any number of Prometheus servers and display panels and dashboards. It also has the added ability to register multiple different backends as a datasource and render them all out on the same dashboard. This makes Grafana an outstanding choice for monitoring dashboards.
Useful Log Data for Troubleshooting
Logs are useful to examine when a problem is revealed by metrics. They give exact and invaluable information which provides more details than metrics. There are many options for logging in most of Kubernetes’ components. Applications also generate log data.
Digging deeper into the cluster requires logging into the relevant machines.
The locations of the relevant log files are:
Master
/var/log/kube-apiserver.log – API Server, responsible for serving the API
/var/log/kube-scheduler.log – Scheduler, responsible for making scheduling decisions
/var/log/kube-controller-manager.log – Controller that manages replication controllers
Worker nodes
/var/log/kubelet.log – Kubelet, responsible for running containers on the node
/var/log/kube-proxy.log – Kube Proxy, responsible for service load balancing
etcd logs
etcd uses the Github capnslog library for logging application output categorized into levels.
A log message’s level is determined according to these conventions:
Error: Data has been lost, a request has failed for a bad reason, or a required resource has been lost.
Warning: Temporary conditions that may cause errors, but may work fine.
Notice: Normal, but important (uncommon) log information.
Info: Normal, working log information, everything is fine, but helpful notices for auditing or common operations.
Debug: Everything is still fine, but even common operations may be logged and less helpful but more quantity of notices.
kubectl
When it comes to troubleshooting the Kubernetes cluster and the applications running on it, understanding and using logs are crucial. Like most systems, Kubernetes maintains thorough logs of activities happening in the cluster and applications, which highlight the root causes of any failures.
Logs in Kubernetes can give an insight into resources such as nodes, pods, containers, deployments and replica sets. This insight allows the observation of the interactions between those resources and see the effects that one action has on another. Generally, logs in the Kubernetes ecosystem can be divided into the cluster level (logs outputted by components such as the kubelet, the API server, the scheduler) and the application level (logs generated by pods and containers).
Use the following syntax to run kubectl commands from your terminal window:
kubectl [command] [TYPE] [NAME] [flags]
Where:
command: the operation to perform on one or more resources, i.e. create, get, describe, delete.
TYPE: the resource type.
NAME: the name of the resource.
flags: optional flags.
Examples:
kubectl get pod pod1# Lists resources of the pod ‘pod1’
kubectl logs pod1# Returns snapshot logs from the pod ‘pod1’
Kubernetes Events
Since Kubernetes Events capture all the events and resource state changes happening in your cluster, they allow past activities to be analyzed in your cluster. They are objects that display what is happening inside a cluster, such as the decisions made by the scheduler or why some pods were evicted from the node. They are the first thing to inspect for application and infrastructure operations when something is not working as expected.
Unfortunately, Kubernetes events are limited in the following ways:
Kubernetes Events can generally only be accessed using kubectl.
The default retention period of kubernetes events is one hour.
The retention period can be increased but this can cause issues with the cluster’s key-value store.
There is no way to visualize these events.
To address these issues, open source tools like Kubewatch, Eventrouter and Event-exporter have been developed.
Summary
Kubernetes monitoring is performed to maintain the health and availability of containerized applications built on Kubernetes. When you are creating the monitoring strategy for Kubernetes-based systems, it’s important to keep in mind the top metrics to monitor along with the various monitoring tools discussed in this article.
Be Our Partner
Complete this form to speak with one of our partner managers.
Thank You
Someone from our team will reach out shortly. Talk to you soon!
 The new standard of observability is here. Discover Olly, the industry’s first
