Metrics and Insight have been the obsession of every sector for decades now. Using data to drive growth has been a staple of boardroom meetings the world over. The promise of a data-driven approach has captured our imaginations.
What’s also a subject of these meetings, however, is why investment in data analysis hasn’t yielded results. Directors give the go ahead to sink thousands of dollars into observability and analytics solutions, with no returns. Yet all they see on the news and their LinkedIn feeds is competitors making millions, maybe even billions, by placing Analytics and Insight at the top of their agenda.
These directors and business leaders are confused. They have teams of data scientists and business analysts working with the most cutting edge tools on the market. Have those end of year figures moved though? Has performance improved more than a hard fought one, maybe two percent?
All metrics, no insights
The problem lies in those two words- Metrics and Insight.
More specifically, the problem is that most businesses love to dive into the metricspart. What they don’t realize is that without the ‘Insight’ half of the equation, all data analysis provides is endless logs of numbers and graphs. In a word, noise.
Sound familiar? Pumping your time, energy, and finance into the metricspart of your process will yield diminishing returns very quickly if that’s all you’re doing. If you want to dig yourself out of the ‘we just need more data’ trap, maybe you should switch your focus to the insights?
Data alone won’t solve this problem. To gain insight, what you need is something new. Context.
Why you NEED context
Metrics and Insight is business slang for keeping an extra close eye on things. Whether you’re using that log stack for financial data or monitoring a system or network, the fundamentals are the same. The How can be incredibly complex, but the What is straight forward. You’re using tech as a microscope for a hyper-focused view.
Without proper context it is impossible to gain any insight. Be it a warning about continued RAM spikes from your system monitoring log, or your e-commerce dashboard flagging a drop in sales of your flagship product, nothing actionable can be salvaged from the data alone.
If your metrics tell you that your CPU is spiking, you remain entirely unaware of why this is happening or what is going on. When you combine that spike in CPU with application logs indicating thread locking due to database timeouts, you suddenly have context. CPU spikes are good for getting you out of bed, but your logs are where you will find why you’re out of bed.
But how do you get context?
Context – Creating insight from metrics
With platforms like Coralogix, the endless sea of data noise can be condensed and transformed into understandable results, recommendations, and solutions. With a single platform, the results of your Analysis & Insight investments can yield nothing but actionable observations. Through collecting logs based on predetermined criteria, and delivering messages and alerts for the changes that impact your goals, Coralogix makes every minute you spend with your data cost effective. The platform provides context.
Platforms like Coralogix create context from the noise, filtering out what’s relevant to provide you with a clear picture of your data landscape. From context comes clarity, and from clarity comes insight, strategy, and growth.
Monitoring Jenkins is a serious challenge. Continuous auditing and logging are often overlooked, but it provides a wealth of information about the health of your Jenkins instance. The following are some approaches to generating informative logging to these issues, that can help to monitor and provide suitable explanations of where the problems lie; even identifying what the possible solutions are.
RAM usage on your Jenkins Instance
When Jenkins is running or has run out of RAM, it normally has a few root causes:
growth in data size requiring a bigger heap space
a memory leak
The operating system kernel running out of virtual memory
multiple threads need the same locks but obtain them in a different order
To identify the root cause of memory leaks, it normally requires access to one of three log sources. Those being the garbage collection logs, a heap dump, or a thread dump. These three sources are hugely important when monitoring Jenkins.
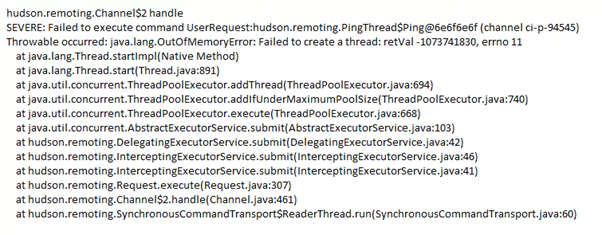
To demonstrate an OOM (OutofMemory) issue, a snippet from stdout log shows a Jenkins instance on a Master node, throwing such an error. Usually, when you see an OutOfMemory error and it references threads, this is commonly a native (system) out of memory because each additional thread that the JVM (Java Virtual Machine) spawns uses native memory (as opposed to Java Heap memory). The advice, in this case, would be to lower the Java heap size – since a large Java heap is crowding out the address space that needs to be used for keeping track of new threads
When Jenkins does perform a rebuild though, it will keep the jobs and build data on the filesystem and load the new format to the memory. This can also lead to high memory consumption and result in slow UI responsiveness and OOM errors. To avoid such cases as the one demonstrated, it is best to open the old data management page (located at your-jenkins-url/administrativeMonitor/OldData/manage), verify that the data is not needed, and clear it.
A key tip to managing the RAM or heap usage is to define the right heap size or ensure it is throttled. When defining the heap size, there is a very important JVM feature you should consider implementing on the JVM for Jenkins. This feature is called UseCompressedOops, and it works on 64 bit platforms, which are now most often used. What it does, is to shrink the object’s pointer from 64bit to 32bit, thus saving a lot of memory. Enabling the configuration of Memory usage thresholds (throttle usage), can enable job builds to fail or be unstable, but notify users if memory usage goes beyond the maximum available.
You need to constantly check and analyze Jenkins performance by implementing configurations for:
Monitoring memory usage. This checking and monitoring RAM memory usage continuously for Jenkins master / slave node
Checking java memory leak
Adding correct java option arguments/parameters which are suggested by Jenkins official documents
Monitoring with the correct plugin. The monitoring plugin will help you to monitor running setup with live scaled data. This will involve, install the monitoring plugin and monitor Jenkins memory usage
With the plugin, add monitoring alerts for deadlock, threads, memory, and active sessions. You can add monitoring alerts to capture threshold baseline details and present it in tooling such as the ELK ‘stack’ – ElasticSearch, LogStash, Kibana, to perform a search, analysis, and visualization operations in real-time
CPU consumption
Jenkins doesn’t normally need a lot of processing power to work, but memory and storage performance issues can make the CPU load spike exponentially. When Jenkins is performing tasks, CPU usage will rise and/or spike temporarily. Once the CPU intensive process completes, the CPU usage should drop down to a lower level. When you’re monitoring Jenkins, the CPU usage is of paramount importance.
However, if you are receiving high CPU alerts or are experiencing application performance degradation, this may be due to a Jenkins process being stuck in an infinite loop (normally deadlock threads), repeated full Garbage collections, or that the application has encountered an unexpected error. If the JVM for Jenkins is using close to 100% of the CPU consumption, it will constantly have to free up processing power for different processes, which will slow it down and may render the application unreachable. When you’re monitoring Jenkins, you need to be able to catch these issues quickly.
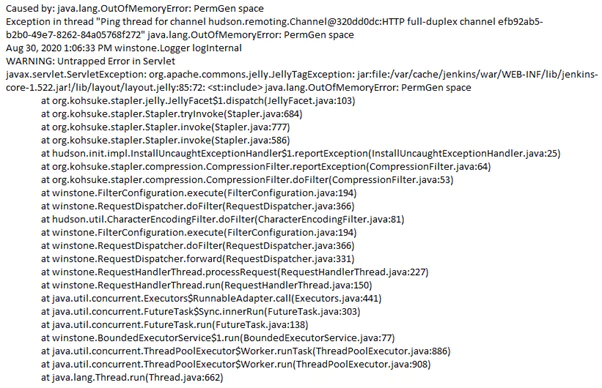
To demonstrate high CPU usage, a snippet from stdout log, indicates high usage with a deadlock when queueing up jobs from a Jenkins Master instance. Causing the issue is the OutOfMemoryError: PermGen space error. PermGen is one of the primary Java memory regions and has a limited amount of memory without customization. Application of the JVM parameters -Xmx and -XX:MaxPermSize will help rectify this problem. If you do not explicitly set the sizes, platform-specific defaults will be used, this potential issue can occur.
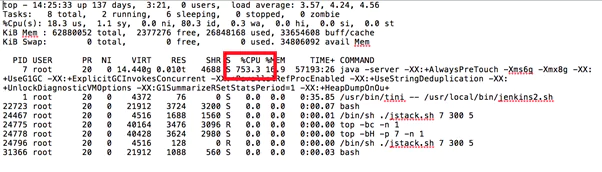
In order to reduce the CPU usage, you do need to determine what processes are taxing your CPU. The best way of diagnosing this is by executing the jenkinshangWithJstack.sh script while the CPU usage is high, as it will deliver the outputs of top and top -H while the issue is occurring, so you can see which threads are consuming the most CPU.
The following heap stack example shows that the Jenkins UI has become unresponsive, after running the jenkinshangWithJstack.sh script to gather data. In the output it shows the JVM is consuming a high amount of CPU:
Excessive CPU usage can be reduced or tempered by the following actions:
Minimizing the number of builds on the master node. This meaning you want to make the Jenkins master as “free” from work as you can, leaving the CPU and memory to be used for scheduling and triggering builds on slaves only
Looking at the garbage collection logs to see if there’s a memory leak
From repeated build processes, not keeping too much of the build history. Trying to limit it
Making sure your Jenkins & installed plugins version, are installed with the most up to date stable releases
Constantly monitor CPU performance, by checking and monitoring the CPU usage for Jenkins slaves the master node. Resulting outputs can be analyzed in the ELK stack
Managing the Garbage Collector (GC)
The garbage collector is an automatic memory management process.
Its main goal is to identify unused objects in the heap and release the memory that they hold. Some of the GC actions can cause the Jenkins program to pause. This will mostly happen when it has a large heap (normally 4GB). In those cases, GC tuning is required to shorten the pause time. If Jenkins is processing a large heap but requires low pause times, then you should consider as a starting point, the use of the G1GC collector. It will help manage its memory usage more efficiently.
A typical case example is when the java.lang.OutOfMemoryError: GC overhead limit exceeded error happens within a Jenkins instance. This is the JVM’s way of signaling that Jenkins is spending too much time doing garbage collection with too little result. By default the JVM is configured to throw this error if it spends more than 98% of the total time doing GC and when after the GC only less than 2% of the heap is recovered. The Garbage collector is always running behind the scenes, and when you’re monitoring Jenkins, you need to make sure it is running efficiently.
So when trying to build jobs in Jenkins from the Master node, and the build log (or stdout file) presents this repeated output…
Exception in thread "main" Java.lang.OutOfMemoryError: GC overhead limit exceeded.
…it is suggesting to clear any old builds which have been deployed way back in time (weeks or possibly months) and to consider increasing the build counter in Jenkins.
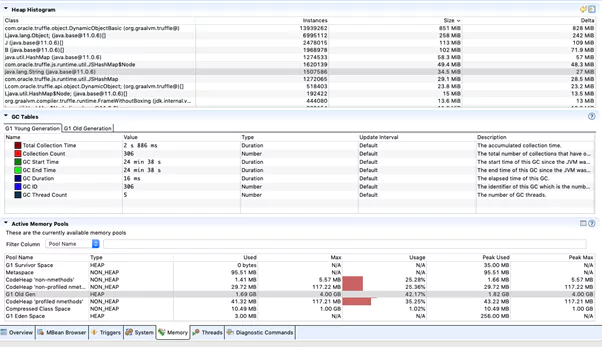
Through the use of a heap histogram as demonstrated, this can identify where the GC shows a large heap area (of 4GB) and its current usage from the Jenkins instance.
To manage the Garbage Collector more effectively and allow it to compact the heap on-the-go, it is suggested to apply the following configurations.
Enable GC logging
Enable G1GC – this is the most modern GC implementation (depending on JDK version)
Monitor GC behavior with plugins, services or toolings
Tune GC with additional flags as needed
Utilise the ELK stack to analyze the logging source
Keep monitoring and attach any key metric alerting to the logging process
This will involve tuning the garbage collection and setting arguments on the JVM for Jenkins.
Resulting in a more detailed, explanatory and transparent approach to log management and the monitoring of the garbage collector. Key is to parse effective logging, through primarily CUI/GUI GC monitoring tools, so as to provide better visualization of the issue and to identify and isolate, where any slow unresponsive behaviour Jenkins is showing.
Pipeline Build Failures
It is pretty common when starting with Jenkins to have a single server which runs the master and all builds, however Jenkins architecture is fundamentally ‘Master and Agent (slave)’. The master is designed to do coordination and provide the GUI and API endpoints, and the agents are designed to perform the work. The reason being that workloads are often best ‘farmed out’ to distributed servers.
When Jenkins is used in cloud environments, it has many integrations with agents, plugins and extensions, to support those various environmental elements. This may involve Virtual Machines, Docker Containers, Kubernetes, AWS (EC2), Azure, Google Cloud, VMWare and other external components. Where problems can arise in those build jobs, is if you use Jenkins as just a master instance, and finding that you start to run out of resources such as memory, CPU, etc. At that point you need to consider either upgrading your master or setting up agents to pick up the load. You might also need to factor having several different environments to test your builds.
When Jenkins Jenkins spins up an agent, you are likely dealing with a plugin that manages that agent. The fact that you need plugins in Jenkins to do just about anything can be problematic — and not only because it means software delivery teams have to spend time installing and configuring them before they can start working. A bigger issue will come into play here, in that most of Jenkins’ plugins are written by third parties, vary in quality, and may lose support without notice.
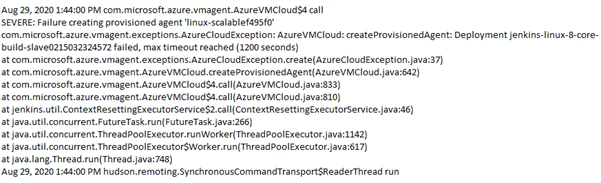
If the plugin version is out of sync, such as one to create Jenkins agents in Azure Virtual Machines, then the following error can occur is displayed in a stdout or build log:
This provisioning agent error shown, was specific to a bug not identified before release and applied outside of a repository used for approved build dependencies.
To ensure you follow some best practice for you build pipeline:
Avoid where possible, running jobs on the Master. User a master/slave (node) configuration. Ideally each jobs should run on slave and make sure you are executing jobs on slave to have minimum load on master node
Add correct cleanup configuration to delete old jobs from the master node
Add the correct memory configurations and limits for the Jenkins deployment
Use a central, shared and supported repository for build dependencies, so ensuring a cleaner, more reliable and safer build job workspace
Install only supported plugins and avoid those that have memory leak issues. Make sure you are installing correct plugins that you can test on a staging (testing) server first, before consideration of installing them in production
Avoid installing unwanted plugins, and checking before installing them, that they are security compliant and do not having security vulnerabilities
Export build logs to the ELK stack. In case of a large amount of running jobs, it can become difficult to keep track of all the activity. So collecting all this data and shipping it into the ELK Stack, can help to give you more visibility and identify any issues
Permission / Security related Issues
Jenkins is a tool that needs to interface with a myriad of systems and applications throughout DevOps environments. It needs unabridged access to code and artifacts, and to accomplish its role as the ‘steward,’ Jenkins must have access to a considerable breadth of credentials – or secrets – from usernames and passwords to source control and artifact deployment. When monitoring Jenkins, it’s tempting to only think about operational issues, but security issues come up regularly.
All too often, users who use Jenkins do have a propensity to treat security as secondary. The business risk of not securing your Jenkins servers is high. You need to ensure that user authentication is established and enforce access control policies to your Jenkins servers. Due to the centrality of its role, a breach of your Jenkins servers can end up exposing access credentials to your most valuable resources. Key to securing Jenkins, is ensuring there is an elimination of weaknesses related to misconfigured environments and poorly constructed security controls. This mainly related to authentication and authorization policies.
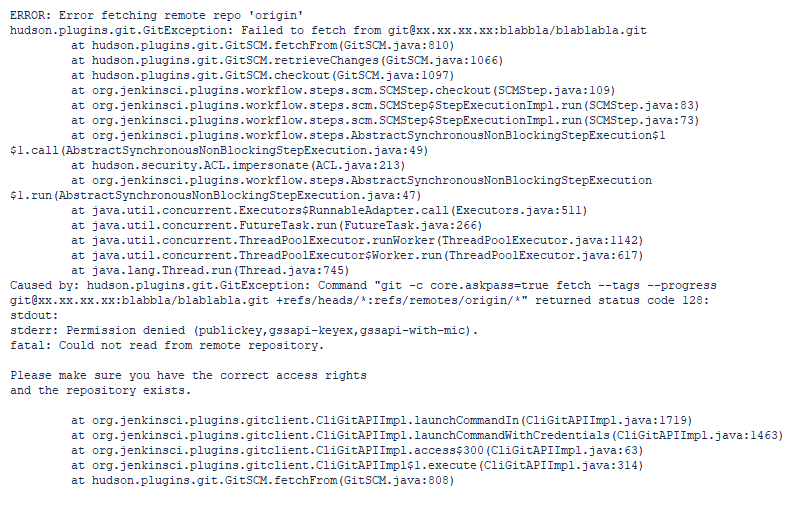
Understanding how to apply security controls can be seen in this log output, when encountering a problem trying to launch a pipeline Job with access to a Git repository.
The permission denied error meant there was something wrong with the credential(s) in the job definition, provided by Jenkins to access the Git server. It was corrected with an ‘id_rsa’ credential (permission).
To ensure you follow some best practice for securing your Jenkins instance and jobs:
Enable Jenkins’ security. Jenkins global security is the first line of defense in protecting the asset it controls. Core Jenkins supports four security realms: delegate to servlet container, Jenkins’s own user database, LDAP, and Unix user/group database
Consider the use of the Jenkins credentials plugin, that can provide a default internal credentials store. This can be used to store high value or privileged credentials, such as GitHub tokens
Configuring access control in Jenkins using a Security Realm and Authorization configuration. A Security Realm, informs the Jenkins environment, how and where to pull user (or identity) information from. Authorization configuration which informs the Jenkins environment as to which users and/or groups can access which aspects of Jenkins
Jenkins can provide various ways of keeping track of an instance, with two main categories of logs represented: system logs and build logs. Jenkins will provide some pretty useful in-console capabilities, for keeping track of your builds using these logs. As Jenkins takes constant effort to monitor, getting the context right in the form of the most informative logging, is critical to managing the most common and valid issues.
AWS S3 access logs provide detailed records for requests made to S3 buckets. They’re useful for many applications. For example, access log information can be useful in security and access audits. It can also help generate customer insights and better understand your Amazon S3 bill.
Coralogix makes it easy to integrate with your S3 server access logs via a Lambda function.
Parsing S3 Server Access Logs
You can learn how to parse S3 Server Access Logs using Coralogix rules here and in this blog.
This regular expression was used to parse the access logs in the creation of this document. Since flow logs can be customized you have to make sure that the regex correctly matches with your log fields.
S3 Server Access Log Structure
S3 access logs’ structure is described in this AWS document. The logs can be customized by using query string parameters prefixed by ‘x-’. Remember that in case of a customized log, the rule’s regex needs to be customized as well.
Alerts
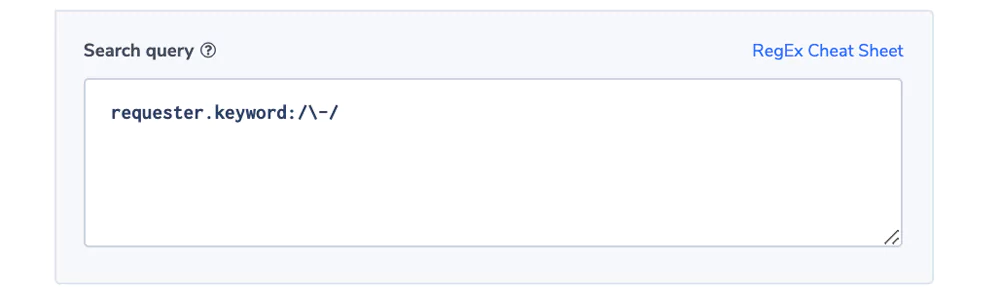
Unauthenticated requester alert
The field ‘requester’ holds the canonical user ID of an S3 operation’s requester. When the request is unauthenticated the value will be ‘-’. Some companies will require only authenticated requests and would like to be alerted when an unauthenticated one was issued.
Alert Filter: ‘requester.keyword:/-/
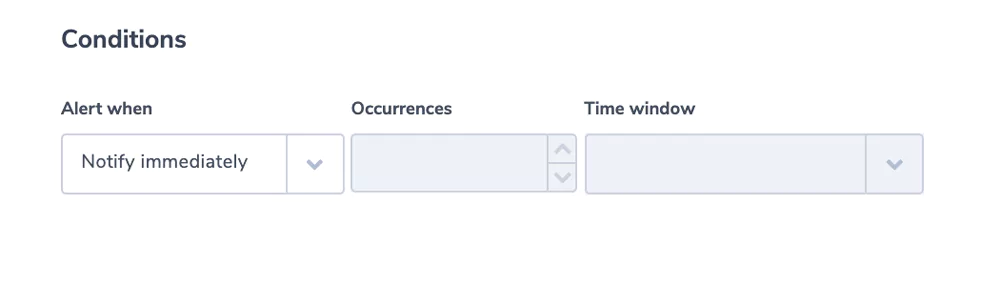
Alert Condition: ‘notify immediately’
Because ‘-’ is an Elasticsearch token delimiter, we’re using a regular expression in the query and the field.keyword that holds the first 70 characters in a field as one token. See more here
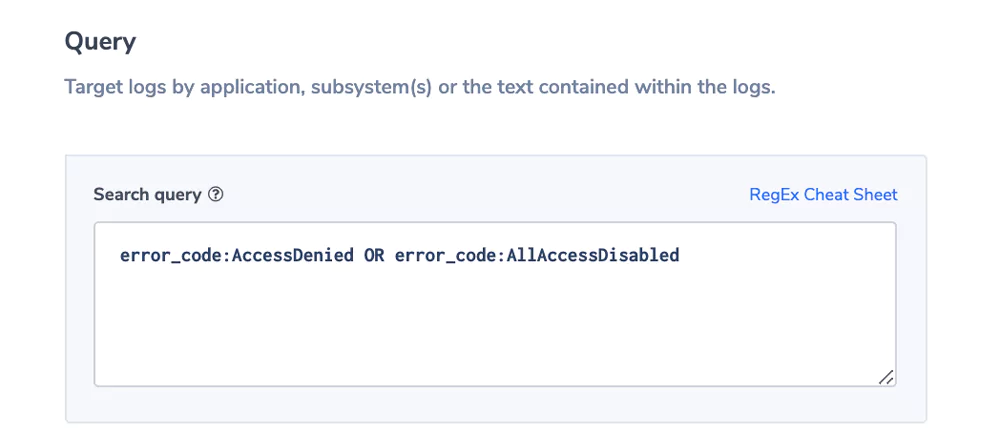
Error Code Alert
S3 operations return meaningful error codes and description, beyond the http numeric status codes. The key errorCode holds this value. In this example we are interested in accessing issues that might flag security problems.
Alert Filter: error_code:AccessDenied OR error_cose:AllAccessDisabled
Alert Condition: ‘notify immediately’
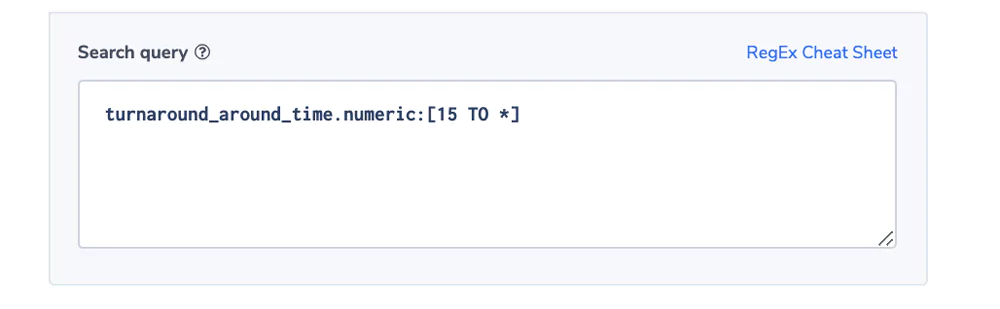
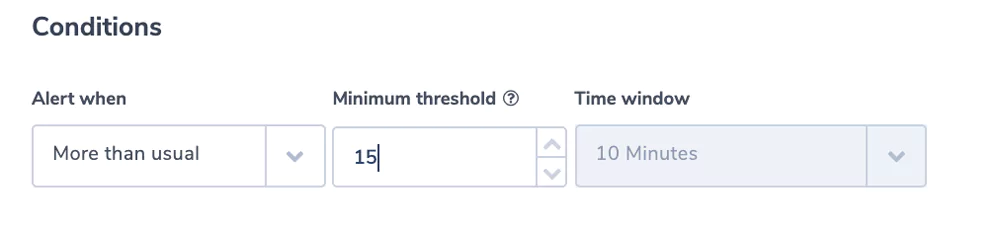
Turnaround Time Is Too High
The field turnarround_time reflects the time it takes S3 itself to process the request from the time it gets to the server to the time it leaves.
Alert Filter: turnaround_around_time.numeric:[15 TO *]
indicating that we are looking for requests that took 15 ms or more.
The Alert Condition: is ‘more than usual’.
Using the power of machine learning to find deviations from the normal.
[15 TO *] is Elasticsearch syntax indicating that we are looking for requests that took 15 ms or more. We will indicate 15 ms as the threshold in the alert condition. We are using the .numeric field, for more information on .numeric and how Coralogix stores key values see here.
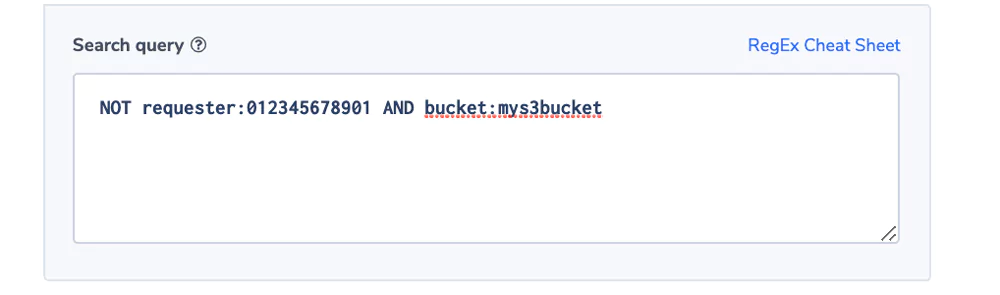
Unauthorized User Access
Most companies are sensitive to unauthorized users trying to access certain buckets. This alert will send a notification upon such an event.
Alert Filter: NOT requester:012345678901 AND bucket:mys3bucket
Alert Condition: ‘notify immediately’
We use the combination of bucket name and requester as each bucket might have a different authorization configuration. Important to note that the requester can be in the form of an IAM or a unique ID.
In the example we assumed an IAM. The account number is a token in the IAM string. You can read more about IAM and unique ID’s here.
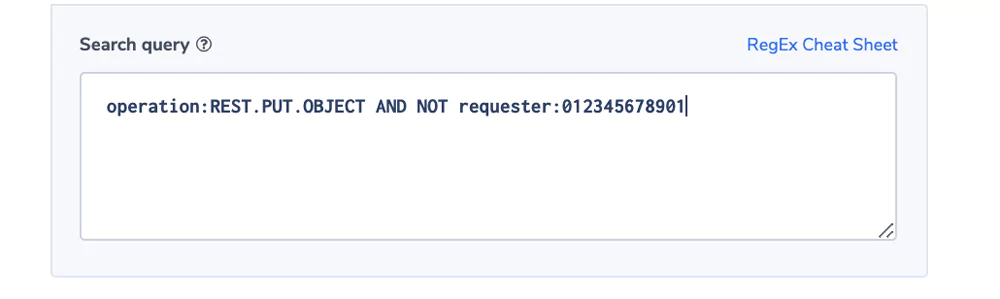
Unauthorized Write
In this example, we have a bucket that is authorized for an application module using an IAM but is read-only for any other user. To keep the integrity of the data, operations would like to be notified if an unauthorized write is identified. It may be the result of a bug or a malicious operation.
Alert Filter: operation:REST.PUT.OBJECT AND NOT requester:012345678901
Alert Condition: ‘notify immediately’.
Note: The operation field can come in different formats, see here. We used the REST format for this example.
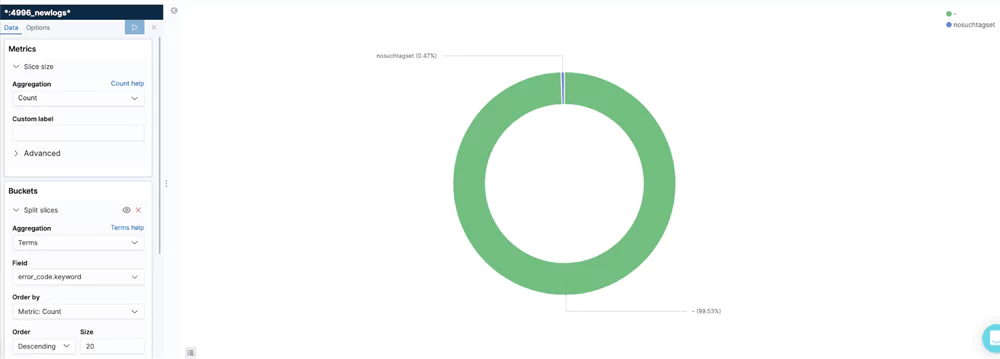
Visualizations
Errors/Operations
This visualization shows the different errors as part of the number of S3 operations. It allows users to keep an eye the % of non-faulty operations and take action if it drops below a threshold.
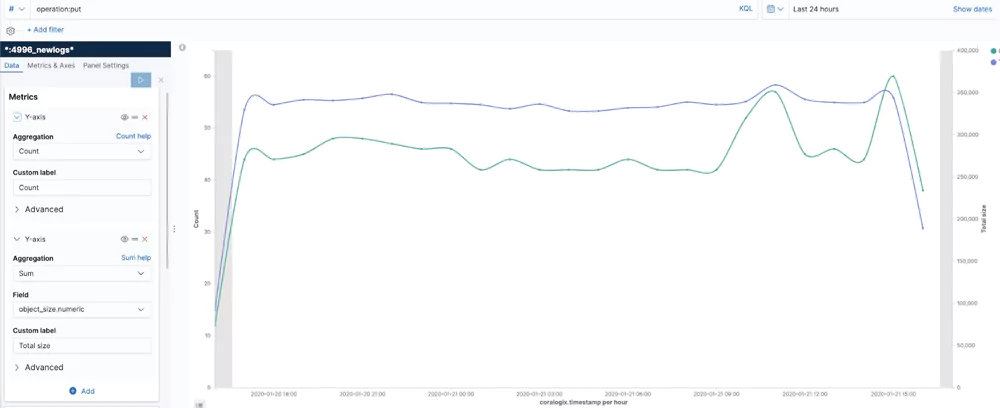
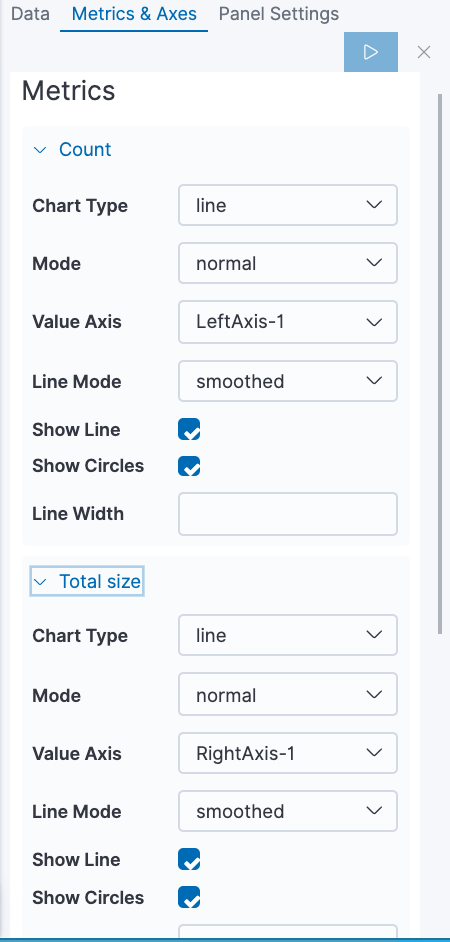
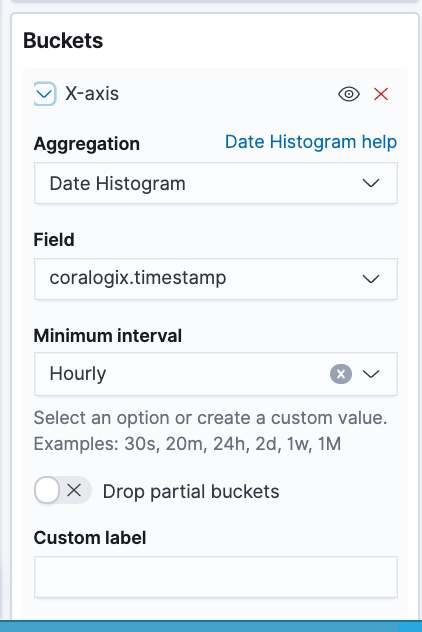
Number of Operations and Bytes
This visualization sums the number of write operations and bytes written per hour.
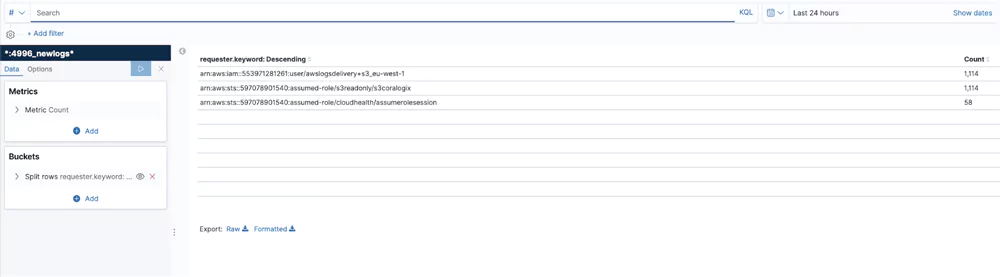
Users by Number of Operations
This table shows the 3 most active users in a bucket
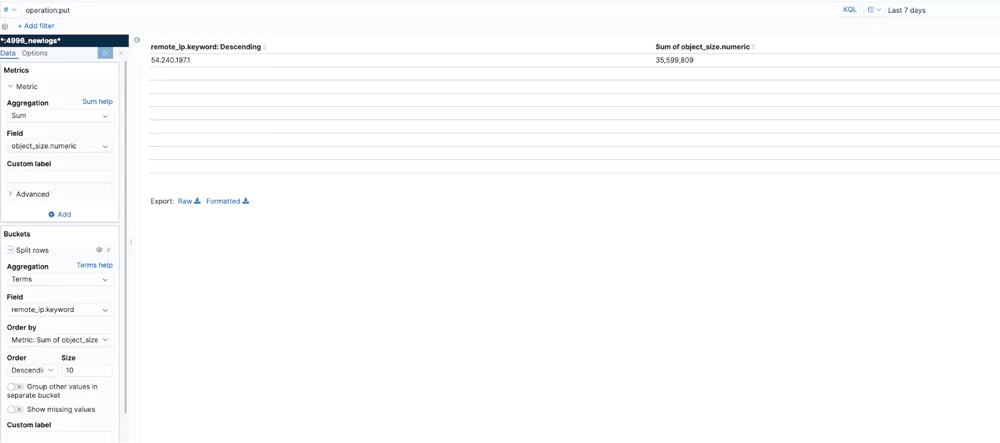
Operations
This visualization shows the top IP addresses by number of operations.
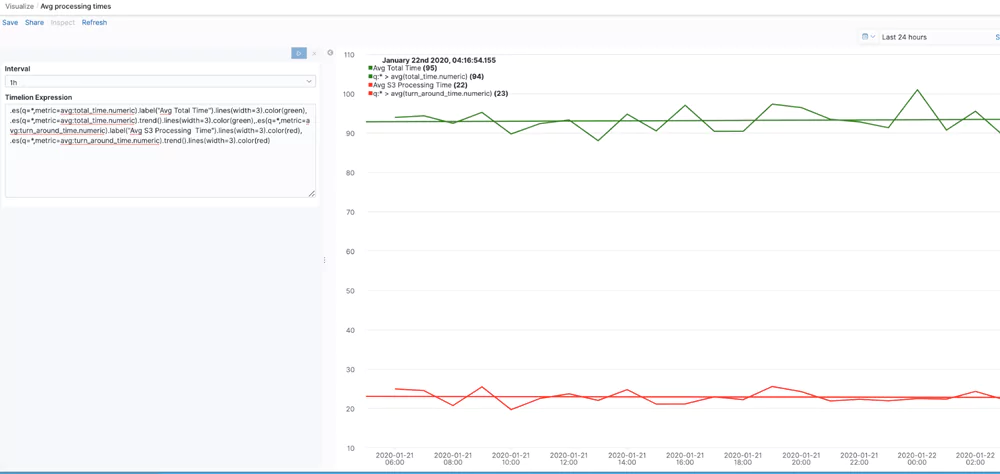
Avg. Processing Times
This visualization uses Timelion to give the avg total time, which is the number of milliseconds the request was in flight from the server’s perspective, and the turnaround time, which is the number of milliseconds that Amazon S3 spent processing the request. The trend() function is chained to show a trend line for each time series.
In this blog post you got some useful pointers explaining what S3 logs are and their structure. The post focused on providing examples of alerts and visualizations that can help you unlock the value of these logs. Remember that every user is unique and has its own use case and data. Your logs might be customized and configured differently and you will most likely have your own requirements. So, you are encouraged to take the methods and concepts showed here and adapt them to your own needs. If you need help or have any questions, don’t hesitate and reach out to [email protected]. You can learn more about unlocking the value embedded in AWS and other logs in some of our other blog posts.
Before we dive into e-commerce logging, a short history recap: In 1992, avowed book nerd and prescient businessman Charles M. Stack launched an e-commerce site called books.com. Online shopping was a radical concept at that time, and Stack’s business model had little competition. The site was successful and was eventually purchased by major book retailer Barnes and Noble.
Twenty-five years later, it’s clear that Stack created a monster. Today,more purchases are being made online than in any brick-and-mortar store. And despite his status as a pioneer in the field of online retail, there is no doubt that if Stack had opened his e-commerce business in today’s market, chances are it wouldn’t have been nearly as successful. The reason? Competition is incredibly fierce, and success is forthcoming only to those sites that function like well-oiled machines.
e-commerce logging and the ability to monitor site performance is now the key competitive advantage in the market. Every broken link or transaction can lead to revenue loss. Site admins and owners need accurate site data to make sure their key pages – like checkout, login, and registration – are loading properly. They need to know exactly who their customers are and when they are shopping.
What services should online retailers seek out to gain these insights? The immediate, knee-jerk reaction is typically Google Analytics or similarly structured web analytics providers. However, the widespread use of ad-blocking software has called this assumption into question.
Google Non-alytics
The percentage of US web surfers that utilize some form of ad-blocking software hasmore than doubled in the last three years. Shoppers in emerging markets are keen on the ad-free experience as well, with36% of smartphone users in the Asia Pacific region employing adblocking. These figures are deeply worrisome for online businesses. Ad-blocking software frequently blocks site cookies which Google Analytics, and its competitors, rely on for tracking to extract site data.
Unless established data analytics services are able to dramatically change their tracking methodology, e-commerce site owners will find themselves in an information blackout for a large chunk of their customers. Fortunately, there are other analytics tools that are unaffected by ad-block software, and which represent a more sustainable approach to understanding site performance.
Embrace e-commerce logging
A log file is generated every time a browser requests data from a server, creating a goldmine of actionable insights for e-commerce logging. These log files can then beaggregated according to business-critical information, such as:
Page Load and Response Times
Users today are becomingmore and more impatient with slow sites. Responses are expected after two seconds, with anything slower likely leading to site churn. Proper e-commerce logging can show the load and response times of each page on a site and indicate the root cause of latencies.
HTTP Errors
HTTP errors are generated for a variety of reasons, including faulty links and overloaded servers. They can prevent the completion of transactions, spelling disaster for online businesses.
Session Duration
Are potential customers leaving key pages prematurely? How much time do surfers spend perusing a product page before they make a purchase? Knowing session lengths allows for the optimization of underperforming pages and the sales funnels they support.
Geolocation
Understanding where customers come from is critical to maximizing online shopping revenues. Special sales and coupons can be targeted to regions with a large customer concentration. Pages can be translated and localized for countries that generate high levels of traffic and products can be tailored to clients’ cultural tastes.
Peak Activity Times
It’s impossible to schedule accurate levels of customer and technical support without knowing what days and times a site receive its highest amount of traffic. Logs provide not only a clear picture of minute-by-minute traffic, but also the impact that traffic has on site performance. Keeping a close eye on sensitive sections of the site during times of peak activity reveals the site’s ‘breaking points’, and provides clues needed for creating a more robust site architecture.
Crawling Activity
Log files indicate the frequency with which key pages arecrawled, which ultimately influences a site’s search rank. Beyond the crawl count, logs also reveal the error count picked up by search spiders, the top link referrers to a site, and other useful info for SEO.
Manageable Site Data. No Blind Spots.
Logging site data is clearly the most complete and reliable source of insight into an e-commerce site’s performance. But the steady growth of online shopping leads to a parallel growth in the log output. This avalanche of information makes manual log management infeasible and necessitates the assistance and guidance of a dedicated log analysis platform.
An advanced analysis platform automatically aggregates incoming logs into the categories set by site owners. Emergency, revenue-killing issues, like HTTP errors at the checkout page, areintelligently recognized by the platform and forwarded to developers for immediate resolution. And unlike other web analytics alternatives, log files provide visibility no matter what a user has installed on his or her browser.
Be Our Partner
Complete this form to speak with one of our partner managers.
Thank You
Someone from our team will reach out shortly. Talk to you soon!
 The new standard of observability is here. Discover Olly, the industry’s first