What is Observability?


Data observability is a term that is becoming commonplace in both startups and enterprises. Log observability is different from monitoring, as it provides visualized metrics from a variety of different systems in a single pane of glass view. This is invaluable for organizations to understand the interdependencies and links between external events and internal performance.
The need for observability has been driven by increasingly complex systems and the link between user experience and platform performance. In this article, we are going to explain what observability is, and why it’s so important.
Defining Observability
Observability is different from the concept of monitoring because it both provides context to the insights being examined and provides those insights without having to define what it is you’re looking for.
Observability requires three constituent parts to work: logs, metrics, and traces. However, observability goes much further than traditional monitoring, because of the observability and monitoring combination of these three elements.
Logs for Observability
Of the three elements of observability, logs are the most granular in detail. They are time-stamped records of events occurring in a system or with software. Logging practice is commonplace nowadays, although there are still the best practices that can be followed. Logs are available in structured or unstructured forms, and whilst structured logs may be seen as the newer (and maybe preferred) form, software engineers will choose the format of the logs based on their requirements.
The reason logs are so useful for observability is that they provide an actual timeline of events so that you can analyze what went wrong and when. Logs alone, however, are not a perfect answer to understanding your system. Logs are costly to store, and only relay information regarding one component of a system.
Metrics for Observability
Different from logs, metrics are dynamic numerical values that will change over time. They might relate to varying disk capacity, network performance, or even data from marketing systems. They are best viewed in a graph or with a data visualization tool, given the discrete nature of the data. Metrics usually form the basis for alerts that you might set, as a defined numerical value can act as a trigger warning for a DevOps engineer to intervene.
The issue with metric-based alerts alone is that you are only notified when a threshold is hit. If the alert threshold is at the wrong level, you might hear about an issue too late. By themselves, metrics don’t allow you to diagnose a problem, only make you aware of a problem.
Traces for Observability
Tracing is the final of the three constituent aspects of observability. While logs are discrete data, metrics are continuous data, traces use unique data “tags” to follow data throughout a process or application workflow. System traceability is complex to implement but invaluable for identifying performance bottlenecks across an entire distributed system.
Traces give you the ability to understand where problems are taking place, which is difficult in a microservices architecture. Distributed tracing gives visibility in a complex architecture, but its complexity to implement is directly linked to the complexity of your system.
The Power of Three
Observability is the combination of the three constituent elements of log monitoring, metrics, and traces. Each of these three elements provides different insights for separate aspects of your system.
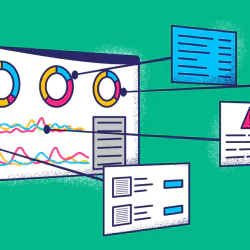
The power of observability comes from the successful implementation, collation, and analysis of these three elements. Observability is the extrapolation of the inherent strengths of a good monitoring strategy. A true observability platform allows you to view, analyze, and interrogate data that gives you real insights into your system’s health and performance. By collecting holistic data from disparate elements of your system, and viewing them in a single pane of glass, you’ll be empowered to optimize your system performance and diagnose any problems.
Benefits and Challenges of Observability
Like any newer practice or principle, observability has both positives and negatives. The positives far outweigh the negatives, and most of the challenges come from the unsuccessful or incomplete implementation of an observability platform.
Benefits of doing things differently
Organizations that fully invest in an observability process and platform like Coralogix see a tangible value-add. The ability to compare and analyze metrics from marketing systems alongside system performance can allow you to spot performance bottlenecks or even a misconfigured load balancer.
Translating this sort of diagnosis into a cost-saving or customer experience improvement is a clear benefit.
Traditional log monitoring means viewing data in isolation or having to switch between systems and log files to diagnose a problem. Observability allows metrics and traces to be overlaid with log data so that you spot where things could be improved without the need to dig through reams of logs.
Where challenges can arise
Most challenges that crop up in relation to observability come from not embracing it fully. For example, if your applications are built in various programming languages, you’ll find that it will be costly and time-consuming to implement full traceability. By only having traces on some aspects of your system, you’re likely to receive an unbalanced or misrepresented view of your system’s performance.
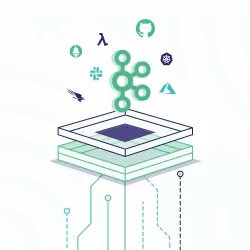
An additional challenge may appear in the nature of observability tooling itself. SaaS observability tools are still behind the curve of progress, in comparison with the tools that they’re monitoring. Fortunately, Coralogix can use S3 as a log repository to make a single destination for disparate applications’ logs.
Getting Started with Log Observability
We’ve covered what makes up good observability practice, as well as some things to keep in mind to avoid any pitfalls. To summarise, it’s important to have your log monitoring, traces, and metrics correctly configured and implemented before looking at observability. These three pillars form the foundation of good observability practice.
You also need to keep in mind the limitations of the data observability that your system may produce, and embrace the right tools to overcome those challenges. Be it logs from on-prem applications, or traces not being applied to all elements of your system, Coralogix is well placed to pull everything together and display the insights you need.