The new standard of observability is here. Discover Olly, the industry’s first
OpenTelemetry Instrumentation How To: Basics & 2 Quick Tutorials

Key Use Cases for OpenTelemetry Instrumentation
Public APIs
Instrumenting public APIs allows developers to monitor performance metrics like latency, request rates, and error rates. This provides insights into how APIs interact with client applications, revealing bottlenecks or performance degradation.
Additionally, OpenTelemetry’s standardized data aids integration with monitoring platforms. By collecting consistent telemetry across APIs, developers can conduct cross-API analysis, leading to deeper insights and better optimization strategies. This ensures APIs remain responsive and reliable under varying loads.
Nested Network and Other Spans
Nested network spans are critical for understanding network communication in distributed systems. OpenTelemetry captures these spans to reflect network calls and their hierarchical structure within applications. This visibility aids in diagnosing latency issues and understanding distributed transactions’ flow.
Capturing nested spans also helps visualize dependency chains, which are important for tracing the root cause of errors in complex systems. With OpenTelemetry, developers can get a detailed picture of how components interact, enabling more effective debugging and performance tuning.
Events
In OpenTelemetry, events are used for pinpointing significant occurrences during application execution. These events provide context for distributed tracing, highlighting when and where changes occur in the system. They enable understanding application states and transitions, complementing trace data with richer details.
Events are important in exception handling and logging, offering fine-grained visibility into errors and anomalies. When integrated with OpenTelemetry, they enhance observability, ensuring data capture which aids in troubleshooting and system optimization for better reliability.
How OpenTelemetry Facilitates Instrumentation
Code-Based Solutions
Code-based instrumentation involves using OpenTelemetry APIs and SDKs directly within an application’s codebase. This approach offers deeper insights into the application’s performance by allowing custom generation of telemetry data like traces, metrics, and logs.
To set up code-based instrumentation, users first need to import the OpenTelemetry API and SDK into the application. If developing a standalone service, both the API and SDK are required, while libraries may only need the API.
Once imported, developers can configure a tracer or meter provider, which is responsible for creating trace and metric data. The objects generated from these providers capture telemetry related to the application’s components, helping monitor system behavior. After setting up the providers, start collecting telemetry data through instrumentation libraries for various dependencies, such as database interactions or HTTP requests.
This data is exported using tools like Jaeger or Prometheus, or through the OpenTelemetry Collector, which aggregates and forwards the telemetry to the preferred monitoring system. This method is suitable for applications where deep visibility into the internal workings is necessary, as it provides customizable and detailed telemetry.
Zero-Code Solutions
Zero-code instrumentation allows observability without the need to modify application code. Instead, telemetry is gathered by integrating OpenTelemetry as an agent, using techniques like bytecode manipulation or eBPF to insert telemetry collection at runtime.
This type of instrumentation typically focuses on the libraries and environment the application uses, such as tracking HTTP requests, database queries, and message queues, without instrumenting the application’s core logic itself.
Configuration of zero-code instrumentation is handled through environment variables or language-specific settings, enabling quick setup with minimal effort. This makes it an appropriate solution for gaining visibility into applications where source code changes are not feasible.
Although zero-code solutions are easier to implement initially, they may provide less detailed telemetry compared to code-based approaches, especially regarding custom application behavior.

What Are OpenTelemetry Instrumentation Libraries?
OpenTelemetry provides a variety of instrumentation libraries that integrate with different technologies to automatically collect telemetry data. These libraries hook into existing application frameworks and components, capturing critical traces, logs, and metrics without requiring developers to manually instrument every part of their code.
Native instrumentation is one of the benefits of OpenTelemetry’s approach. Instead of needing to expose hooks or document APIs for telemetry, developers can rely on OpenTelemetry’s consistent APIs. This simplifies the process of adding observability to applications, as the same standardized OpenTelemetry APIs handle library and application code.
Data consistency is another advantage of using OpenTelemetry’s instrumentation libraries. By adhering to OpenTelemetry’s semantic conventions, libraries can produce similar and predictable telemetry across different environments and technologies. This consistency allows users to gain insights without needing to understand the intricacies of each library.
The instrumentation libraries also support fine-tuning of telemetry signals, giving developers the flexibility to filter, process, and aggregate data based on their observability needs. This makes it possible to optimize data collection and ensure that only the most relevant information is captured, while reducing overhead.
Tutorial #1: Auto-Instrumentation Example in Python
In this tutorial, we’ll walk through setting up OpenTelemetry auto-instrumentation for a Python application. We will demonstrate how to instrument a Flask server manually, automatically, and programmatically. Instructions in this and the following section are adapted from the OpenTelemetry documentation.
Step 1: Setting Up the Environment
- Start by creating a virtual environment to isolate your dependencies:
mkdir auto_instrumentation
cd auto_instrumentation
python -m venv venv
source ./venv/bin/activate
- Install the necessary packages:
pip3 install opentelemetry-distro flask requests
- Run the opentelemetry-bootstrap command to install the necessary OpenTelemetry instrumentation libraries:
opentelemetry-bootstrap -a install
Automatic Instrumentation Example
With automatic instrumentation (server_automatic.py), OpenTelemetry hooks into the Flask application using runtime modifications (monkey-patching). This approach significantly reduces the need for custom code.
from flask import Flask, request
app = Flask(__name__)
@app.route("/server_request")
def server_request():
      print(request.args.get("param"))
return "served"
if __name__ == "__main__":
      app.run(port=8082)
To run the application with auto-instrumentation, execute the following command:
opentelemetry-instrument --traces_exporter console --
metrics_exporter none python3 server_automatic.py
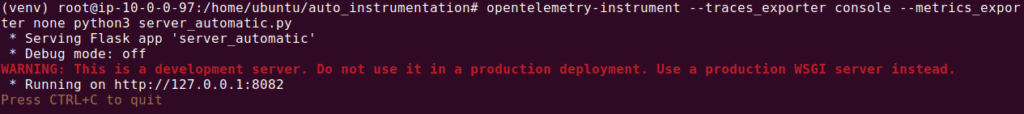
The opentelemetry-instrument command automatically instruments the application, capturing traces, metrics, and logs without the need to modify the source code.
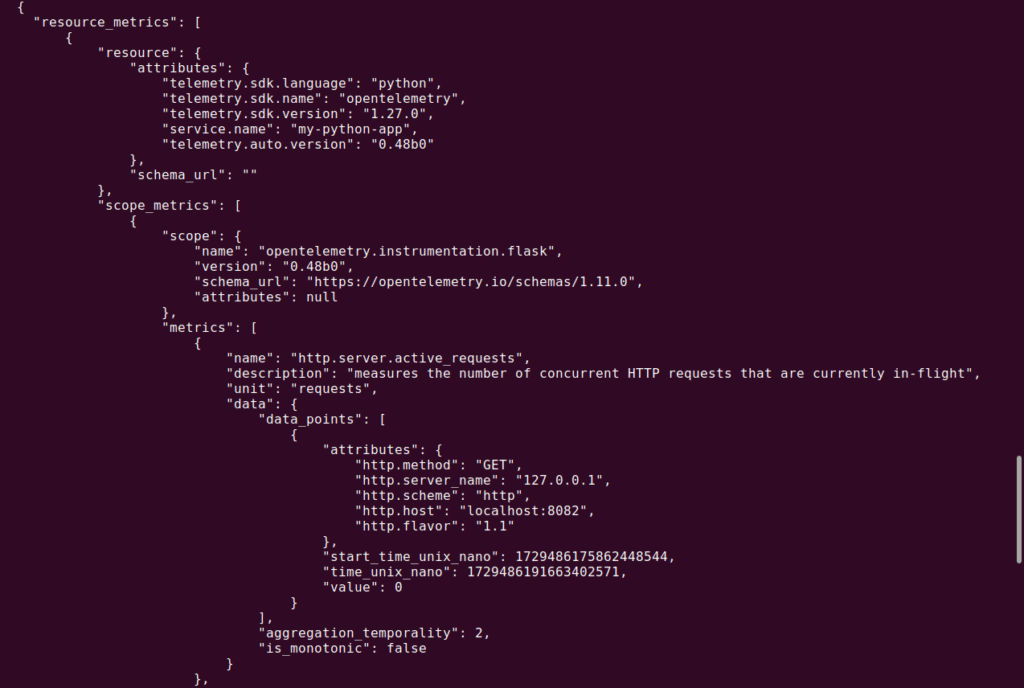
To test it, open the URL: http://localhost:8082 via browser or run curl http://localhost:8082 in a second terminal. You will see captured metrics as shown in the following screenshot:

Capturing HTTP Headers (Optional)
You can capture HTTP request and response headers by setting environment variables. For example, to capture User-Agent and Content-Type headers:
export
OTEL_INSTRUMENTATION_HTTP_CAPTURE_HEADERS_SERVER_REQUEST="User-Agent"
export
OTEL_INSTRUMENTATION_HTTP_CAPTURE_HEADERS_SERVER_RESPONSE="Content-Type"
Tutorial #2: Zero-Code Instrumentation in Python
Zero-code instrumentation with OpenTelemetry allows you to gather telemetry data without modifying your application code. This is achieved by attaching an OpenTelemetry Python agent to your application, which automatically instruments popular libraries and frameworks using a technique called monkey patching. Below, we’ll walk through the steps required to implement zero-code instrumentation for a Python application.
Step 1: Install the Required Packages
To begin, you’ll need to install OpenTelemetry’s distribution package and the necessary exporters. Use the following commands to install them:
pip3 install opentelemetry-distro opentelemetry-exporter-otlp opentelemetry-bootstrap -a install
- opentelemetry-distro installs OpenTelemetry’s API, SDK, and a default set of configuration options for easier setup.
- The opentelemetry-bootstrap -a install command scans your environment for installed packages and automatically installs the corresponding OpenTelemetry instrumentation libraries. For example, if you’re using Flask, it will install opentelemetry-instrumentation-flask to instrument your Flask application.
Step 2: Configure the Agent
The OpenTelemetry agent is highly configurable, and you can specify the telemetry exporters (e.g., for traces and metrics), service names, and endpoints for exporting telemetry data. Here are two ways to configure the agent: via command-line options or environment variables.
CLI Configuration
To configure the agent from the command line, you can run the following command:
opentelemetry-instrument
--traces_exporter console,otlp
--metrics_exporter console
--service_name my-python-app
--exporter_otlp_endpoint http://0.0.0.0:4317
python3 server_automatic.py
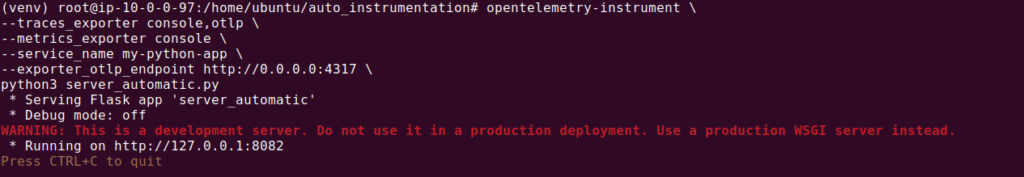
This command configures the agent to export traces and metrics to both the console and an OTLP (OpenTelemetry Protocol) collector at 0.0.0.0:4317, while running your application (xapp.py).
Environment Variable Configuration
Alternatively, you can configure the agent using environment variables, as shown below:
OTEL_SERVICE_NAME=my-python-app
OTEL_TRACES_EXPORTER=console,otlp
OTEL_METRICS_EXPORTER=console
OTEL_EXPORTER_OTLP_TRACES_ENDPOINT=0.0.0.0:4317
opentelemetry-instrument python xapp.py
This method is useful when you want to manage configurations externally or in environments where modifying CLI commands is not ideal.
Step 3: Run the Application
Once the agent is configured, you can run your Python application as normal, and telemetry data such as traces and metrics will automatically be collected and exported.
Managed Application Observability with Coralogix
Coralogix sets itself apart in observability with its modern architecture, enabling real-time insights into logs, metrics, and traces with built-in cost optimization. Coralogix’s straightforward pricing covers all its platform offerings including APM, RUM, SIEM, infrastructure monitoring and much more. With unparalleled support that features less than 1 minute response times and 1 hour resolution times, Coralogix is a leading choice for thousands of organizations across the globe.