From Trace to Root Cause: Mastering the new Trace Drilldown

I. The Invisible Cost of Tool-Switching
In a high-pressure incident, speed is everything. During incidents, engineers often jump between tools like traces, logs, and metrics, losing context at every step. This ruins the investigation state, slows down the process, and increases MTTR.
One Trace, Three Perspectives, One Investigative Flow
The Trace Drilldown is a new capability designed to eliminate this friction. It provides a side-by-side workspace that keeps the investigation in context. It maintains a consistent Action Bar across every view, giving users the ability to master a repeatable Find → Focus → Navigate workflow. The workflow is saved as users switch between Dependencies, Flame, and Gantt visualizations. Most importantly, the Drilldown brings Related Data (correlated logs, events, profiling, infrastructure, and AI Sessions) directly into the flow. This improves root cause justification without ever leaving the trace.
Side-by-Side Diagnostics
The Info Panel acts as a high-density sidebar, automatically surfacing metadata like span type, service, and performance context to identify an operation’s role without raw attribute hunting. An integrated duration heatmap visualizes the last 6–24 hours of performance, allowing you to instantly identify if a span is out of range compared to similar spans. This heatmap highlights field distribution to help you quickly spot anomalies or P90+ outliers compared to historical performance. Using integrated quick actions, you can pivot directly from the heatmap to create alerts or check resource-level infrastructure metrics for CPU or memory pressure.
II. The Trace Drilldown Window
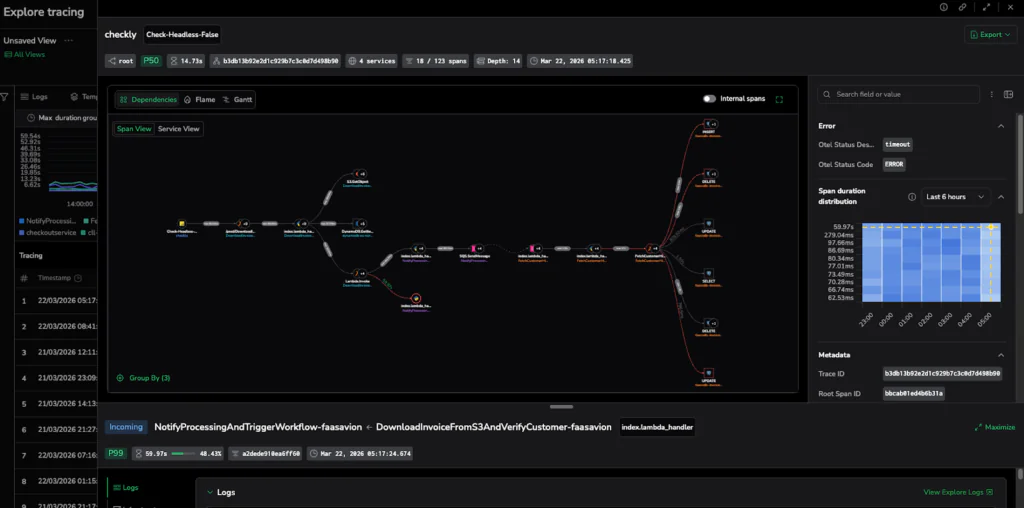
The Trace Drilldown transforms a static list of spans into a side-by-side, three-pillar workspace that keeps evidence, visuals, and metadata in a single frame.
- Visualize: Switch between Dependencies, Flame, and Gantt views to move from a high-level bottleneck map to a granular execution timeline without losing your place in the trace.
- Metadata Source of Truth: The Info Panel and headers provide immediate context on service, operation, and status. It provides context on spans so we can surface percentile context (e.g., P99). This allows for instantly determining outliers vs. expected behavior for that specific service.
- Real-World Context: Investigations often start with recurring errors from previous deployments. The Drilldown lets you isolate exact version and environment attributes, allowing you to focus on the current signal.
- Related Data: While a trace shows where a delay is, Related Data tells you why. Integrating correlated logs, events, profiling, infrastructure metrics, and AI sessions directly into the drilldown provides the necessary evidence to confirm a root cause.
III. Three Perspectives on Performance: A Deep Dive
Data is only as good as your ability to interpret it. The Trace Drilldown provides three distinct lenses (Dependencies, Flame, and Gantt) to analyze the same request. Knowing when to switch between them is the secret to cutting your MTTR.
1. Dependencies View
Use this first to map the request flow and find the specific service boundary where a handoff is failing or stalling.
The Dependencies view offers two modes of certainty:
- Service View: High-level architectural map. Perfect for spotting unnecessary fan-outs, extra hops, or slow service-to-service edges.
- Span View: The exact chain of operations behind those edges.
Pro Tip: Reading the Edges. Use Span Count to spot excessive repeated calls and Duration to find slow handoffs.
Caption: The Dependencies View reveals the architectural flow, highlighting the specific service-to-service handoff causing the stall.
2. Flame View:
Use this when you have identified a latency hotspot and need to determine which specific spans, operations, or downstream services are consuming the execution budget. Visualizing the trace in an aggregated hierarchy with the Flame view allows you to pinpoint exactly where time is being spent across your service boundaries.
To read a Flame graph, remember:
- Width = Duration: The wider the bar, the longer the span’s execution time.
- Y-Axis = Hierarchy: This shows the nesting of calls, allowing you to trace which operation or service triggered another.
- Focus on Hotspots: Coralogix groups tiny, frequent calls into gray merged blocks so you can focus on the dominant contributors to latency without being drowned out.
Pro Move: Turn on Highlight Errors, then scan for the widest horizontal bars that are also red. These are your dominant contributors to latency and failure.
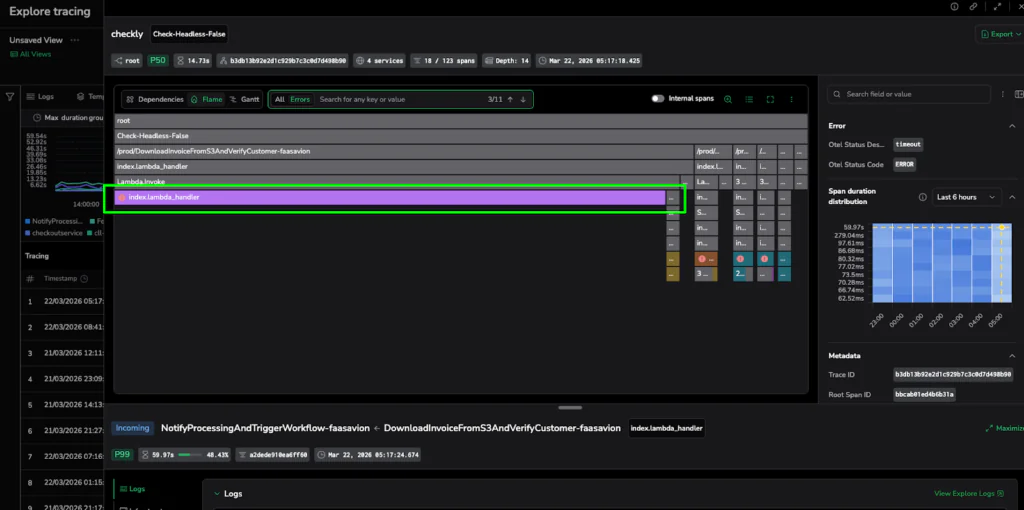
Caption: The Flame View isolates the latency hotspot: a single, wide purple bar representing a 60-second execution stall.
3. Gantt View:
When to switch: Use this to confirm the timeline. While Flame shows cost, Gantt shows the exact sequence and concurrency of events.
- X-Axis: True time progression from the start of the trace.
- Overlap: Indicates concurrency (tasks running at the same time).
- Gaps: These hint at retries, queueing, or blocked downstream calls.
Pro Move: If the Flame view suggests a hotspot, the Gantt view confirms if it’s a blocker. If a span has no overlap with others and is followed by a large gap, you’ve found a serial bottleneck that is stopping your entire request flow in its tracks. Use the Depth selector to instantly collapse or expand spans by their hierarchical level, allowing you to visualize the execution depth and manage the complexity of deeply nested traces.
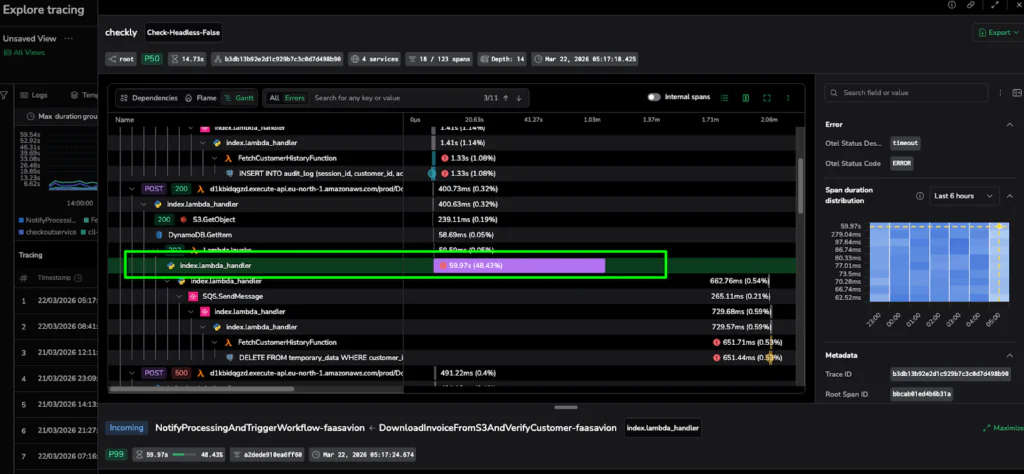
Caption: The Gantt View provides the timeline proof, showing exactly where the execution sequence stopped for nearly a minute.
V. Proving the Root Cause: The “Receipt” Section
Visualization identifies the suspect; correlated data provides the proof. The Trace Drilldown surfaces relevant telemetry in context so you can confirm the root cause without ever leaving the workspace.
Headers and Quick Actions
Trace and span headers function as interactive shortcuts that display critical data to help you orient yourself instantly. Headers for top trace and secondary span surface relevant details, such as service diversity, span count, and specific error statuses, to provide a rapid understanding of the request. Beyond visibility, they act as functional pivots. With a single click, you can jump to APM Service Maps, view surrounding Explore Logs, or refine your dataset using Include/Exclude without ever rebuilding a query.
Related Data Tabs
Access a direct line to evidence at the bottom of the drilldown:
- Events: Use this tab to understand what changed or what occurred during this span/trace by viewing events specifically emitted from the span.
- Logs: Use this tab to quickly understand what failed, and what happened right before it, without ever leaving the trace investigation flow.
- Profiling: Identify code-level bottlenecks at the service level when logs don’t explain high latency.
- Infrastructure: Validate if CPU pressure, restarts, or network issues contributed to the performance drop.
- AI Session: For GenAI workloads, view linked chat context, tool calls, and evaluation scores.
Pro Insight: An empty “Related Logs” tab is often a signal in itself, indicating missing correlation IDs in your instrumentation rather than a lack of data.
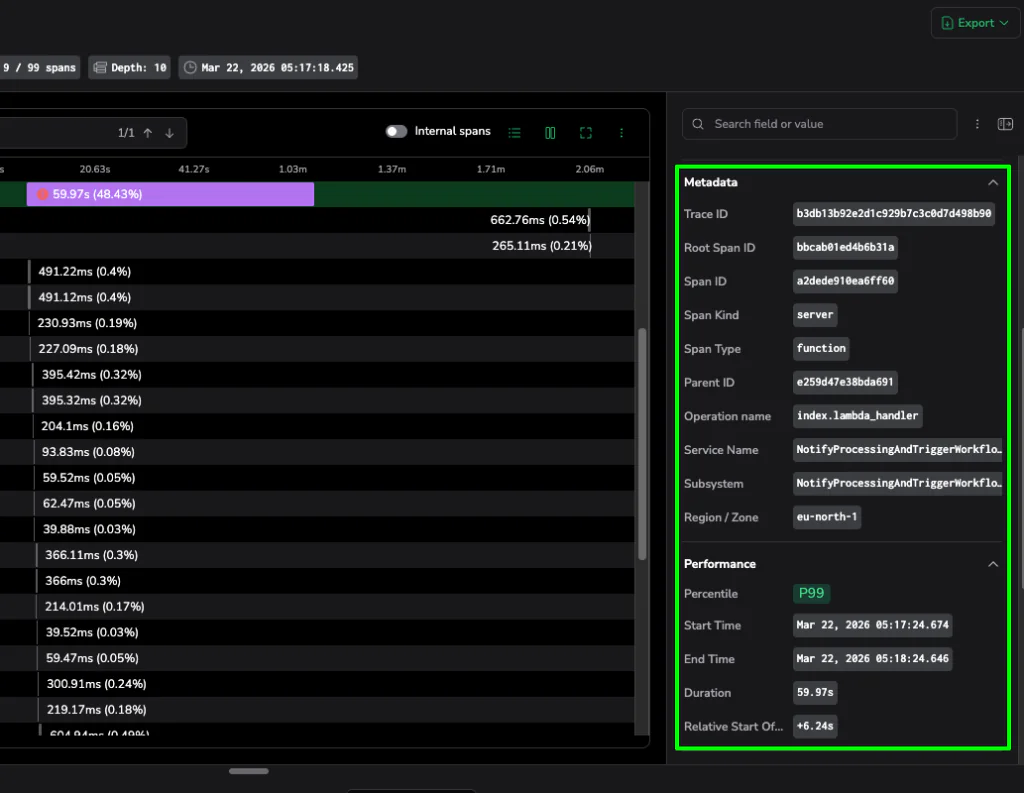
Caption: The Info Panel surfaces critical metadata like Trace IDs and P99 performance stats, providing the definitive evidence needed to solve the case.
VI. Conclusion: The Antidote to Cognitive Load
The Trace Drilldown is more than a UI update; it is a shift in incident response. Keeping evidence adjacent to the visual addresses the one thing that truly kills MTTR: fragmented context.
Bottom-Line Impact
- Faster MTTR: Automating the link between telemetry types helps start fixing. Pivoting from a metric to a trace and correlated logs provides full context without a single manual query.
- Reduced Cognitive Load: Integrating infrastructure correlation directly into the trace is significantly more efficient than tracking resource utilization data across disparate tools.
- Faster Onboarding: Junior engineers can identify the reason for a failure at the top level immediately, only drilling into technical layers when they have the context to do so.
Start Resolving Faster
This unified investigation experience preserves your investigation state across every pivot. With the Trace Drilldown, you will transform your incident response into a focused, efficient workflow. When the clock is ticking, Coralogix eliminates the noise and provides the clarity that you need the most.
To see how it works get a free trial now, or watch the demo below: