CI/CD pipelines have become a cornerstone of agile development, streamlining the software development life cycle. They allow for frequent code integration, fast testing and deployment.
Having these processes automated help development teams reduce manual errors, ensure faster time-to-market, and deliver enhancements to end-users. However, they also pose risks that could compromise stability of their development ecosystem.
This article will go over some common CI/CD pipeline security issues and how to effectively overcome them. Plus, learn how to identify vulnerabilities early in development to fully protect your organization’s data health.
CI/CD pipeline security risks
There are different threats that could impact your CI/CD pipeline. Such vulnerabilities can be determined and understood based on your pipeline design. Here’s some common CI/CD security risks to watch out for:
Insecure CI/CD pipeline configuration
Configuring a CI/CD pipeline securely is the first step to reducing risk to your data. While your setup will depend on which tools you use in the pipeline, there are best practices to securing the configuration, such as:
Restrict access control and permissions ensure unauthorized users cannot access or manipulate critical components of your data.
Know your CI/CD pipeline settings to protect you against bad actors. For example, setting your people to avoid insecure storage or network configurations will keep your pipeline from being exposed to external threats.
Set your code repositories to block unauthorized access, modification, or source code leakage.
Integrate external services securely, including cloud platforms, deployment targets and third-party tools.
Insecure code
Code vulnerabilities typically stem from using deprecated or insecure libraries. Bad actors can exploit these vulnerabilities to gain unauthorized access to software, inject malicious code, or execute arbitrary commands.
If undetected in the CI/CD pipeline, insecure code leaves your system vulnerable to data breaches, unauthorized access, and ransomware attacks that disrupt your software functionality.
Poisoned pipeline execution
Poisoned pipeline execution is a security risk in CI/CD pipelines where an attacker introduces malicious or compromised code, deploying unauthorized or harmful software components. This can happen at any pipeline stage, including in code repositories, build processes, testing, or deployment environments.
A common attack vector is to modify CI configuration files, adding additional commands to execute code in the CI stage. Once shipped code is executed, attackers can access secrets, ship malicious code, and access private servers or hosts.
Exposure of secrets
CI/CD pipelines can inadvertently expose secrets, such as API keys, database credentials, or encryption keys, leading to severe security breaches if obtained by malicious actors. Secrets can be exposed through:
Configuration files committed to version control or openly shared.
Environment variables misconfigured or mistakenly exposed in logs or error messages.
Build logs that are not adequately sanitized or redacted.
Pipeline output artifacts such as executable binaries or container images.
5. Breaches in test environments
Test environments sometimes receive a different level of security attention than production environments. They can contain unpatched systems, misconfigured security controls or other vulnerabilities to be exploited.
Breaches in test and development environments can also provide an entry point for bad actors. These external forces could gain unauthorized access and compromise the CI/CD pipeline components.
How to secure your CI/CD pipeline
Implementing pipeline security measures will mitigate CI/CD errors and risks listed above. Having a secure CI/CD pipeline lets you maintain integrity as data moves through your pipeline.
Furthermore, each CI/CD pipeline is unique and should include custom security measures, processes and tools. Here’s how to secure yours:
Enable observability to map threats
CI/CD security can be enhanced using a full-stack observability platform to monitor pipeline behavior. Observability platforms can provide out-of-the-box visibility and insights into the security posture of the pipeline, helping DevOps teams understand where vulnerabilities exist.
Observability tools build processes, test environments and deployment stages. Logs containing valuable security information, such as access attempts, system events or errors, are collected and parsed for real-time security analysis.
These tools can then detect and alert DevOps teams of security incidents, anomalies, or unauthorized activities. A comprehensive audit trail can also be established to help organizations meet regulatory requirements and adhere to security policies.
2. Employ tight access control
Use tight access control in CI/CD pipelines so that only authorized individuals and processes can access critical components. Here are some ways to make sure access control is set up securely:
Grant users and processes only the permissions necessary to perform specifically assigned tasks in the CI/CD pipeline. Permissions may be abused or compromised, so limit what could be accessed if an attack does occur.
Implement robust authentication mechanisms at all CI/CD pipeline points, such as multi-factor authentication or secure single sign-on. Use role-based access control to assign appropriate authorization to different user roles based on their needs.
Utilize secure credentials management using a trusted system like a key management system. Use strong password policies for read access. Regularly review and, when needed, revoke user and process access.
Using machine-learning-enabled observability tools, continuously monitor for unauthorized access attempts, abnormal activities, and unusual code behavior.
3. Use source composition analysis tools
Source Composition Analysis (SCA) is a security practice that analyzes and evaluates source code composition and dependencies within software applications. SCA identifies and manages the security risks associated with third-party and open-source components used in an application’s codebase.
SCA can identify any known vulnerabilities, licensing issues, or other security concerns that may arise from using third-party code. The tool examines the software’s dependencies, libraries, frameworks, and other external components to assess their security posture. Open-source and proprietary tools are available in CI/CD security implementations.
4. Enforce security policies
Security policies should be clearly defined and enforced for the CI/CD pipeline and software in general. These policies ensure the software is set up and maintained effectively to limit security exposures before they need to be detected in the CI/CD pipeline.
Remember security policies should cover everything from access control and coding best practices to vulnerability and risk management.
With over 7.3 million docker accounts created in 2021, Docker’s popularity has seen a meteoric rise since its launch in 2013. However, more businesses using it also means attackers are incentivized to target docker vulnerabilities.
As per a 2020 report, 50% of poorly configured docker instances were subjected to cyber-attacks. And it’s not that easy to spot these poor configurations either because you must conduct checks at multiple levels.
What if attackers create a Malware-laden container and upload it to your company’s data repositories due to these poor configurations? The business impact this untrusted container can cause is horrifying, isn’t it?
Consider adding container security to your DevOps pipeline if you’re using Docker to set up containers and portability easily. With the rising number of organization-level cyberattacks, container security needs to be part of your overall security framework.
What is Container Security?
From CI/CD pipeline, container runtime, and protecting applications running on containers, container security encompasses risk management throughout your environment. The process of docker container security is similar, but you have to address a few safety concerns.
A prerequisite to container security is observability. Container-based deployments can include tens or hundreds of services being spun up at a given instant. Thus, logging and monitoring across these multiple cloud and on-premise environments become serious challenges. You need to use a full-stack observability platform like Coralogix to get a complete picture of your containerized environment’s health.
After you have observability in place, using a robust set of container security best practices will help you in the long term, especially when your company looks to expand the dockers in the environment. Let’s look at some of the prominent ones for protecting containerized applications.
Container Security Best Practices
1. Using minimal and secure base images
Cloud developers often use a large number of images for their Docker containers. If your project doesn’t require system libraries and utilities, you must avoid using an entire OS as a base image. Let’s understand why.
Bundling images can increase the chances of vulnerabilities. We recommend you use minimal images with just the right number of libraries and tools sufficient for your project. By doing so, you are consciously cutting down the attack surface.
2. Securing Container Runtime
In an agile setup, securing container applications’ runtime is typically the developer’s responsibility. In case of a network breach, it is vital to configure the runtime settings to curb the damage immediately. Developers need to keep track of container engine runtime settings.
Kubernetes comes with built-in tools that enhance container security, such as:
Network policies – to finely control container behavior.
Admission controllers – apply rules customized for specific attack parameters.
Role-Based Access Control (RBAC) – fine-tune authorization policies at the cluster level.
Secrets – use the secrets management tool to store your credentials instead of saving them in container images or configuration files.
Falco – analyzes threats using its audit logging feature.
3. Securing Registries
In addition to ensuring docker container security, protecting the container infrastructure stack is equally essential. Registries (storage and distribution platforms for docker images) can act as a hub for vulnerabilities and malware.
As a safe practice, always provide role-based “need-to-know” access for any user that needs to access the registries.
4. Securing Container Orchestrators such as Kubernetes
Container orchestration means using tools to automate the operations associated with running containers. Orchestration platforms like Kubernetes help automate tasks like assigning specific nodes to containers and their efficient packing.
Although Kubernetes helps you manage container applications, it doesn’t secure the health of the underlying infrastructure. You must build observability at a full-stack level to keep track of system behavior.
To ensure real-time security, you need to leverage the log data stored by Kubernetes in the nodes. Forward these logs to a centralized observability platform like Coralogix, and you can now perform Kubernetes monitoring seamlessly.
5. Securing the build pipeline
You can create an additional security layer for your containerized applications’ CI/CD pipelines. Scan your container images during their entry into registries.
These checks help detect malicious code that slipped your security checks in the earlier stages of your build pipelines. How does this slippage happen?
Vulnerabilities may be absent at the source code stage but may enter as a part of dependencies as the code proceeds through the build pipeline. Tools like SAST or SCA, which perform checks at the source stage, may fail to detect these. Scanning at the registry stage improves the probability of detection of these vulnerabilities.
6. Securing deployment
Use these five steps to make your container deployment more secure:
Run third-party debugging tools like the static analysis on your Container code. This step identifies coding errors that lead to security issues.
Broaden your testing framework. In addition to testing functions, also cross-check dependencies and their associated vulnerabilities.
Destroy affected containers instead of patching them. This practice will help avoid the chances of manual errors.
Ensure your host system meets CIS benchmarks. The container software and orchestrator at the host need to satisfy this compliance standard to avoid insecure code.
Restrict container privileges. Enabling root privileges and flags allows attackers to gain control outside the container and stage an attack.
7. Monitoring Container Traffic
Container traffic involves the continuous collection of application metrics needed for their health and smooth operation. As a developer, you can identify irregular traffic patterns in your container patterns via API monitoring. You can trace connections between containers and external entities.
Another safety practice is by strengthening your defenses against traffic sniffing via Kubernetes. Enable Transport Layer Security (TLS) to authenticate user identities at both ends.
Default Kubernetes permit unrestricted traffic between pods. You can tighten the traffic by configuring network policies.
Improving Container Security with Coralogix
As your container environment grows, traditional monitoring just isn’t enough. With applications distributed across environments, full-stack observability fills in the blind spots of complex IT systems and their dependencies.
Coralogix ensures the security of collaborative containerized environments via real-time observability and data analytics capabilities. You can view application metrics from logs, traces, and metrics on a single centralized dashboard, ensuring hassle-free troubleshooting and security control.
Cloud services were born at the beginning of 2000 with companies such as Salesforce and Amazon paving the way. Simple Queuing Service (SQS) was the first service to be launched by Amazon Web Services in November 2004. It was offered as a distributed queuing service and it is still one of the most popular services in AWS. By 2006 more and more services were added to the offering list.
Almost 20 years later, Infrastructure as Code (IaC) emerged as a process to manage and provision cloud services, virtual machines, bare metal servers, and other configuration resources. Coding, as opposed to the usual clicking on the dashboard of the selected cloud provider, is now the preferred way of provisioning these resources. Treating infrastructure as code and using the same tools as in software application development appealed to the developers due to the efficiency of the building, deploying and monitoring applications and their infrastructure.
IaC has improved editing and distributing the infrastructure code files, as well as ensuring that the same configuration is shared across different environments without discrepancies between them. IaC files are also used for official infrastructure documentation. Some tools translate these files and produce architectural diagrams. Cloudformation Designer is a great example that comes as part of AWS Cloudformation service. Draw.io (with its Visual Studio Code integration) and Brainboard can also support the design of your IaC documentation.
Another important advantage is version control. The infrastructure files can now be committed and pushed to your favourite Control Version System (CVS), such as Git. As a result of IaC, development teams can integrate the infrastructure files in CI/CD pipelines and automate deploying the required servers, security groups, databases, and other cloud resources required for the goal architecture! This article provides an IaC introduction, explains the difference between Declarative versus Imperative approaches in IaC, discusses the benefits of IaC, where relevant tools are also listed, and finally speaks about IaC, DevOps and CI/CD.
Declarative vs. imperative approaches to IaC
Declarative or imperative are the two approaches for executing your Infrastructure as Code files. Both terms result in providing a set of instructions to the existing platform. Imperative systems are closer to the way our brain thinks and therefore it’s a set of commands that needs to be executed to achieve the final stage/goal. Programming languages, such as Java, Python, and .NET follow this approach too. Building tools, such as Chef and partially Ansible follow the imperative approach.
On the other hand, the declarative approach defines the desired state of the system e.g. resources you need, and specific configuration for these resources. This approach is also idempotent, which means that no matter how many times you will make an identical request, your system will consist of the exact same resources. AWS Cloudformation and Hashicorp Terraform are the leading IaC technologies using the declarative approach. However, it’s important to understand what is the original need of using Infrastructure as Code in the first place.
Benefits of IaC
After many years of managing and provisioning infrastructure manually, IaC arrived to change this non-efficient process, although it can be for any type of resources, such as cloud computing, data centres, virtual machines, and software components. Therefore, while the required software is released continuously to production daily, the infrastructure can also be adapted to the same frequency of deployment. IaC also helps with the increasing demand for scalability of your organization’s infrastructure. To add to the benefits, IaC helps with the infrastructure documentation and reduces the errors due to the embedded linting commands e.g., terraform plan.
Benefits:
Documentation
Automation
Cost reduction
More, even daily, deployments
Error elimination
Infrastructure consistency across different environments i.e. UAT, Stage, Prod.
Several tools have been developed to help teams with the efficient adoption of IaC.
IaC tools
Server automation and configuration management tools can often be used to achieve IaC. There are also solutions specifically for IaC.
In the most recent years, all these tools have incorporated the notion of automation. Avoiding manual work is what DevOps is aiming for. But where does IaC fit in with the CI/CD pipeline and DevOps?
IaC, CI/CD, and DevOps
As previously mentioned, IaC is recommended to be part of a CI/CD pipeline to enable automated deployments and make the development teams more efficient. CI/CD falls under DevOps and, more specifically under the pillar of automation.
CI/CD relies on ongoing automation and continuous monitoring throughout the application lifecycle, from integration and testing to delivery and deployment. Once a development team opts in for automating the infrastructure deployment, any manual intervention is cut off, usually by setting up the correct privileges for all team members. The manual configuration might be possible, but any manual change will not persist until the next automated IaC deployment.
The requirement for DevOps alignment between teams has to be met to achieve the benefits of IaC and hence avoid inconsistencies at different levels i.e., code, team communication, and deployments.
IaC helps with this alignment between various teams as they speak the same “language” of infrastructure as code.
IaC also removes the need to maintain individual deployment environments with unique configurations that can’t be reproduced automatically and ensure that the production environment will be consistent.
Conclusion
Infrastructure as Code is a concept that will remain due to the major benefits we have described above. There is currently a lot of ongoing work on the topic focusing on the expansion of IaC technologies. The most recent advancement is writing IaC in the language of preference i.e. Java, NodeJs, and more, as it is mainly written in YAML, JSON, or technology-specific (Hashicorp Configuration Language) files. So, the current focus is on keeping the benefits and making it simpler for more people to adopt.
According to the 2021 test automation report, more than 40% of companies want to expand and invest their resources in test automation. While this doesn’t mean manual testing is going away, there is an increased interest in automation from an ROI perspective – both in terms of money and time.
After all, we can agree that writing and running those unit test cases are boring. A good automation strategy can free up the tester’s time to tackle some of the more complex problems and help monitor logs with the early detection of bugs.
However, teams often rush to automate tests without a proper testing strategy, which causes things to break when there is an overhaul. Maximize your energy and return on investment by choosing the right tests to automate.
What should you consider before automating any test case?
1. Test Frequency
Writing that one manual test for an edge-case component is usually more efficient. Testing a new functionality allows you to learn more about the application quickly. However, that’s not effective as the number of functionalities increase.
Split your test scenarios into two sections: Ones that are repetitive and ones that are one-off or pretty complex.
Automate the ones that repeat the most. You can even set a threshold for the test frequency above, which you will consider automating.
For example, application login or alert system tests are ideal candidates for test automation since they must run after every application build.
There are a couple of exceptions to this rule, too – say, the volume of data entry a single test needs to execute is pretty significant. In that case, it makes sense to automate that specific test since it would save a lot of time.
The only caveat here is automating a series of repetitive tests that depend on each other. In case of a failure, it can be hard to pinpoint the exact test that is the main culprit. That’s where logs come in handy and help you efficiently detect these long-term pattern failures.
2. Test Coverage
Test coverage is crucial for software quality and ensuring the stability of your software build. Automating the right tests can aid your goal of achieving high test coverage with almost the same amount of time invested.
For example, running automated tests is a great idea if your application has many components. This bypasses the off-chance of a manual error of missing a specific test and ensures that the most critical parts of your application run smoothly. You can also run those lengthy overnight tests unattended and wake up to detailed logs of why your test failed (or worked!).
3. The Results
How predictable are the results? Automation requires pre-defined inputs and outputs to produce pass and fail conditions otherwise, they might lead to false outcomes.
If you’re in the exploratory stage of testing, and your tests are ad-hoc or require precise domain knowledge, automating them is not the best idea.
4. Feature Importance
If a project is an important feature that could disrupt the user experience if it fails, you should write an automated test suite. This way, you can safeguard against human errors messing up your release.
Ideally, the tests should be run on a continuous cycle so that relevant teams can be alerted as soon as possible.
5. Time-Reward Ratio
While automation frees up the tester’s time, organizations and individuals often overlook a crucial aspect of testing – the cost and time required to maintain the automated tests. If there are significant changes to the backend of your application, often writing and rewriting the code for automated tests is just as cumbersome as manual testing.
One interesting way to tackle this is for test engineers to automate just enough to understand which part of the program is failing. You can automate the broader application tests so that if something breaks, you know exactly where to look. Smart test execution, one of the top trends in the test automation space, does precisely this by identifying the specific tests that need to be executed.
6. Human Involvement
How complex is the test suite you’re trying to automate? If the test results need to be rechecked with a human eye or need to have actual user interaction, automating it probably won’t help a lot.
For example, user experience tests are best left unautomated because a testing software can never mimic human emotion while using a product. However, if you need visual confirmation on the test output, automated tests that take screenshots can run and later be manually verified.
7. Priority
When do you need the test results? If automating the tests helps you achieve a faster time to market the product, you should go ahead with it. However, don’t let writing and running automated tests be a bottleneck when you need the results immediately.
Also, you should remember that ‘tests’ are not the only thing that can be automated to make your application more efficient. Tasks such as manual data gathering or setting up data inputs also make great candidates for automation. So, if there’s a large dataset but you’re running low on time, automating it might be your savior!
Frequently Automated Test Cases
1. Performance tests (Load, stress tests)
Load tests are almost notorious for being the “overnight” tests. By definition, load tests require a lot of resources simply because they identify system lag and performance issues that arise when a company is scaling up.
That’s why tools that do automated testing make a lot of sense – because they can effectively simulate users and resources at a fraction of the cost. I mean, try finding 1,000 users to do bug testing on a product that hasn’t been released yet – yikes!
While you definitely can’t hire 1000 QA specialists to do automation testing, a testing automation framework can set up dummy users and have them interact with your product just as a real user would. This will enable you to scale and avoid outages by identifying them early in the process. Your team can then look into the performance metrics and determine the exact cause for the loss of speed or outage.
Similarly, if you need to do cross-browser testing, automated testing can help you gather your application’s performance across multiple configurations with just a few steps.
Automate your performance tests to see where things are breaking, and whether your application can handle those breaking points.
2. Unit Tests
If you are developing the codebase of a large application, automating the unit tests will save you time. Automating testing for unit tests will help you find errors in real-time by giving you a continuous overview of whether the individual components are working or not.
Automation is especially useful when you refactor your code since as long as the unit tests are green, you can safely assume that the behavior of individual units of code hasn’t changed. Moreover, the reports of these tests can be made available to the entire team instantly.
3. Regression Tests (Smoke, Sanity tests)
Regression tests ensure that the application runs smoothly even if many changes are made. That means several application components need to be re-tested repeatedly. Due to this repetition, regression tests are an ideal candidate for test automation.
Automating regression tests will help you save manual resources and time, and scale much faster. Although regression tests are usually performed at the end of a software release, automating them also gives you an option to run them iteratively and continuously. This helps identify bugs in the program faster and creates rapid feedback loops, thus leading to a quicker resolution.
4. Functional Testing
Functional testing verifies if an application functions the way it should on the front-end. Although some aspects of functional testing are manual, a lot of it should be automated to ensure bug-free product delivery.
For example, end-to-end testing automation ensures key predefined user experience flows run smoothly for products with daily releases.
Using selenium to automate functional testing is a popular choice. You can even tweak the tests with a slightly different data set or user behavior to cover multiple use cases.
Which tests should you definitely not automate?
1. Exploratory testing
Exploratory tests include a wider range of essential unscripted tests that are done on the fly. Typically, these tests require some domain knowledge and familiarity with the application to determine unexpected behavior. Since they are not very well defined, they cannot be automated.
Once a tester discovers a defect through exploratory testing though, those test actions can be documented and automated for future builds.
2. Usability Tests
As mentioned earlier, usability tests shouldn’t be automated because it’s hard to predict human behavior. This could range from wrong fonts, colors, or a UI that confuses people. You’ll only know these when you perform either beta or QA testing. Although there are tools that try to automate this, it is more effective (and less expensive) to get a human to look at it.
To Automate or Not To Automate
Test automation is crucial for an efficient CI/CD pipeline. A lot of innovation has been going on in the test automation space, such as parallel test execution, DevTestOps, IoT test automation, etc. These automation frameworks have helped drastically reduce the time to market for products and increase the build quality.
Choosing the right test to automate is just the first step to achieving that for your organization, so test faster, fail faster, and fix faster!
Coralogix is excited to announce the launch of our Stateful Streaming Data Platform that is now available on the Red Hat Marketplace.
Built for modern architectures and workflows, the Coralogix platform produces real-time insights and trend analysis for logs, metrics, and security with no reliance on storage or indexing. Making it a perfect match for the Red Hat Marketplace.
Built-in collaboration with Red Hat and IBM, the Red Hat Marketplace delivers a hybrid multi-cloud trifecta for organizations moving into the next era of computing: a robust ecosystem of partners, an industry-leading Kubernetes container platform, and award-winning commercial support—all on a highly scalable backend powered by IBM. A private, personalized marketplace is also available through Red Hat Marketplace Select, enabling clients to provide their teams with easier access to curated software their organizations have pre-approved.
After announcing the release of Coralogix’s OpenShift operator last year the move to partnering with the Red Hat Marketplace was a giant win for Coralogix’s customers looking for an open marketplace to buy the platform.
In order to compete in the modern software market, change is our most important currency. As our rate of change increases, so too must the scope and sophistication of our monitoring system. By combining the declarative flexibility of OpenShift with the powerful analysis of Coralogix, you can create a CI/CD pipeline that enables self-healing to known and unknown issues and exposes metrics about performance. It can be extended in any direction you like, to ensure that your next deployment is a success.
“This new partnership gives us the ability to expand access to our platform for monitoring, visualizing, and alerting for more users,” said Ariel Assaraf, Chief Executive Officer at Coralogix. “Our goal is to give full observability in real-time without the typical restrictions around cost and coverage.”
With Coralogix’s OpenShift operator, customers are able to use the Kubernetes collection agents to Red Hat’s OpenShift Operator model. This is designed to make it easier to deploy and manage data from customers’ OpenShift Kubernetes clusters, allowing Coralogix to be a native part of the OpenShift platform.
“We believe Red Hat Marketplace is an essential destination to unlock the value of cloud investments,” said Lars Herrmann, Vice President, Partner Ecosystems, Product and Technologies, Red Hat. “With the marketplace, we are making it as fast and easy as possible for companies to implement the tools and technologies that can help them succeed in this hybrid multi-cloud world. We’ve simplified the steps to find and purchase tools like Coralogix that are tested, certified, and supported on Red Hat OpenShift, and we’ve removed operational barriers to deploying and managing these technologies on Kubernetes-native infrastructure.” Coralogix provides a full trial product experience via the Redhat marketplace page.
This hands-on Flux tutorial explores how Flux can be used at the end of your continuous integration pipeline to deploy your applications to Kubernetes clusters.
What is Flux?
Flux is an open-source tool that enables you to automate your application delivery pipelines to Kubernetes clusters. Flux uses source control platforms like Git, enabling users to describe their desired application state. While it was originally developed by Weaveworks, it’s recently been open-sourced.
Flux has been rapidly growing in popularity, as it integrates into Kubernetes and is straightforward to set up. Much like the Terraform project, Flux enables DevOps engineers to deploy solutions to Kubernetes using a declarative configuration file. It’s simple to read and straightforward to update.
Additionally, the configuration files reside within your application’s existing source control platform, enabling a single point for all of your application’s code and configuration.
Why Use Flux?
Once deployed, Flux synchronizes the Kubernetes manifests stored in your source control system with your Kubernetes clusters. This in turn uses periodical polling updating the cluster when changes are identified.
This automated approach removes the need to run kubectl commands and monitor your clusters to see if they have deployed the correct configuration and workloads!
The key benefits of deploying Flux are as follows:
Your source control becomes a single source of the truth.
Your source control becomes a central place for all of your environments, and configurations which are defined in code.
All changes are observable and verified.
How Does Flux Work?
Before we jump into deploying Flux, let’s familiarize ourselves with how the platform works!
Flux configuration files are written in YAML manifests declaratively. These configuration files define everything required to deploy your application to your Kubernetes clusters. The steps for deployment & changes are as follows:
The team describes the Kubernetes cluster configuration and defines this in a manifest that resides in their source control platform which is normally git.
The memcached pod stores the running configuration.
Flux periodically connects to your source control platform and compares the running configuration from the memcached pod vs the source control manifest.
If changes are detected, Flux runs several kubectl apply and delete commands to bring the cluster in sync. The new running configuration is then saved to the memcached pod.
Flux can also poll container registries and update the Kubernetes manifest with the latest versions. This is very powerful should you wish to automate the deployment of new containers.
Deploying Flux
In this Flux tutorial, we are going to deploy PodInfo to our Kubernetes cluster, but you can convert what we are doing to suit your requirements.
We are now going to run through the process of deploying Flux and configuring the solution to achieve the above. Before we jump in, make sure you have access to your Kubernetes cluster and access to the cluster-admin role.
Note: We are assuming that your Kubernetes cluster is version 1.16 or newer and your kubectl binary is version 1.18 or newer.
Install FluxCTL
Flux provides a binary that is used to deploy and manage Flux on your Kubernetes clusters. The first step of this Flux tutorial is to get Flux installed so we can start deploying it to our Kubernetes cluster.
To install Flux we will run the following command on macOS (In this tutorial we are using brew which is a package manager for OSX).
To confirm you have installed Flux and it’s working run:
deklan@Deklans-MacBook-Pro ~ % Flux -v
You should get back the below:
deklan@Deklans-MacBook-Pro ~ % Flux -vFlux version 0.8.2deklan@Deklans-MacBook-Pro ~ %
Using Flux to Create a Repo & Configuration
Before we use Flux to deploy to our cluster, we need to have a repository with our Kubernetes configuration. In this step of the Flux tutorial, we are going to create a repo in Git and define our workspace and namespace within it. The Flux binary will take care of all of this for you. This tutorial expects that you have already got kubectl working and your cluster is connected.
First, let’s define our Github credentials for Flux to use to deploy your new repo and link it to your cluster.
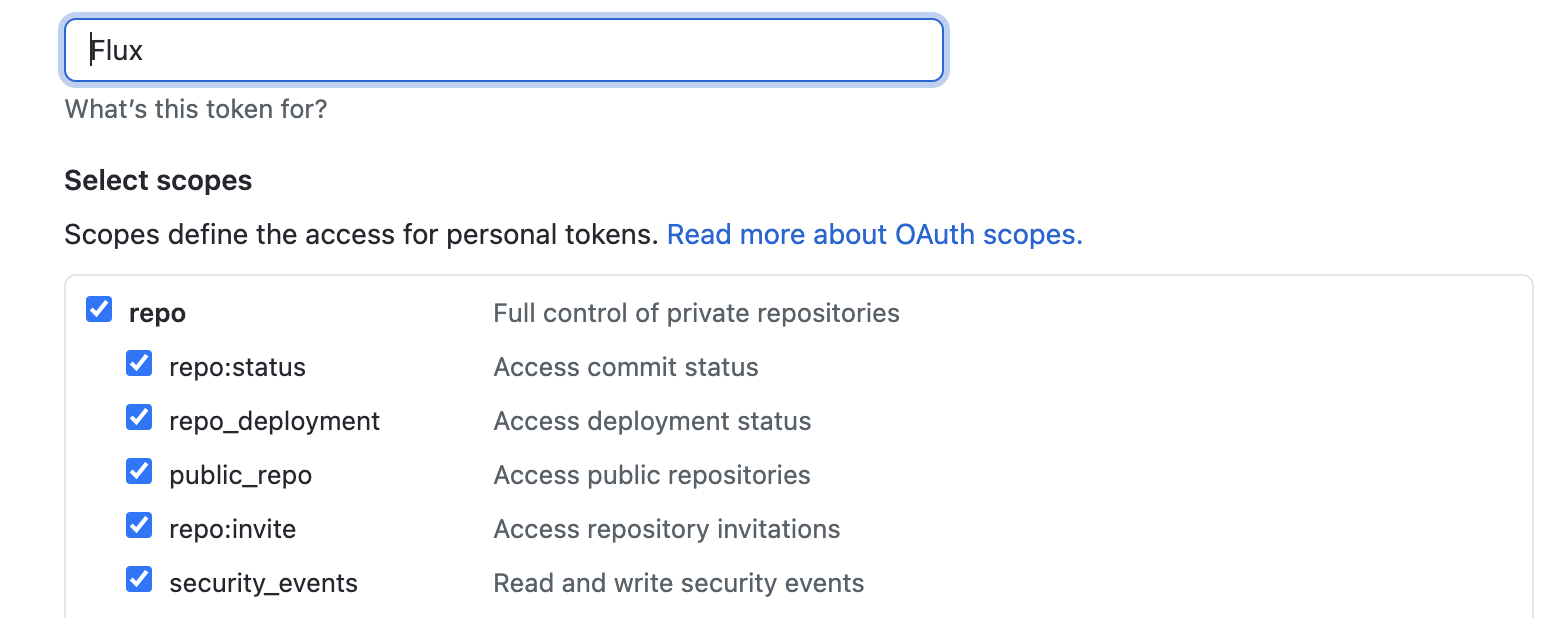
Generating a Github token is done on the Github site. Go to your profile and then select ‘Developer Settings’ on the left-hand side. From there select ‘Personal access token’ and then ‘Generate new token’. Flux requires the permissions below:
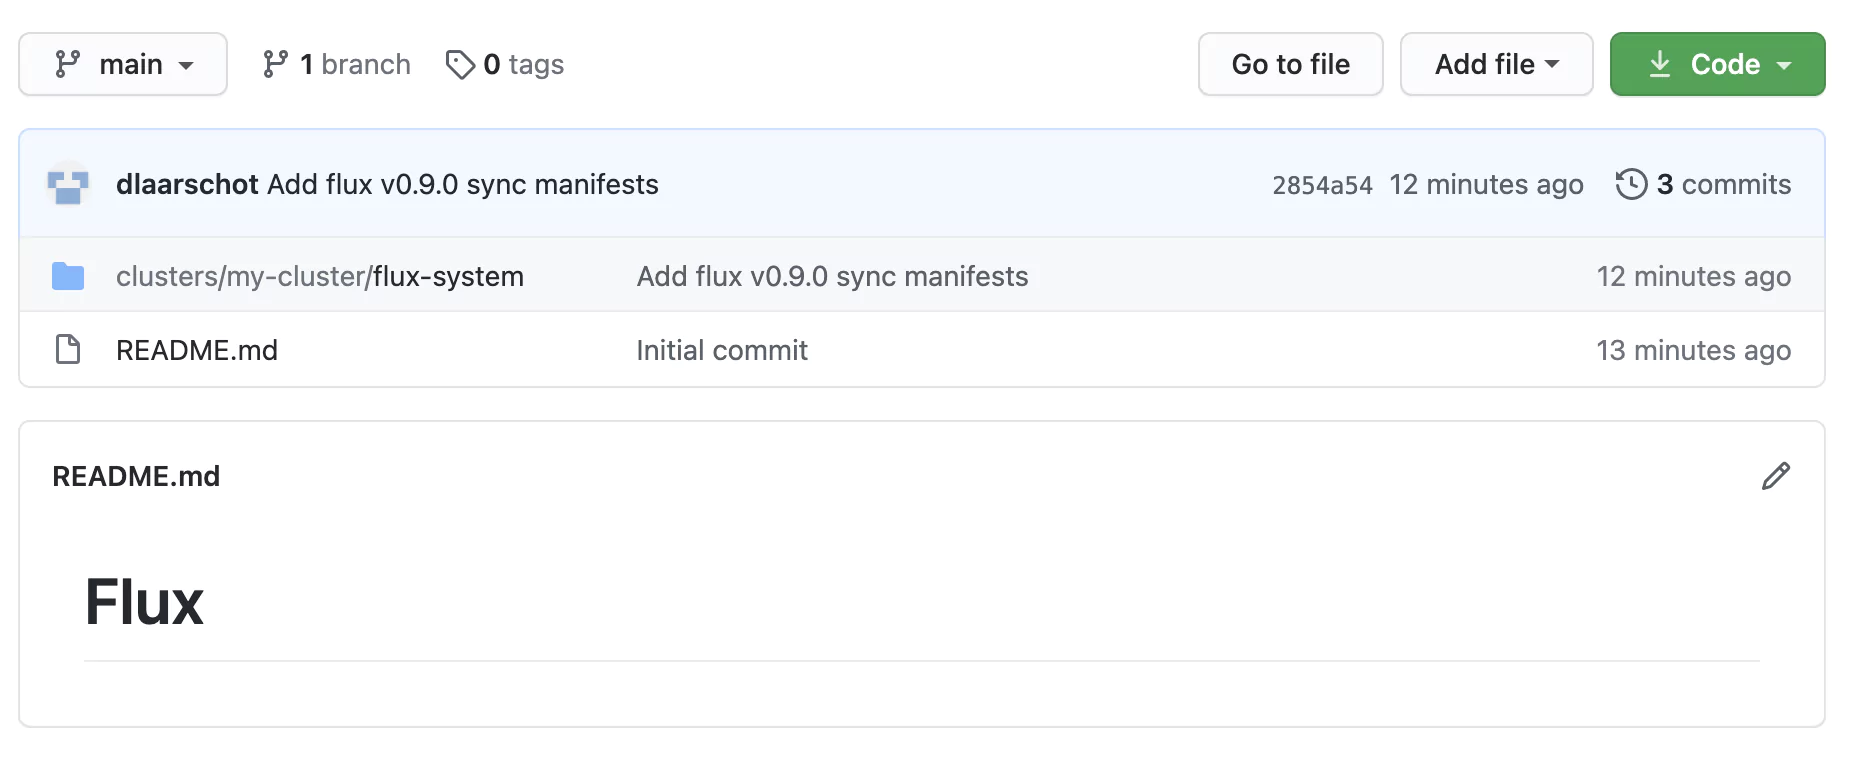
With your credentials loaded as environmental variables, we can now use the Flux command to create a repo, create configuration files and link them to your cluster. Run the below (modify the example to suit your requirements):
The Flux-system folder contains the configuration for the Flux service running on the cluster. When deploying a new application, you should create a new folder under your cluster name to house the manifest files. Also for multi-cluster setups (for example development and production), you will have separate <my-cluster> folders to house their respective configuration.
Deploying an Application
In this part of the Flux tutorial, we are going to deploy Podinfo. Podinfo is a tiny web application made with Go that showcases best practices of running microservices in Kubernetes. Now that we have a repo and it’s connected to our Kubernetes cluster using Flux, it’s time to build our configuration to define how our cluster should operate.
Add Podinfo Repository to Flux
Let’s deploy the Podinfo web app to the cluster. We will be using a public repository https://github.com/stefanprodan/podinfo.
Make sure you are in the base level of your local GitHub repository. Create a GitRepository manifest pointing to hello-kubernetes repository’s master branch:
Let’s commit and push it back to our remote GitHub repository so that Flux will pick it up and add it to our Flux running configuration:
git add -A && git commit -m "Add Hello-Kube GitRepository"
And then commit this to the remote repo:
git push
Deploy the Podinfo Application
Now we have the connection to the repository configured, it’s time to deploy the application. Next, we will create a Flux Kustomization manifest for podinfo. This configures Flux to build and apply the kustomize directory located in the podinfo repository. Using the Flux command run the following:
Flux will monitor the repository and detect the changes. It should take about 30 seconds for the new changes to be deployed. You can check using the following command (it will run the Flux get command every two seconds:
If we check our running pods using kubectl we can see that the application has been deployed and is running:
kubectl get pods NAME READY STATUS RESTARTS AGEpodinfo-65c5bdfc77-9zvp2 1/1 Running 0 94spodinfo-65c5bdfc77-pl8j7 1/1 Running 0 110s
Deploying an Operator
In this section of the Flux tutorial, we are going to deploy an operator to our cluster. Operators are extensions to Kubernetes that enable functions to support your applications. A great example of this is the Coralogix operator that enables log shipping from your applications. The advantage of using operators in Flux is that their configuration resides in your Flux repository providing a single source of the truth.
The example used in this Flux tutorial assumes you have an application configured ready for use with the Coralogix Kubernetes operator. We are going to use the Helm commandlet to deploy this operator.
Great! We now have the operator installed! This operator can be used to define your integrations with Coralogix in your application configuration. The advantage is a simple interface defined as code that can be included in your Git repository which configures any additional services your application may require. You can find out more about the Coralogix operator for Kubernetes, so that you can increase your system observability and enhance your Flux deployment.
Conclusion
When it comes to continuous integration and Kubernetes clusters, Flux is one of the most lightweight platforms available to declaratively define your Kubernetes configuration. Flux enables you to push code rather than containers, and with operators like the Coralogix cx-operator, you can build your entire stack in a YAML manifest.
The benefits include no learning curve for new engineers, a standardized deployment process, and a single source of the truth. Moreover, the Flux system is simple to use and provides the ability to sync multiple clusters for example development and production.
This Flux tutorial has covered the basics so go ahead and get building the GitOps way!
The widespread adoption of Agile methodologies in recent years has allowed organizations to significantly increase their ability to push out more high quality software. The new fast-paced CI/CD solutions pipeline and lightweight microservices architecture enable us to introduce new updates at a rate and scale that would have seemed unimaginable just a few years ago.
Previous development practices revolved heavily around centralized applications and infrequent updates that were shipped maybe once a quarter or even once a year.
But with the benefits of new technologies comes a new set of challenges that need to be addressed as well.
While the tools for creating and deploying software have improved significantly, we are still in the process of establishing a more efficient approach to troubleshooting.
This post takes a look at the tools that are currently available for helping teams keep their software functioning as intended, the challenges that they face with advances in the field, and a new way forward that will speed up the troubleshooting process for everyone involved.
Challenges Facing Troubleshooters
On the face of it, the ability to make more software is a positive mark in the ledger. But with new abilities come new issues to solve.
Let’s take a look at three of the most common challenges facing organizations right now.
The Move from the Monolith to Microservices
Our first challenge is that there are now more moving parts where issues may arise that can complicate efforts to fix them quickly and efficiently.
Since making the move to microservices and Kubernetes, we are now dealing with a much more distributed set of environments. We have replaced the “monolith” of the single core app with many smaller, more agile but dispersed apps.
Their high level of distribution makes it more difficult to quickly track down where a change occurred and understand what’s impacting what. As the elements of our apps become more siloed, we lose overall visibility over the system structure.
Teams are Becoming More Siloed
The next challenge is that with more widely distributed teams taking part in the software development process, there are much fewer people who are significantly familiar with the environment when it comes to addressing problems impacting the products.
Each team is proficient in their own domain and segment of the product, but are essentially siloed off from the other groups. This leads to a lack of knowledge sharing across teams that can be highly detrimental when it comes time for someone to get called in to fix an issue stemming from another team’s part of the product.
More Changes, More Often
Then finally for our current review, is the fact that changes are happening far more often than before.
Patches no longer have to wait until it’s Tuesday to come out. New features on the app or adjustments to infrastructure like load balancing can impact the product and require a fix. With all this going on, it is easy for others to not be aware of these changes.
The lack of communication caused by siloes combined with the increase in the number of changes can create confusion when issues arise. Sort of like finding a specific needle in a pile of needles. It’s enough to make you miss the haystack metaphor.
In Search of Context
In examining these challenges, we can quickly understand that they all center around the reality that those tasked with troubleshooting issues lack the needed context for fixing them.
Developers, who are increasingly being called upon to troubleshoot, lack the knowledge of what has changed, by who, what it impacts, or even where to start looking in a potentially unfamiliar environment.
Having made the move to the cloud, developers have at their disposal a wide range of monitoring and observability tools covering needs related to tracing, logs, databases, alerting, security, and topology, providing them with greater visibility into their software throughout the Software Development Lifecycle.
When they get the call that something needs their attention, they often have to begin investigating essentially from scratch. This means jumping into their many tools and dashboards, pouring over logs to try and figure out the source of the problem. While these monitoring and observability tools can provide valuable insights, it can still be difficult to identify which changes impacted which other components.
Some organizations attempt to use communication tools like Slack to track changes. While we love the scroll as much as anyone else, it is far from a comprehensive solution and still lacks the connection between source and impact. Chances are that they will need to call in for additional help in tracking down the root of the problem from someone else on their team or a different team altogether.
In both cases, the person on-call still needs to spend significant and valuable time on connecting the dots between changes and issues. Time that might be better spent on actually fixing the problem and getting the product back online.
Filling in the Missing Part of the DevOps Toolchain
The tooling available to help identify issues are getting much better at providing visibility, including to provide on-call responders with the context that will help them get to the source of the problem faster.
Moving forward, we want to see developers gain a better, holistic understanding of their Kubernetes environments. So even if their microservices are highly distributed, their visibility over them should be more unified.
Fixing problems faster means getting the relevant information into the hands of whoever is called up to address the issue. It should not matter if the incident is in a product that they themselves built or if they are opening it up for the first time.
Reducing the MTTR relies on providing them with the necessary context from the tools that they are already using to monitor their environment. Hopefully by better utilizing our existing resources, we can cut down on the time and number of people required to fix issues when they pop up — allowing us to get back to actually building better products.
Software problems have a very real impact on your bottom line. Availability and quality are the biggest differentiators when people opt for a service or product today. You should be aware of the impact of your customers alerting you to your own problems. To make sure you don’t become an organization known for its bugs, you must understand the organizational changes required to deliver a stable service. If, as Capers Jones tells us, only as many as 85% of bugs are caught pre-release, it’s important to differentiate yourself with the service you provide.
The Problem
It’s simple to understand why you don’t want unknown bugs to go out to your customers in a release. To understand its impact, you need to define the impact of committing problematic code to release.
Problem 1: Your Customers’ Perception
No one wants to buy a tool full of software problems. You open yourself up to reputation risks. Poor reviews, client churn, lack of credibility. They give you a name for buggy releases. This has three very tangible costs to your business. First, your customers will cease to use your product or service. Second, any new customers will become aware of your pitfalls sooner or later. Lastly, it can have a negative impact on staff morale and direction. You run the risk of losing your key people.
Problem 2: The Road to Recovery
Once a customer makes you aware of a bug, you must fix it (or deal with the problem above). The cost of doing this post-production is enhanced with the time it takes for you to detect the problem, or MTTD (mean time to detect). As part of the 2019 State of Devops Report, surveyed “Elite” performing businesses took on average one hour or under to deliver a service restoration or fix a bug, against up to one month for “Low” performing businesses in the same survey. The problem compounds with time: the longer it takes to detect the problem, the more time it takes for your developers to isolate, troubleshoot, fix and then patch. Of all surveyed in the 2019 State of Devops Report, the top performers were at least twice as likely to exceed their organizational SLAs for feature fixes.
Problem 3: Releasing Known Software Problems
Releases often go out to customers with “known software problems” in them. These are errors that have been assessed to have little impact, and therefore are unlikely to affect the general release. However, this is just the coding and troubleshooting you’ll have to do later down the line, because you wanted to make a release on time. This notion of technical debt isn’t something new, but with many tech companies doing many releases per day, the compounded work that goes into managing known errors is significant.
The Solution
Organizations can easily deliver more stable releases to their customers. Analysis indicates that there are a number of things that can greatly enhance your own stability.
Solution 1: What Your Team Should be Doing to Limit Software Problems
Revisiting the State of Devops Report, we can see the growing importance of delivering fast fixes (reduced MTTD) is dependent on two important factors within your team.
Test automation is the “golden record” when it comes to validating code for release. It positively impacts continuous integration and continuous deployment. Automated deployment enhances these efficiencies.
“With automated testing, developers gain confidence that a failure in a test suite denotes an actual failure”
However, testing isn’t the whole solution. Errors will still make it through, and you need to know when they do.
Solution 2: How Coralogix Can Help Detect Software Problems
Coralogix’s advanced unified UI allows the pooling of log data from applications, infrastructure and networks in one simple view. Not only does this allow your developers to better understand the impact of releases on your system, as well as helping to spot bugs early on. Both of these are critical in reducing your RTTP, which leads to direct savings for your organization.
Coralogix also provides advanced solutions to flag “known errors”, so that if they do go out for release, they aren’t just consigned to a future fix pile. By stopping known errors from slipping through the cracks, you are actively minimizing your technical debt. This increases your dev team’s efficiency.
Lastly, Loggregation uses machine learning to benchmark your organization’s code’s performance, building an intelligent baseline that identifies errors and anomalies faster than anyone – even the most eagle-eyed of customers.
Are you building and deploying software manually and would like to change that? Are you interested in learning about building a Jenkins pipeline and better understand CI/CD solutions and DevOps at the same time? In this first post, we will go over the fundamentals of how to design pipelines and how to implement them in Jenkins. Automation is the key to eliminating manual tasks and to reducing the number of errors while building, testing and deploying software. Let’s learn how Jenkins can help us achieve that with hands-on examples with the Jenkins parameters. By the end of this tutorial, you’ll have a broad understanding of how Jenkins works along with its Syntax and Pipeline examples.
What is a pipeline anyway?
Let’s start with a short analogy to a car manufacturing assembly line. I will oversimplify this to only three stages of a car’s production:
Bring the chassis
Mount the engine on the chassis
Place the body on the car
Even from this simple example, notice a few aspects:
These are a series of pipeline steps that need to be done in a particular order
The steps are connected: the output from the previous step is the input for the next step
In software development, a pipeline is a chain of processing components organized so that the output of one component is the input of the next component.
At the most basic level, a component is a command that does a particular task. The goal is to automate the entire process and to eliminate any human interaction. Repetitive tasks cost valuable time and often a machine can do repetitive tasks faster and more accurately than a human can do.
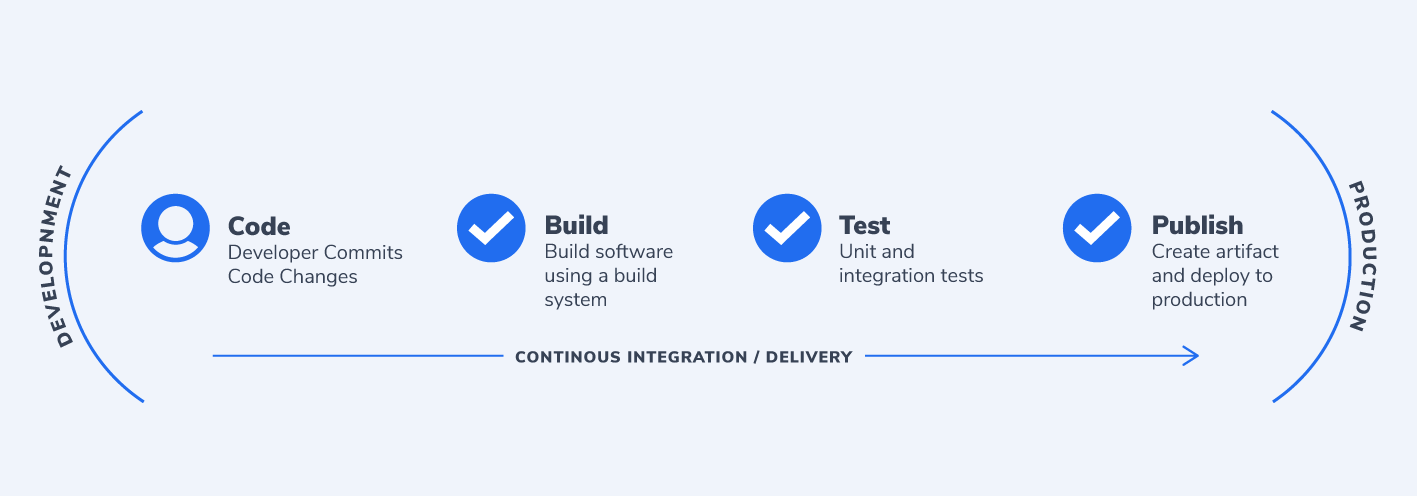
What is Jenkins?
Jenkins is an automation tool that automatically builds, tests, and deploys software from our version control repository all the way to our end users. A Jenkins pipeline is a sequence of automated stages and steps to enable us to accelerate the development process – ultimately achieving Continuous Delivery (CD). Jenkins helps to automatically build, test, and deploy software without any human interaction – but we will get into that a bit later.
If you don’t already have Jenkins installed, make sure that you check this installation guide to get you started.
Create a Jenkins Pipeline Job
Let’s go ahead and create a new job in Jenkins. A job is a task or a set of tasks that run in a particular order. We want Jenkins to automatically execute the task or tasks and to record the result. It is something we assign Jenkins to do on our behalf.
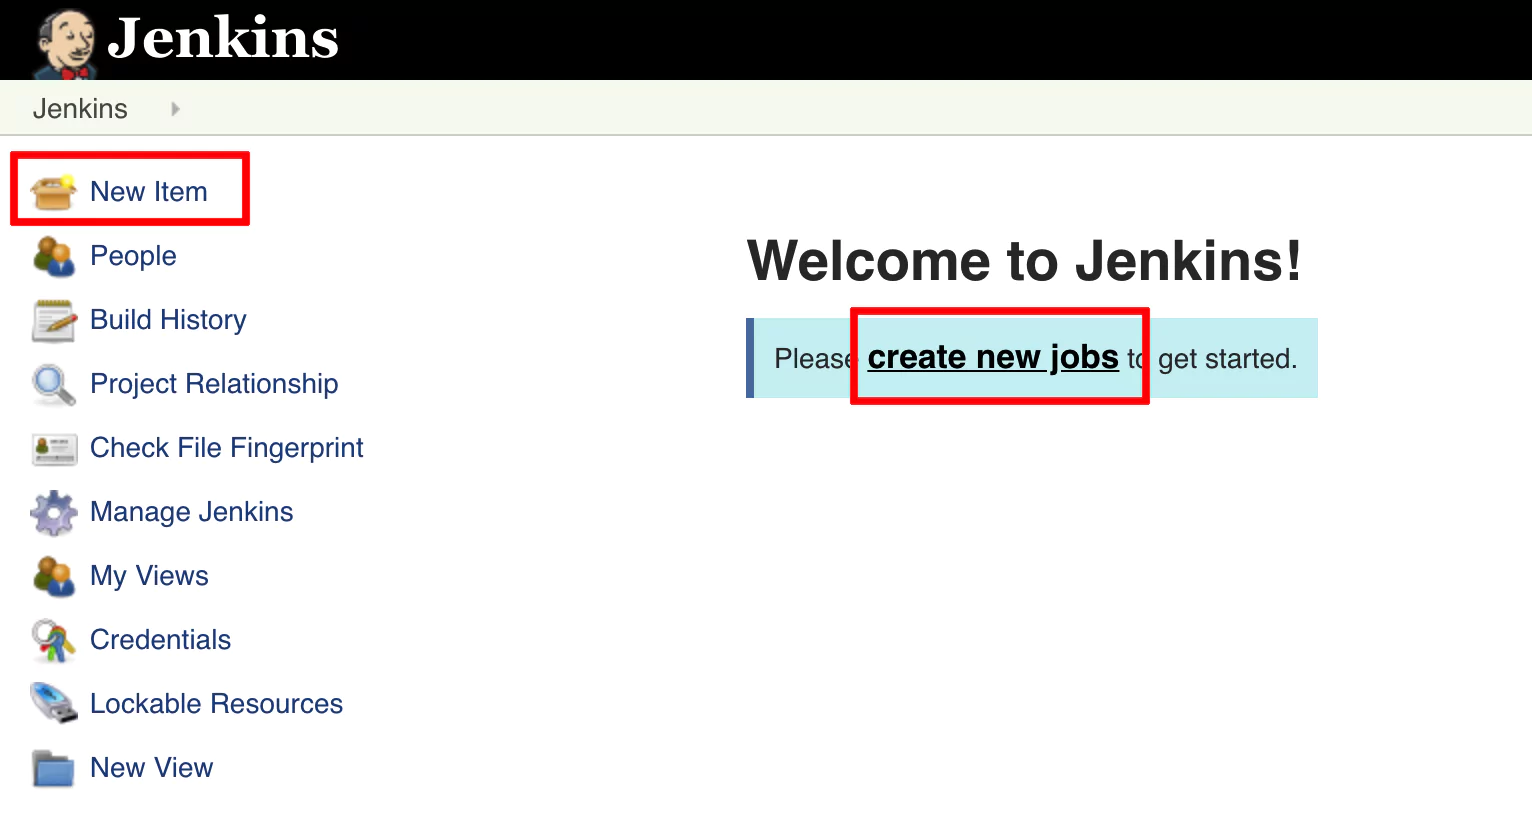
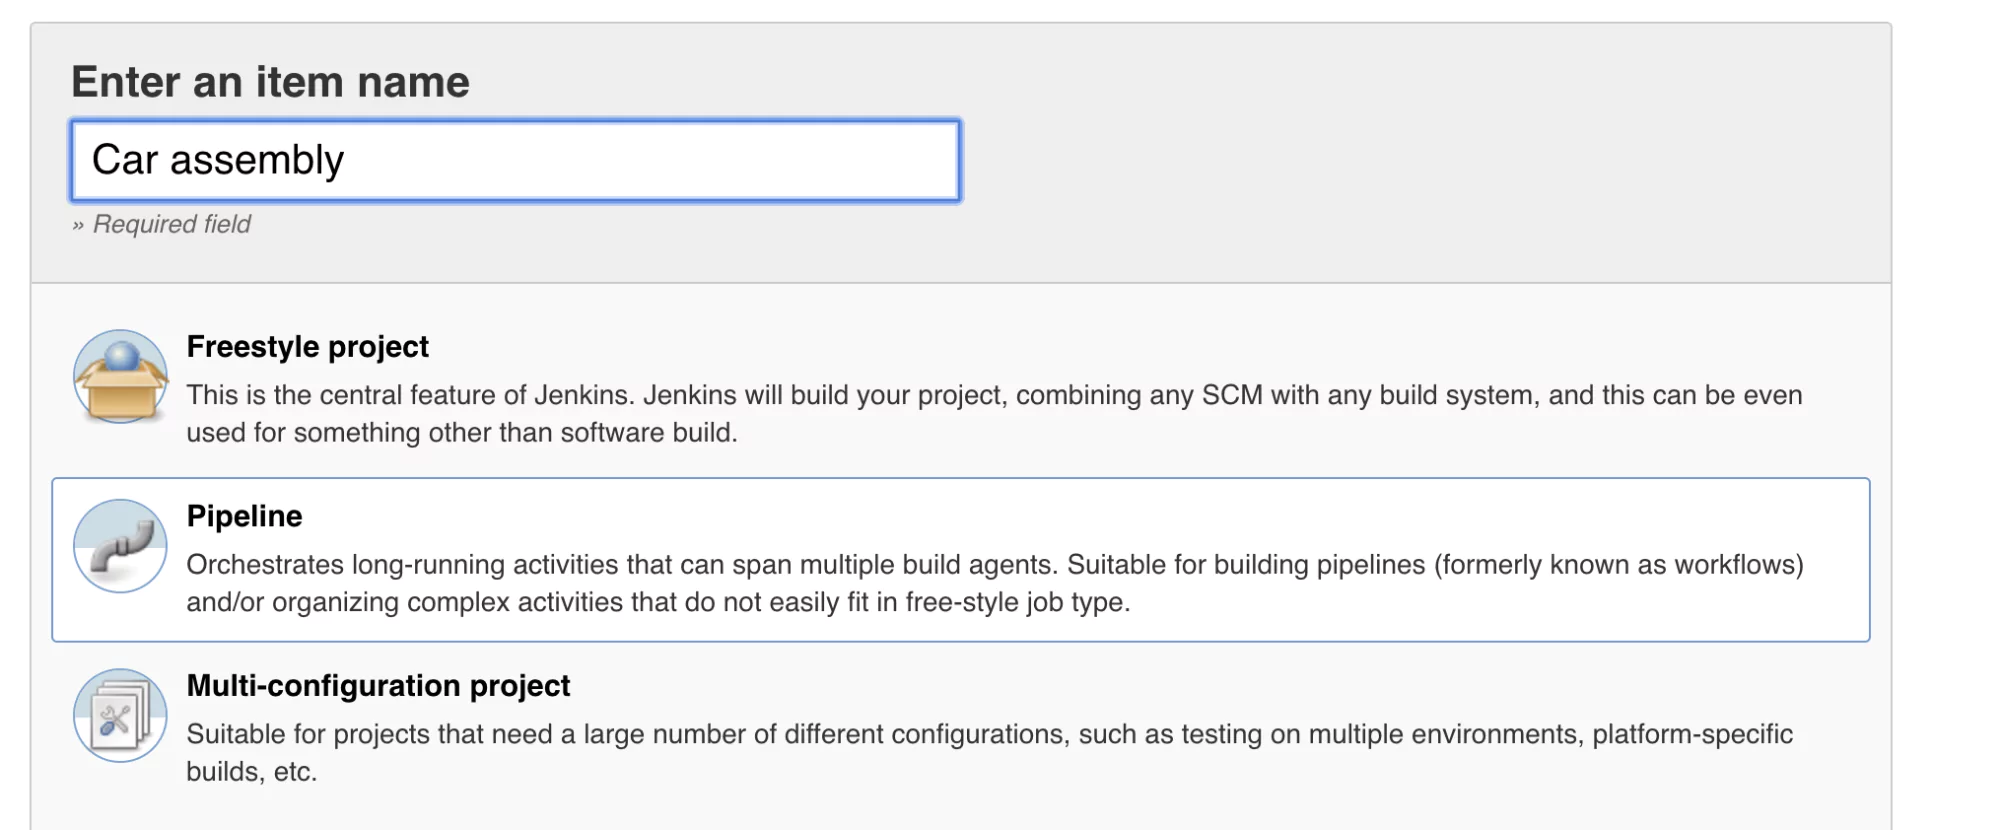
Click on Create new jobs if you see the text link, or from the left panel, click on New Item (an Item is a job).
Name your job Car assembly and select the Pipeline type. Click ok.
Configure Pipeline Job
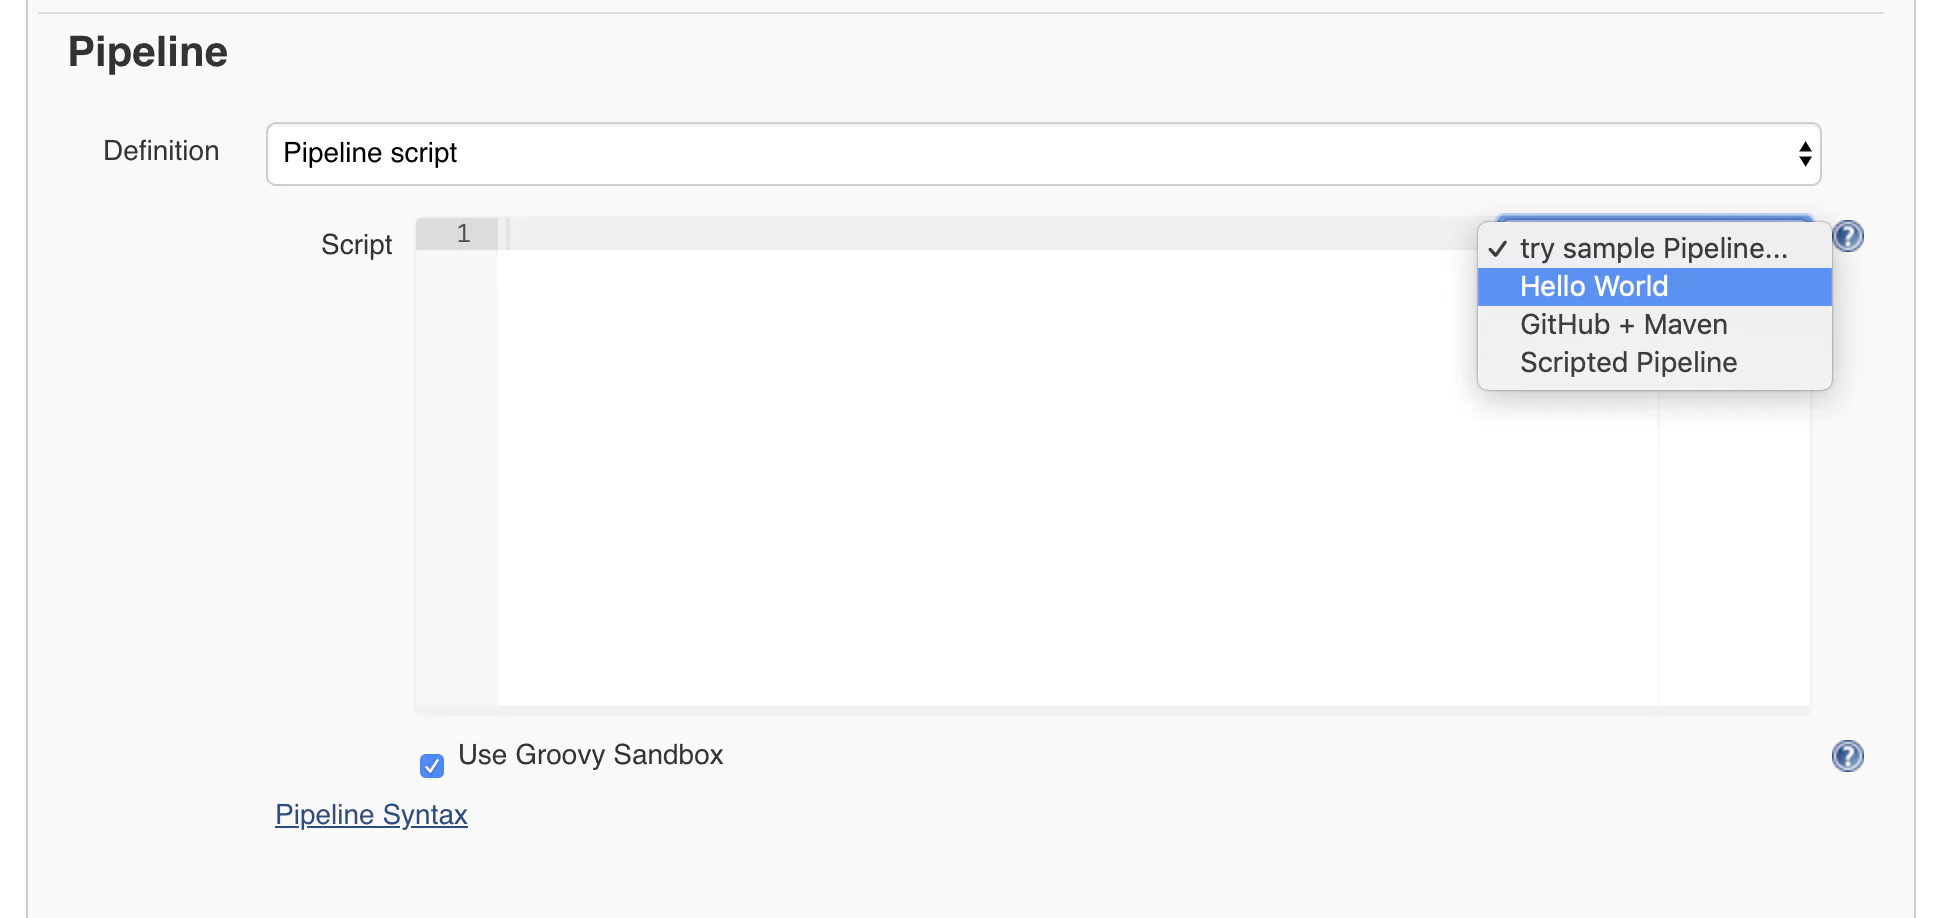
Now you will get to the job configuration page where we’ll configure a pipeline using the Jenkins syntax. At first, this may look scary and long, but don’t worry. I will take you through the process of building Jenkins pipeline step by step with every parameter provided and explained. Scroll to the lower part of the page until you reach a part called Pipeline. This is where we can start defining our Jenkins pipeline. We will start with a quick example. On the right side of the editor, you will find a select box. From there, choose Hello World.
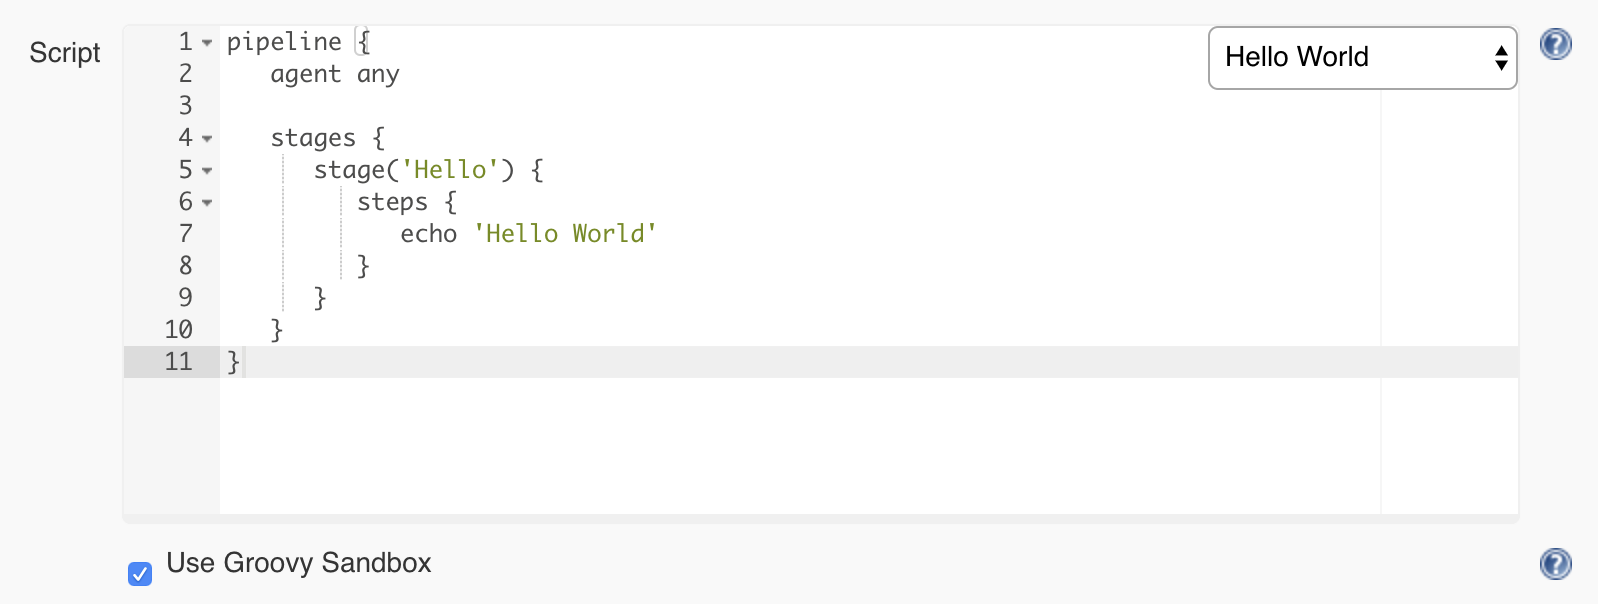
You will notice that some code was generated for you. This is a straightforward pipeline that only has one step and displays a message using the command echo ‘Hello World’.
Click on Save and return to the main job page.
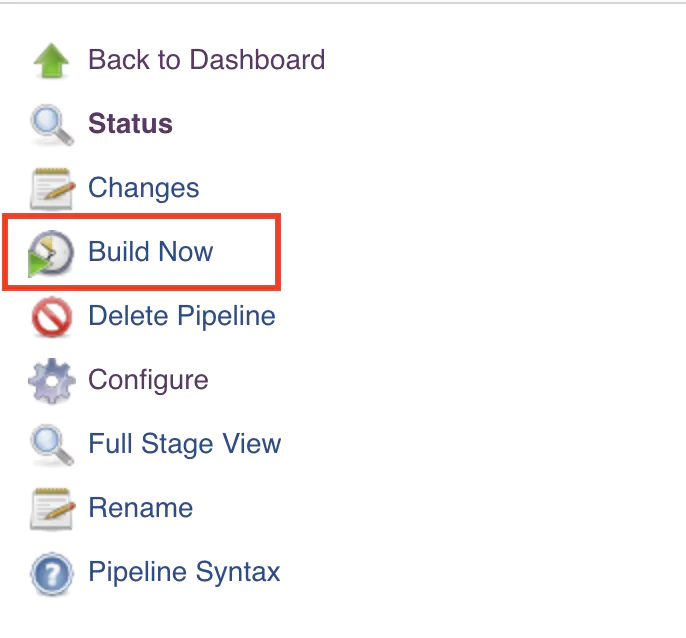
Build The Jenkins Pipeline
From the left-side menu, click on Build Now.
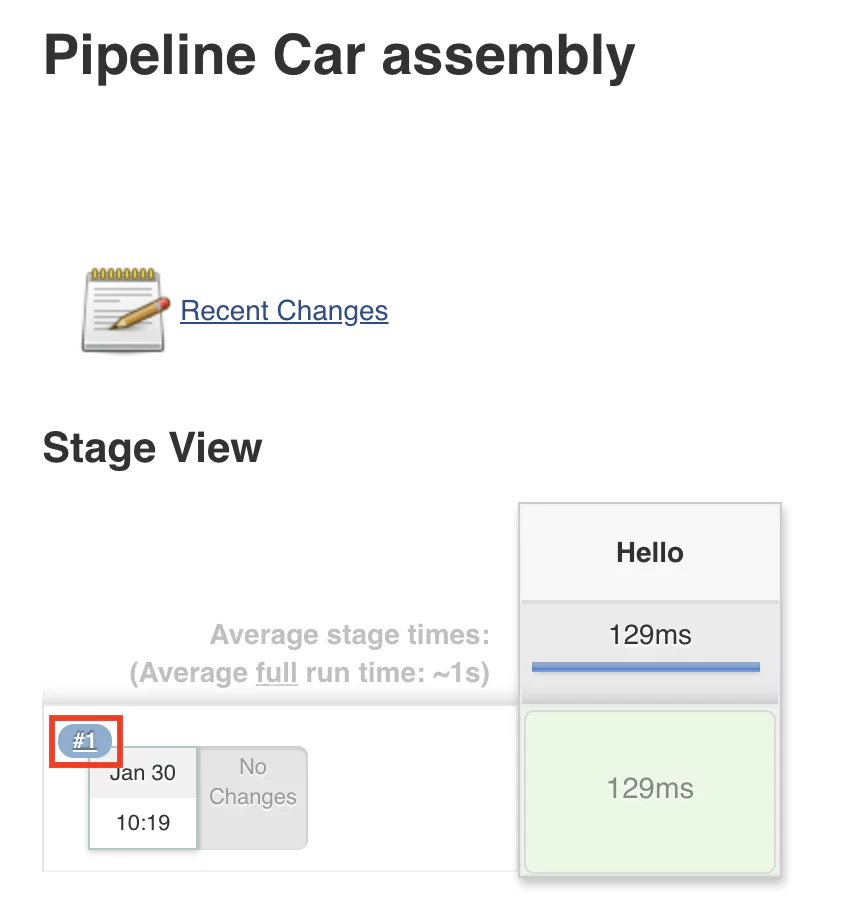
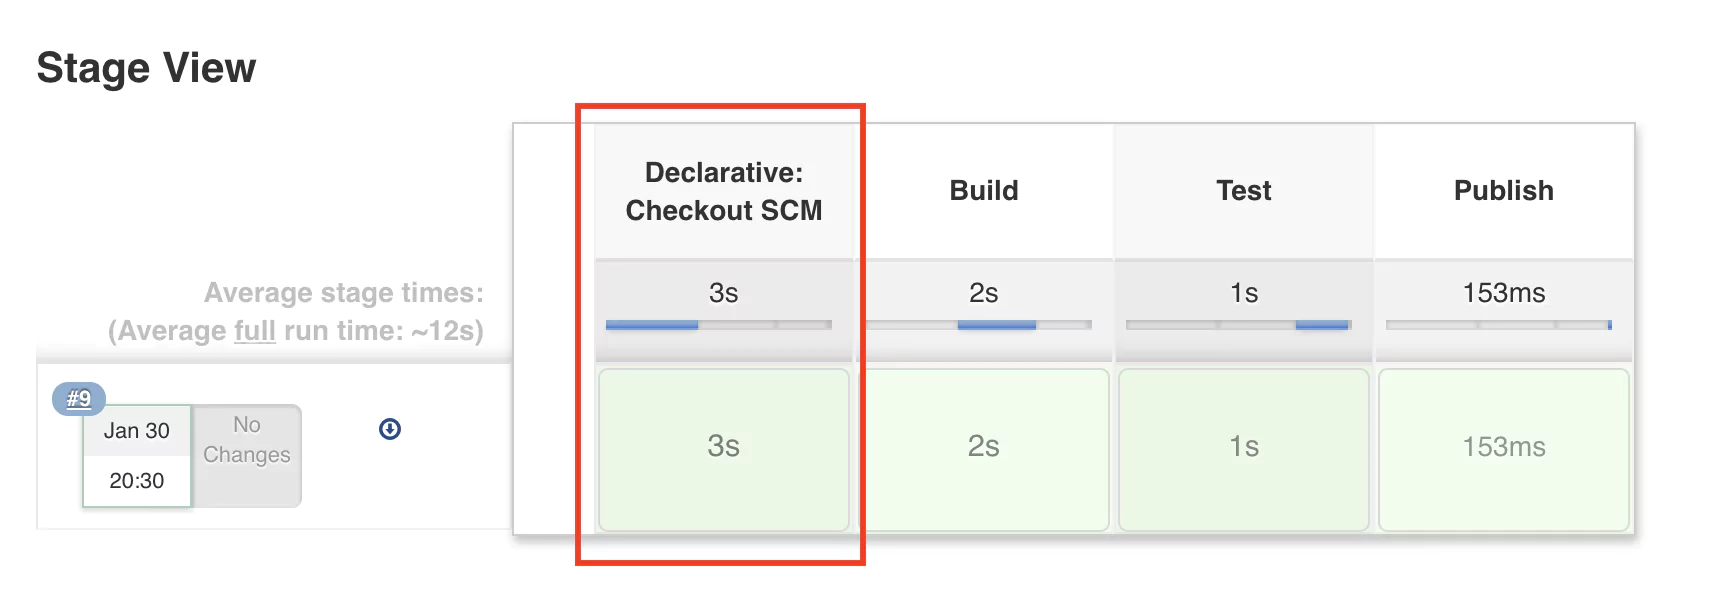
This will start running the job, which will read the configuration and begin executing the steps configured in the pipeline. Once the execution is done, you should see something similar to this layout:
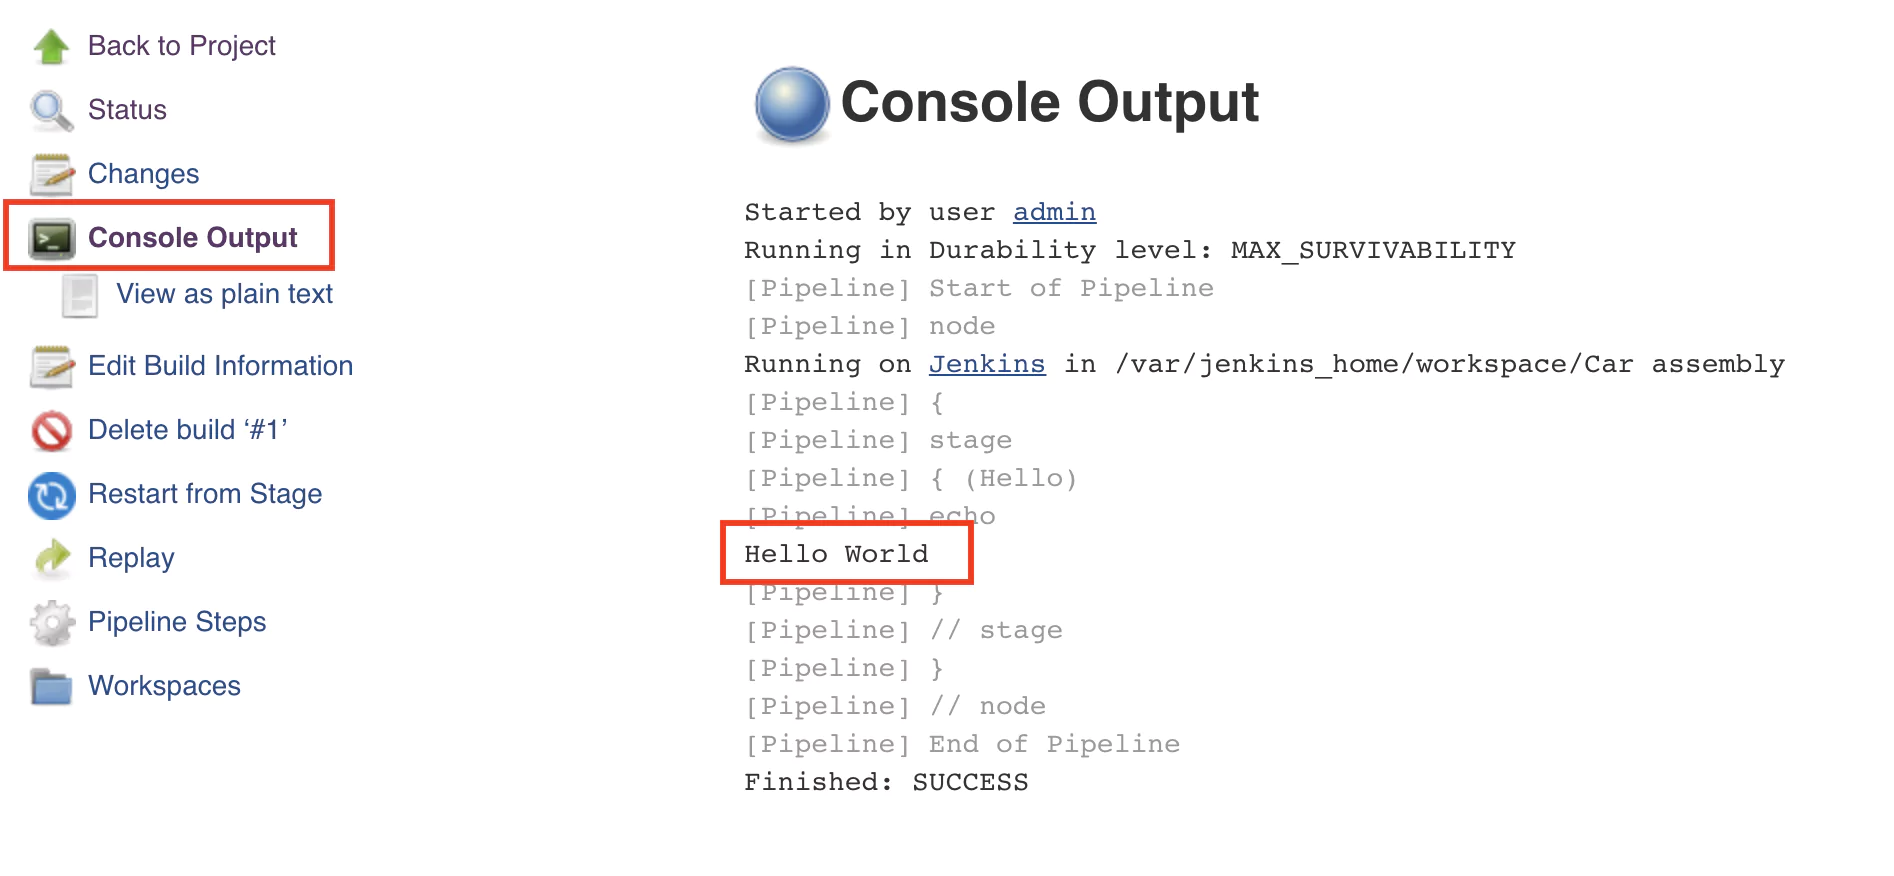
A green-colored stage will indicate that the execution was successful and no errors where encountered. To view the console output, click on the number of the build (in this case #1). After this, click on the Console output button, and the output will be displayed.
Notice the text Hello world that was displayed after executing the command echo ‘Hello World’.
Congratulations! You have just configured and executed your first pipeline in Jenkins.
A Basic Pipeline Build Process
When building software, we usually go through several stages. Most commonly, they are:
Build – this is the main step and does the automation work required
Test – ensures that the build step was successful and that the output is as expected
Publish – if the test stage is successful, this saves the output of the build job for later use
We will create a simple car assembly pipeline but only using folders, files, and text. So we want to do the following in each stage:
Build
create a build folder
create a car.txt file inside the build folder
add the words “chassis”, “engine” and “body” to the car.txt file
Test
check that the car.txt file exists in the build folder
words “chassis”, “engine” and “body” are present in the car.txt file
Publish
save the content of the build folder as a zip file
The Jenkins Build Stage
Note: the following steps require that Jenkins is running on a Unix-like system. Alternatively, the Windows system running Jenkins should have some Unix utilities installed.
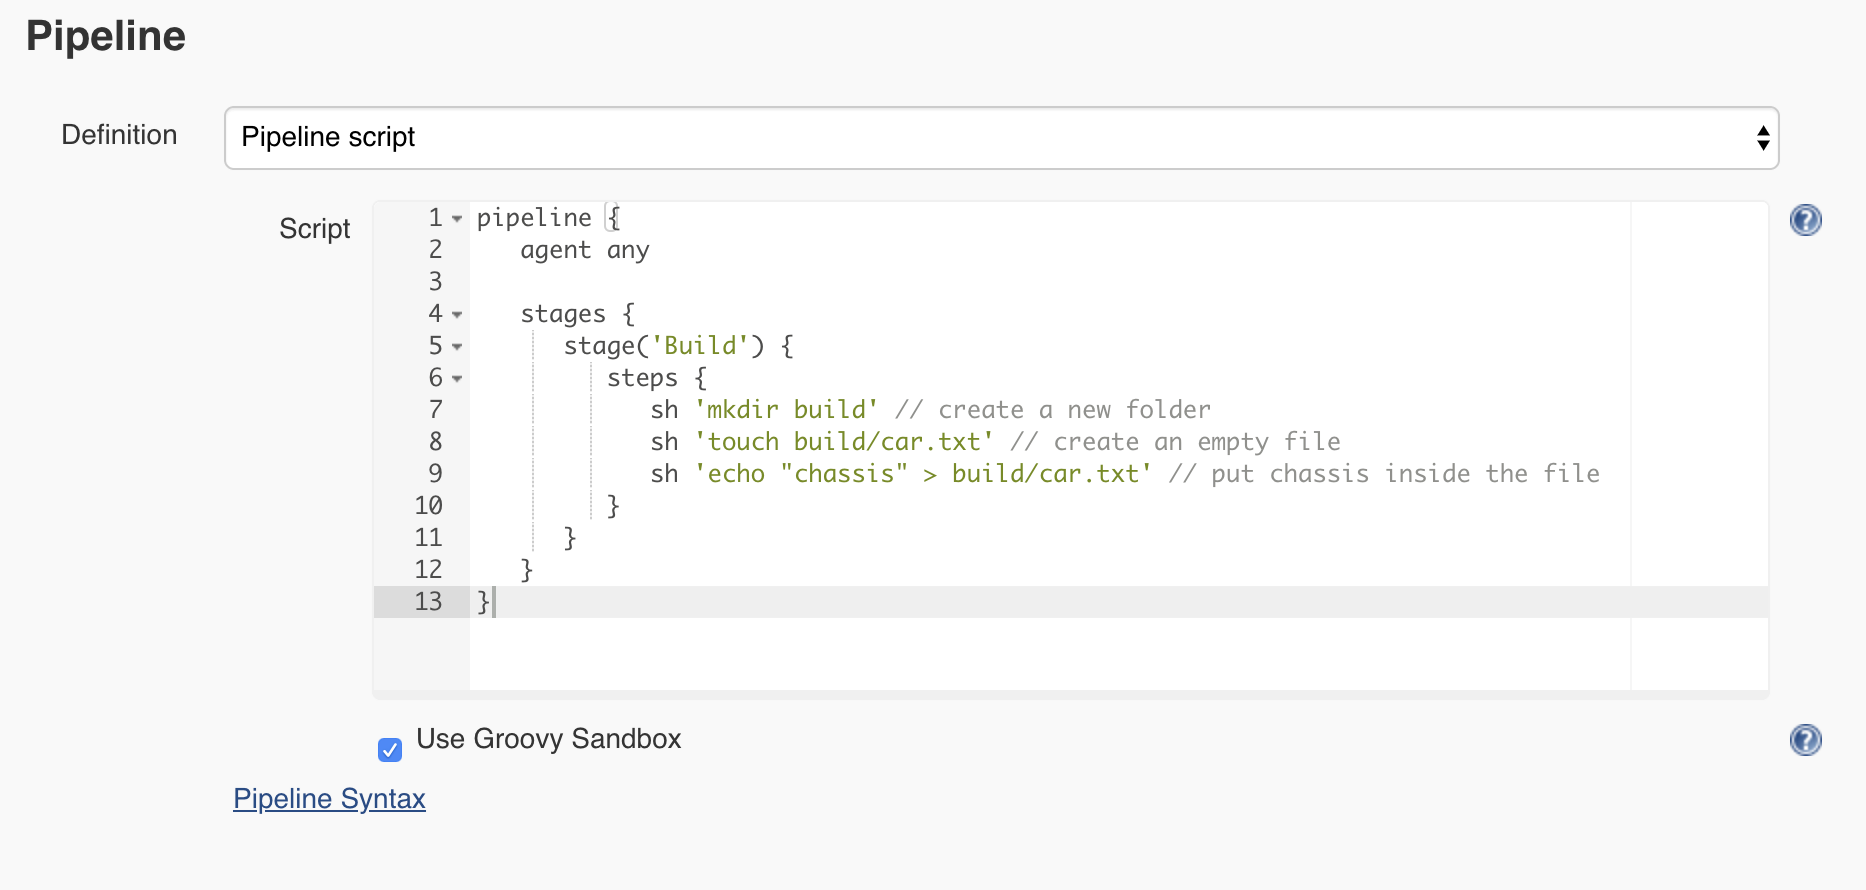
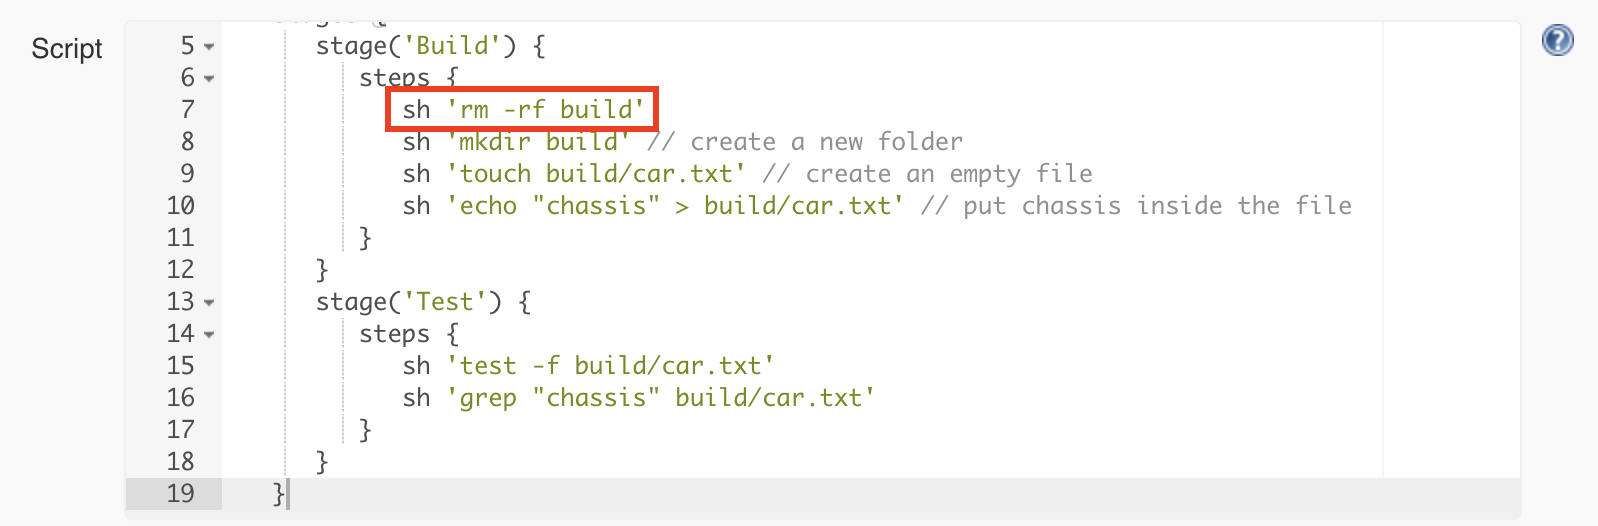
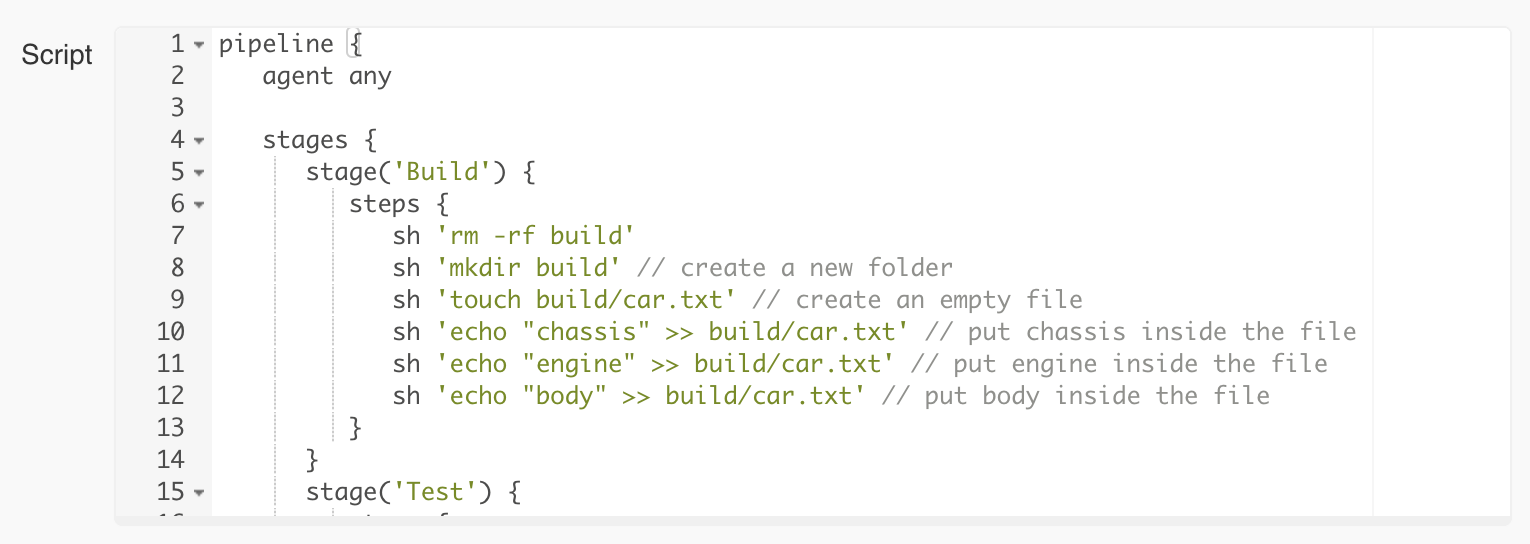
Let’s go back to the Car assembly job configuration page and rename the step that we have from Hello to Build. Next, using the pipeline step sh, we can execute a given shell command. So the Jenkins pipeline will look like this:
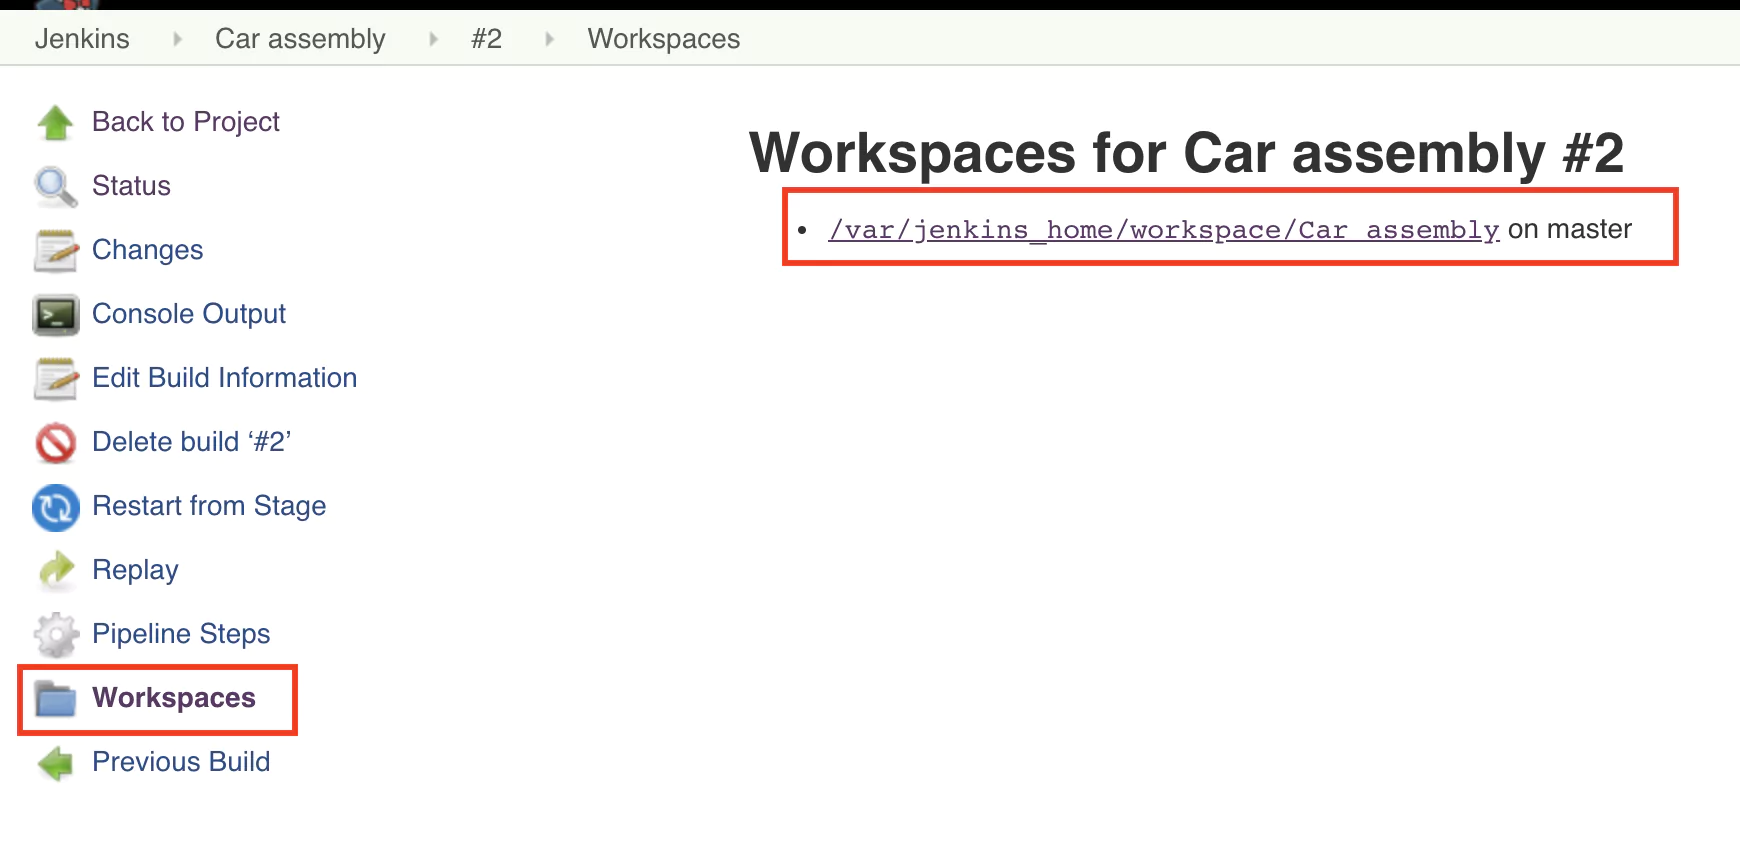
Let’s save and execute the pipeline. Hopefully, the pipeline is successful again, but how do we know if the car.txt file was created? Do inspect the output, click on the job number and on the next page from the left menu select Workspaces.
Click on the folder path displayed and you should soon see the build folder and its contents.
The Jenkins Test Stage
In the previous step, we manually checked that the folder and the file were created. As we want to automate the process, it makes sense to write a test that will check if the file was created and has the expected contents.
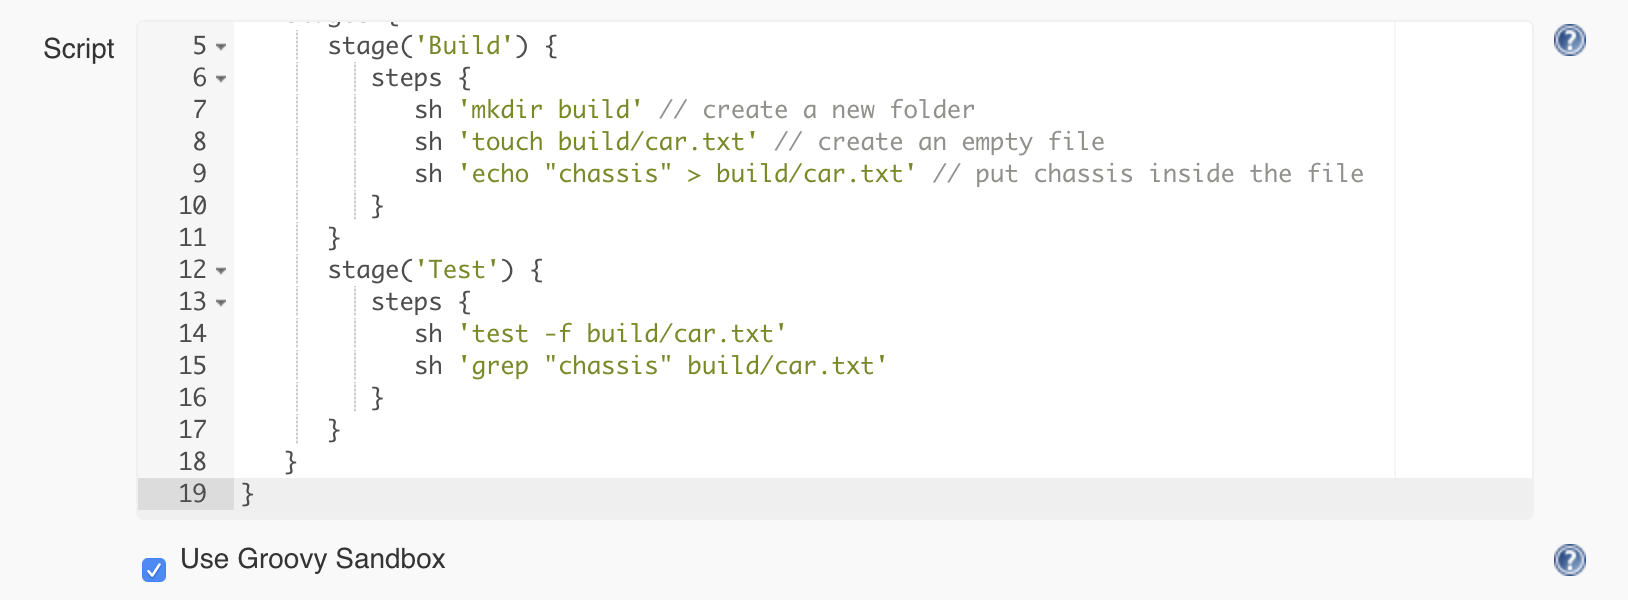
Let’s create a test stage and use the following commands to write the test:
the test command combined with the -f flag allows us to test if a file exists
the grep command will enable us to search the content of a file for a specific string
So the pipeline will look like this:
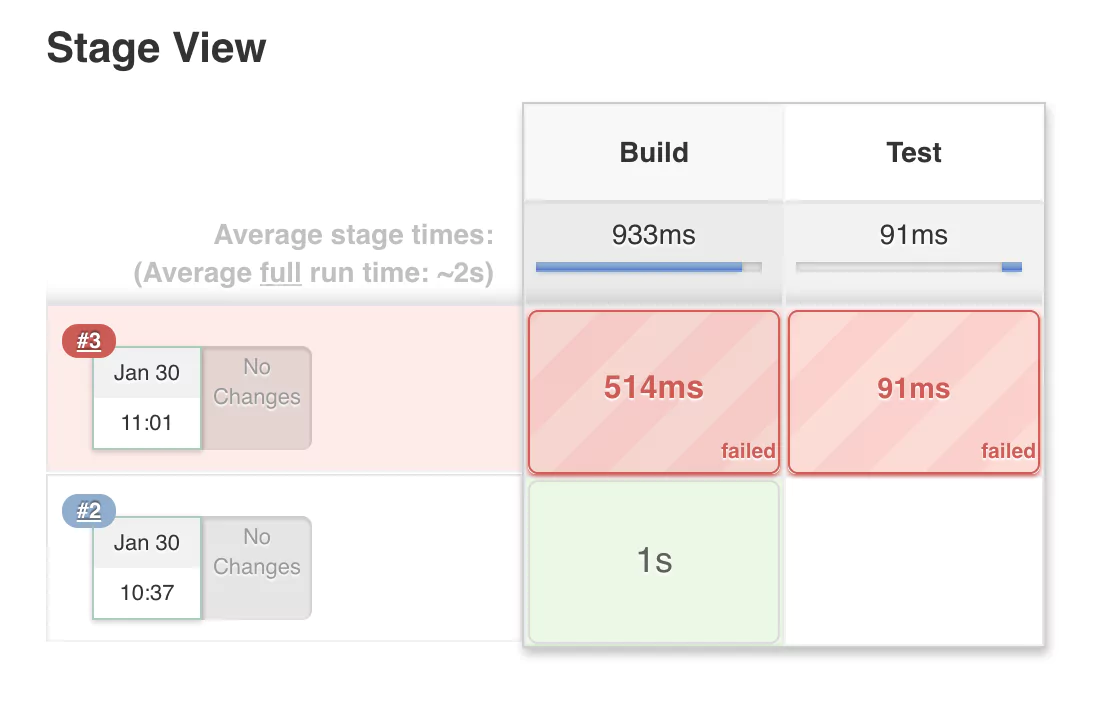
Why did the Jenkins pipeline fail?
If you save the previous configuration and run the pipeline again, you will notice that it will fail, indicated by a red color.
The most common reasons for a pipeline to fail is because:
The pipeline configuration is incorrect. This first problem is most likely due to a syntax issue or because we’ve used a term that was not understood by Jenkins.
One of the build step commands returns a non-zero exit code. This second problem is more common. Each command after executing is expected to return an exit code. This tells Jenkins if the command was successful or not. If the exit code is 0, it means the command was successful. If the exit code is not 0, the command encountered an error.
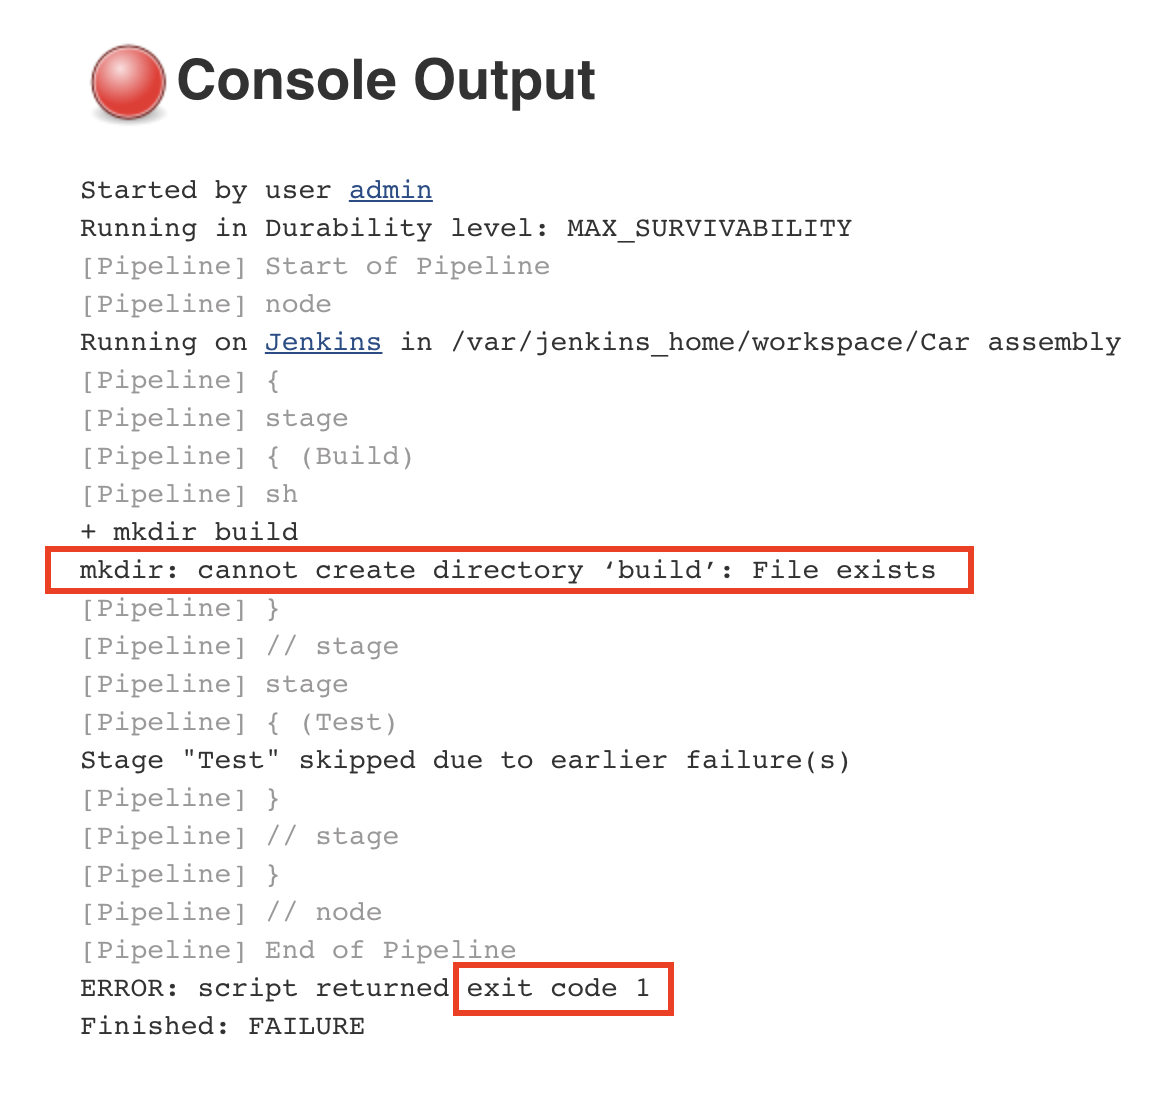
We want to stop the execution of the pipeline as soon as an error has been detected. This is to prevent future steps from running and propagating the error to the next stages. If we inspect the console output for the pipeline that has failed, we will identify the following error:
The error tells us that the command could not create a new build folder as one already exists. This happens because the previous execution of the pipeline already created a folder named ‘build’. Every Jenkins job has a workspace folder allocated on the disk for any files that are needed or generated for and during the job execution. One simple solution is to remove any existing build folder before creating a new one. We will use the rm command for this.
This will make the pipeline work again and also go through the test step.
The Jenkins Publishing Stage
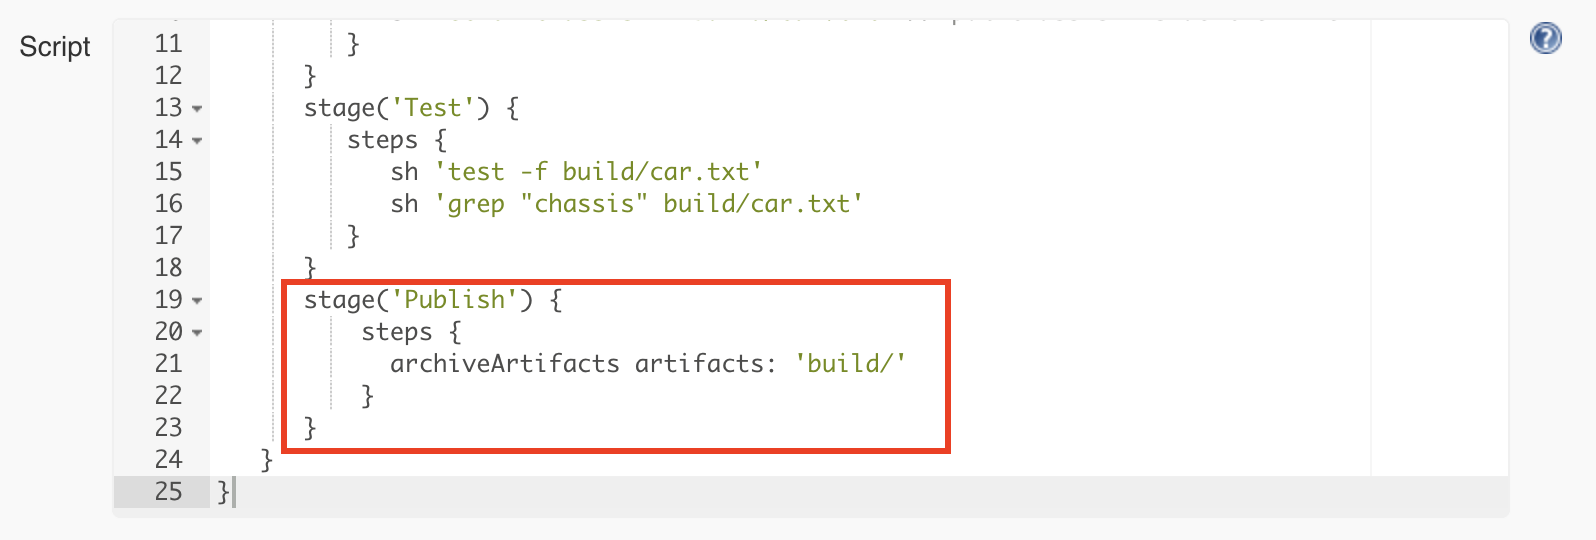
If the tests are successful, we consider this a build that we want to keep for later use. As you remember, we remove the build folder when starting rerunning the pipeline, so it does not make sense to keep anything in the workspace of the job. The job workspace is only for temporary purposes during the execution of the pipeline. Jenkins provides a way to save the build result using a build step called archiveArtifacts.
So what is an artifact? In archaeology, an artifact is something made or given shape by humans. Or in other words, it’s an object. Within our context, the artifact is the build folder containing the car.txt file.
We will add the final stage responsible for publishing and configuring the archiveArtifacts step to publish only the contents of the build folder:
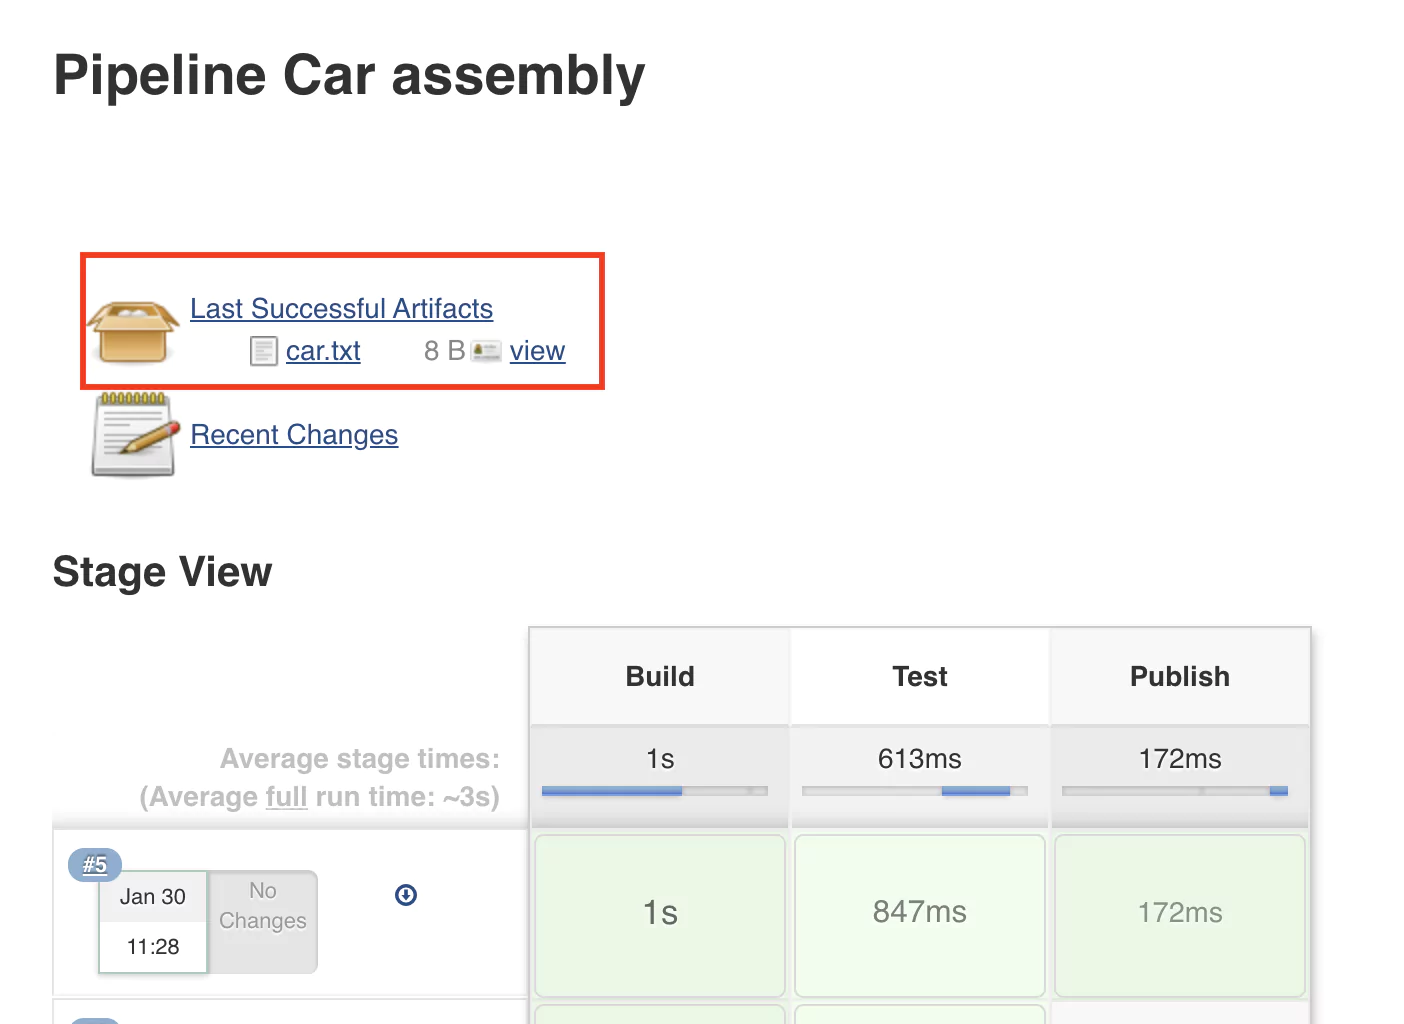
After rerunning the pipeline, the job page will display the latest successful artifact. Refresh the page once or twice if it does not show up.
(17-last-artifact.png)
Complete & Test the Pipeline
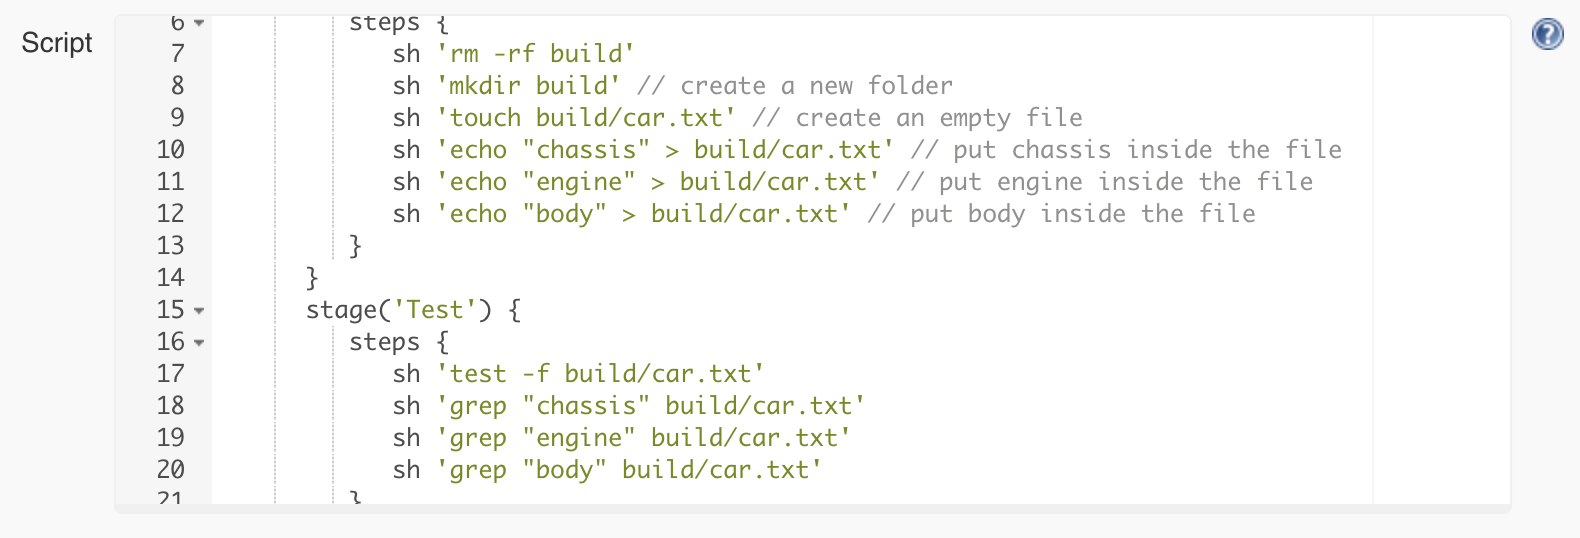
Let’s continue adding the other parts of the car: the engine and the body. For this, we will adapt both the build and the test stage as follows:
pipeline {
   agent any

   stages {
      stage('Build') {
         steps {
            sh 'rm -rf build'
            sh 'mkdir build' // create a new folder
            sh 'touch build/car.txt' // create an empty file
            sh 'echo "chassis" > build/car.txt' // add chassis
            sh 'echo "engine" > build/car.txt' // add engine
            sh 'echo "body" > build/car.txt' // body
         }
      }
      stage('Test') {
          steps {
              sh 'test -f build/car.txt'
              sh 'grep "chassis" build/car.txt'
              sh 'grep "engine" build/car.txt'
              sh 'grep "body" build/car.txt'
          }
      }
   }
}
Saving and rerunning the pipeline with this configuration will lead to an error in the test phase.
The reason for the error is that the car.txt file now only contains the word “body”. Good that we tested it! The > (greater than) operator will replace the entire content of the file, and we don’t want that. So we’ll use the >> operator just to append text to the file.
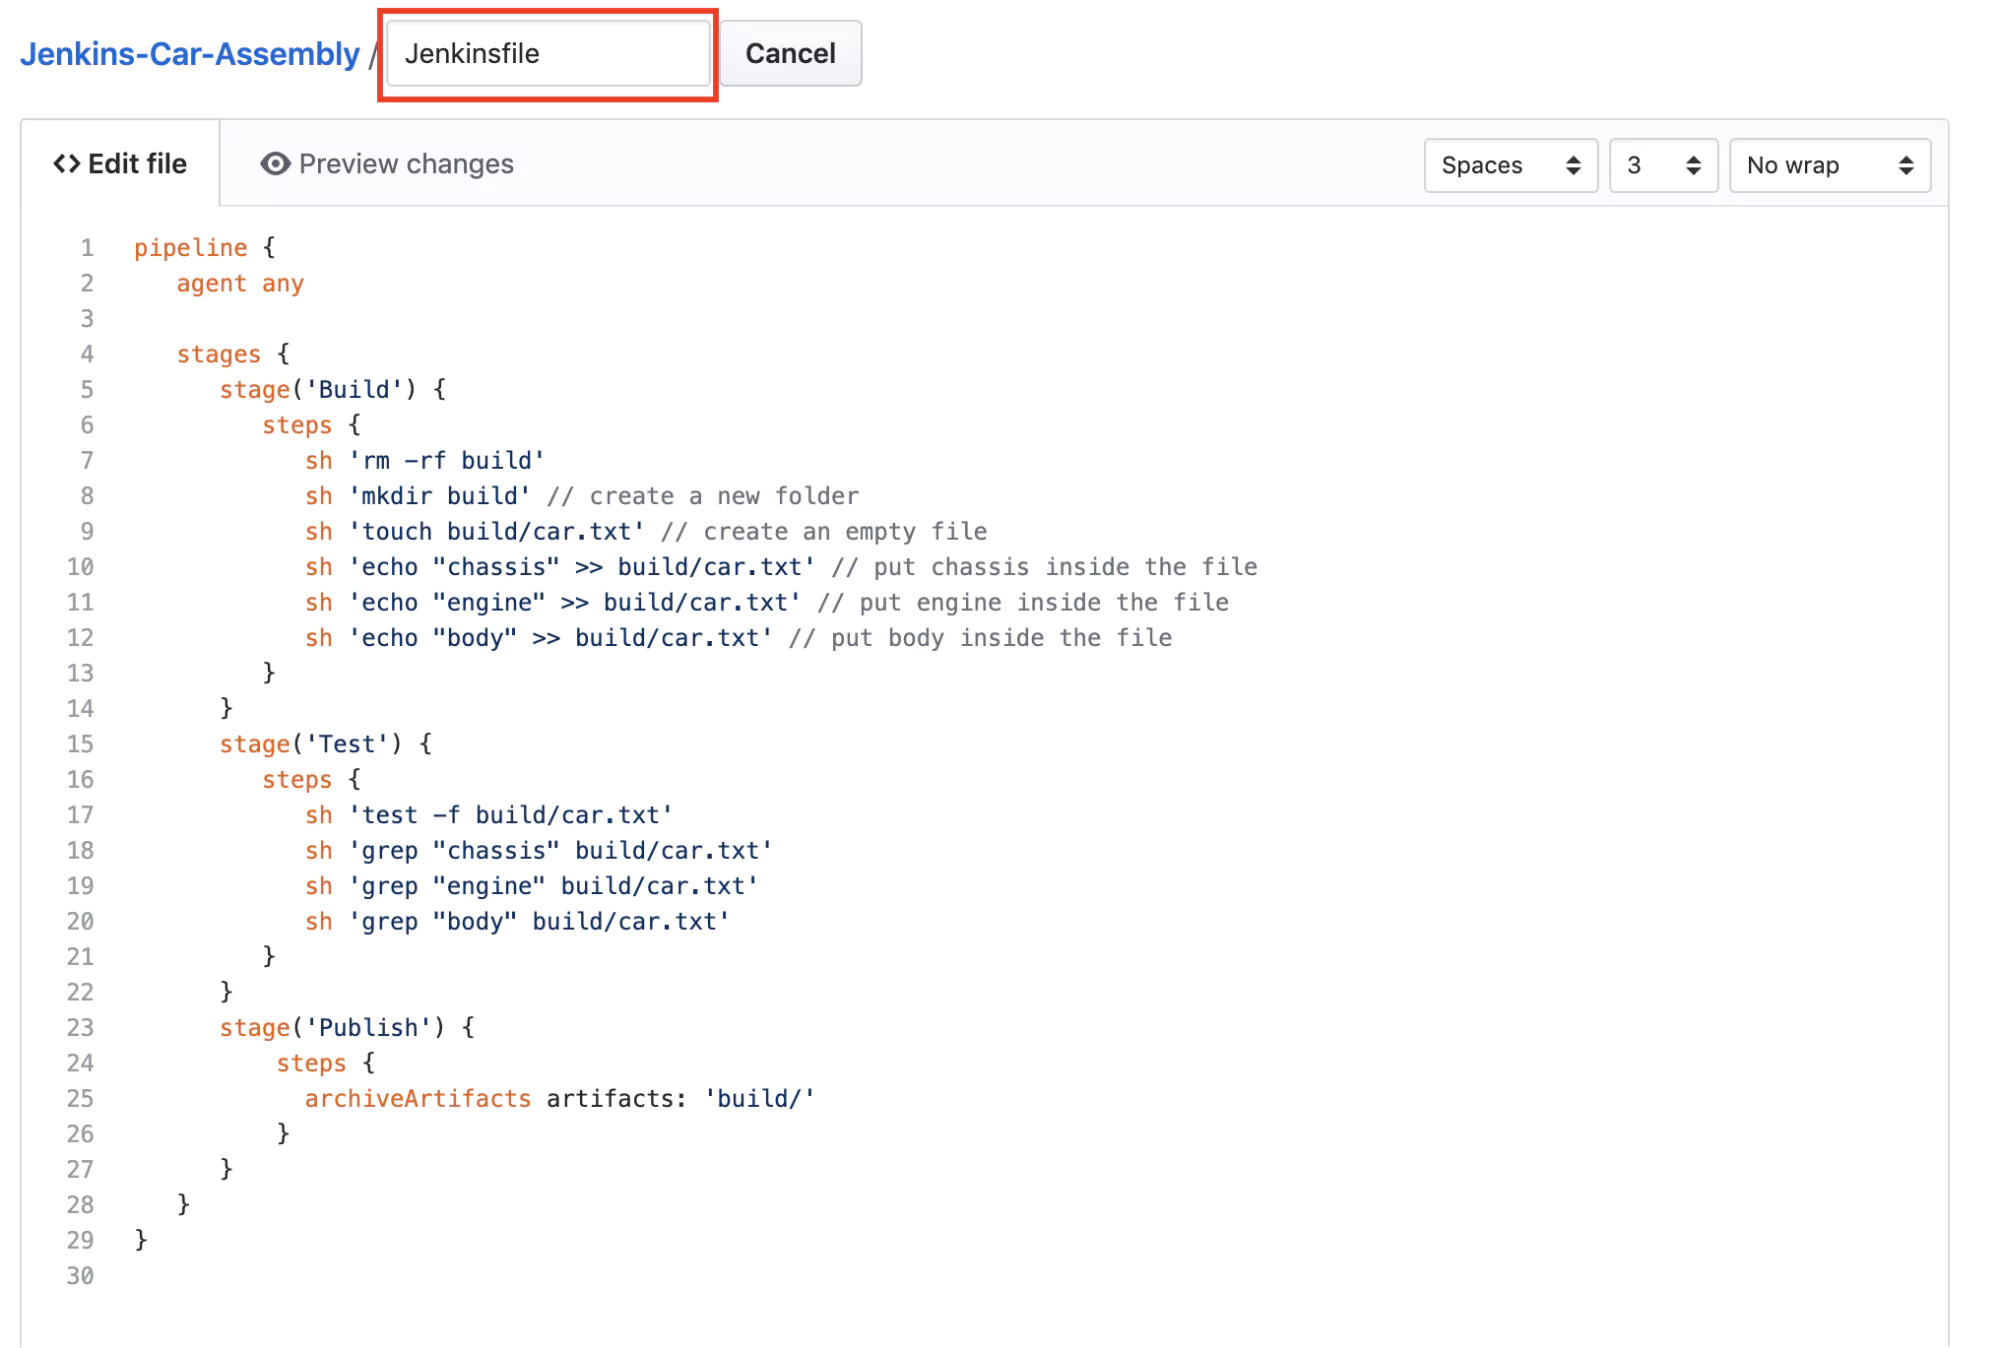
pipeline {
   agent any

   stages {
      stage('Build') {
         steps {
            sh 'rm -rf build'
            sh 'mkdir build'
            sh 'touch build/car.txt'
            sh 'echo "chassis" >> build/car.txt'
            sh 'echo "engine" >> build/car.txt'
            sh 'echo "body" >> build/car.txt'
         }
      }
      stage('Test') {
          steps {
              sh 'test -f build/car.txt'
              sh 'grep "chassis" build/car.txt'
              sh 'grep "engine" build/car.txt'
              sh 'grep "body" build/car.txt'
          }
      }
   }
}
Now the pipeline is successful again, and we’re confident that our artifact (i.e. file) has the right content.
Pipeline as Code
If you remember, at the beginning of the tutorial, you were asked to select the type of job you want to create. Historically, many jobs in Jenkins were and still are configured manually, with different checkboxes, text fields, and so on. Here we did something different. We called this approach Pipeline as Code. While it was not apparent, we’ve used a Domain Specific Language (DSL), which has its foundation in the Groovy scripting language. So this is the code that defines the pipeline.
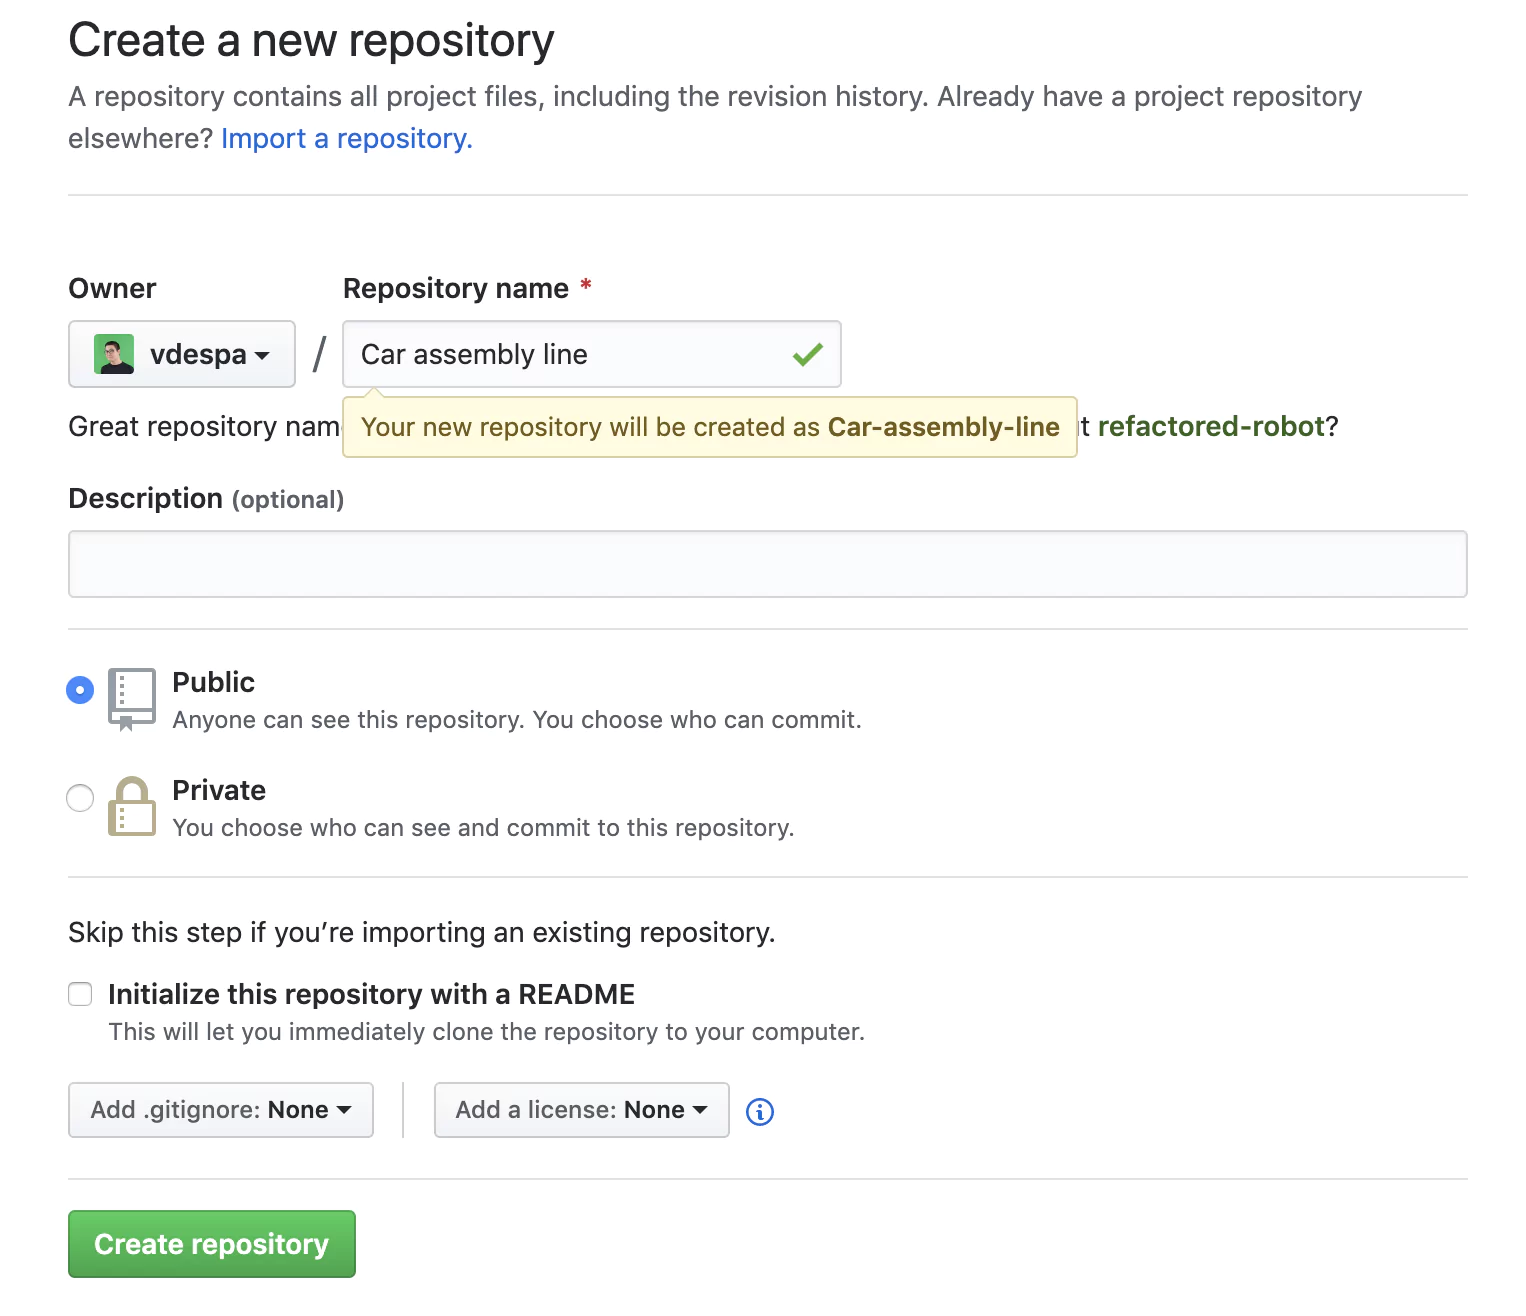
As you can observe, even for a relatively simple scenario, the pipeline is starting to grow in size and become harder to manage. Also, configuring the pipeline directly in Jenkins is cumbersome without a proper text editor. Moreover, any work colleagues with a Jenkins account can modify the pipeline, and we wouldn’t know what changed and why. There must be a better way! And there is. To fix this, we will create a new Git repository on Github.
To make things simpler, you can use this public repository under my profile called Jenkins-Car-Assembly.
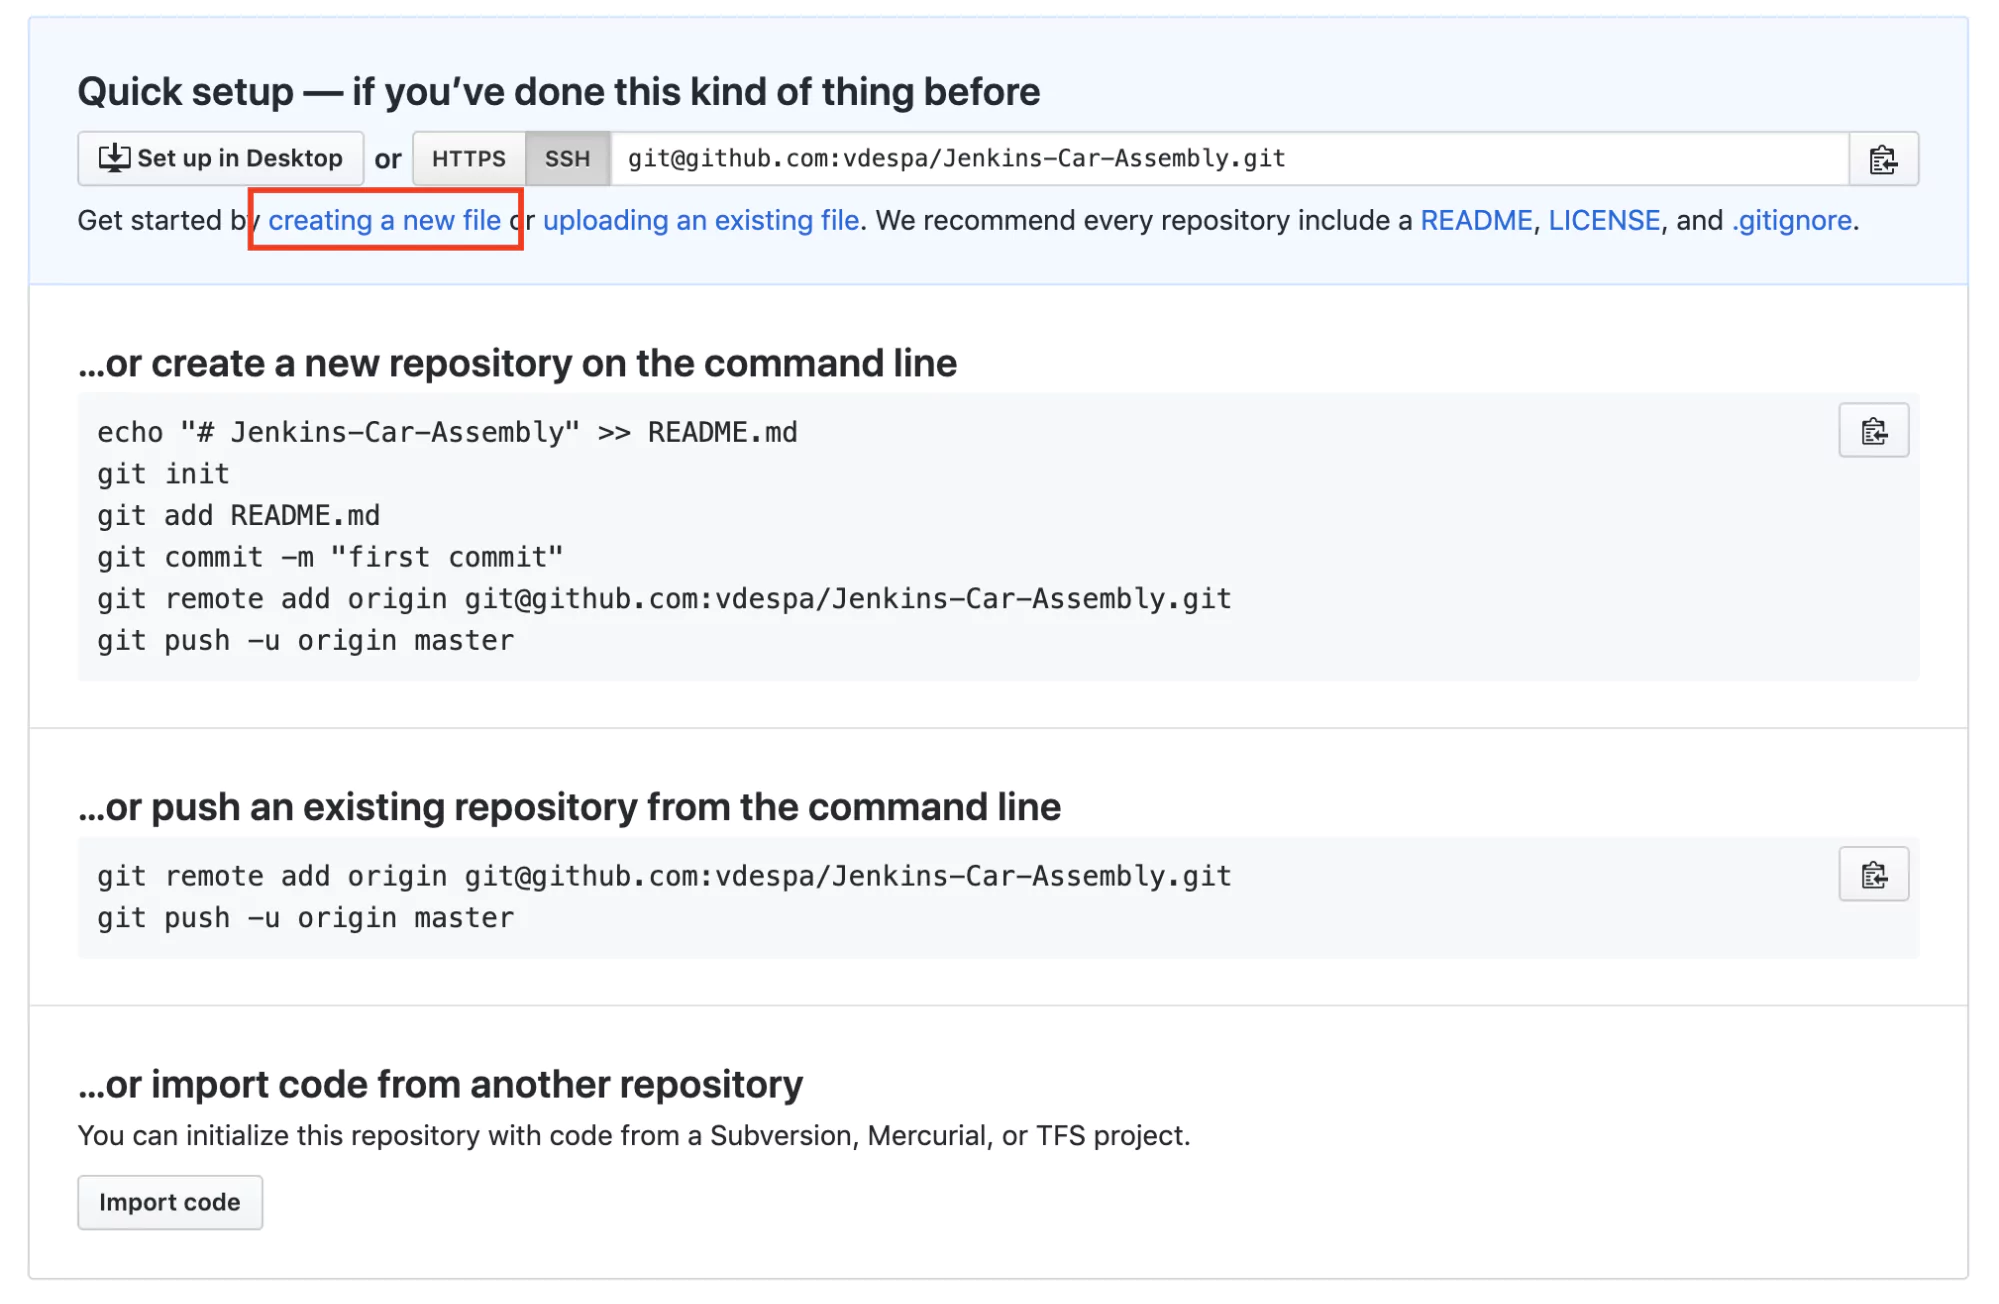
Jenkinsfile from a Version Control System
The next step is to create a new file called Jenkinsfile in your Github repository with the contents of the pipeline from Jenkins.
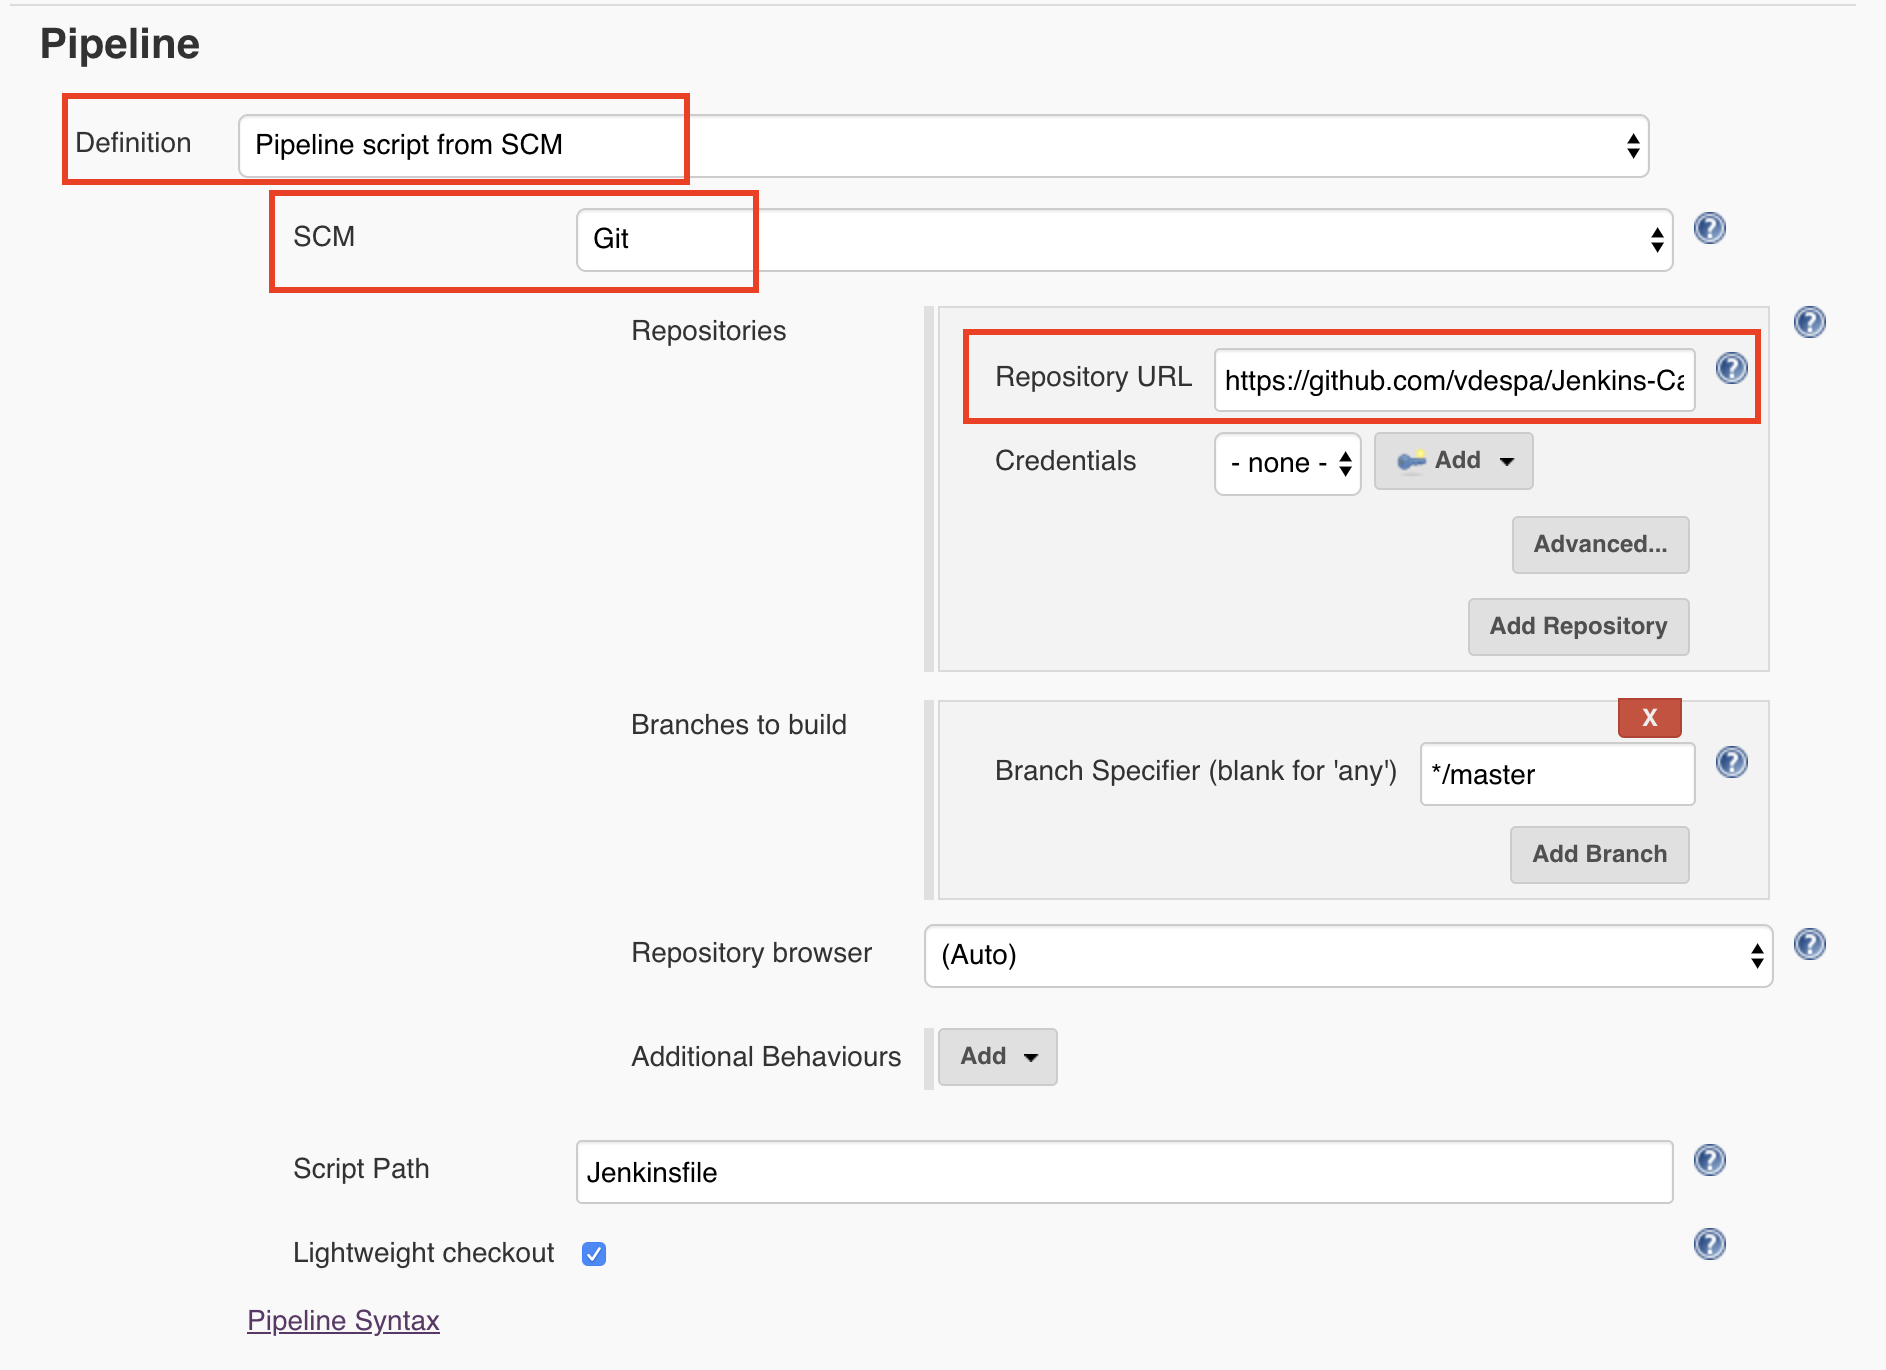
Read Pipeline from Git
Finally, we need to tell Jenkins to read the pipeline configuration from Git. I have selected the Definition as Pipeline Script from SCM which in our case, refers to Github. By the way, SCM stands for Source code management.
Saving and rerunning the pipeline leads to a very similar result.
So what happened? Now we use Git to store the pipeline configuration in a file called Jenkinsfile. This allows us to use any text editing software to change the pipeline but now we can also keep track of any changes that happen to the configuration. In case something doesn’t work after making a Jenkins configuration change, we can quickly revert to the previous version.
Typically, the Jenkinsfile will be stored in the same Git repository as the project we are trying to build, test, and release. As a best practice, we always store code in an SCM system. Our pipeline belongs there as well, and only then can we really say that we have a ‘pipeline as code’.
Conclusion
I hope that this quick introduction to Jenkins and pipelines has helped you understand what a pipeline is, what are the most typical stages, and how Jenkins can help automate the build and test process and ultimately deliver more value to your users faster.
For your reference, you can find the Github repository referenced in this tutorial here:
 The new standard of observability is here. Discover Olly, the industry’s first