The new standard of observability is here. Discover Olly, the industry’s first
In this survey of over 200 CIOs in the US, the IDC analyses the critical role played by Log Analytics in any modern infrastructure.
IDC Opinion
To effectively manage modern IT environments, organizations are reliant on their ability to gain actionable insight from machine-generated data. Log monitoring, collection and analysis of log data has long been a common practice for achieving operational visibility. However, traditional log analytics solutions were not designed to handle the huge volume and variety of log data generated by enterprises today, driven by the massive adoption of cloud, mobile, social media, IoT devices, AI, machine learning, and other data-intensive technologies. Thus, organizations are faced with challenges such as mounting costs of log data storage, integration difficulties, multiple false positives, the need for customizations, and manual querying and correlation.
According to a recent IDC survey, 50% of all organizations process more than 100GB of log data of different formats per day, and the numbers continue to rise. Given that, IDC believes that the next generation of log analytics should offer advanced analytics and correlation capabilities as well as improved performance to keep up with scaling demands, leveraging the cloud to provide access to innovative technologies in a cost-effective manner. Based on these capabilities, log management can have a pivotal role in streamlining modern software development practices such as DevOps and CI/CD.
Methodology
This study examines the role of log management and analytics in modern IT environments. To gain insight into log management requirements, preferences, priorities, and challenges, IDC conducted a survey with 200 IT decision makers in enterprises of all sizes in key industries in the U.S.
Situation Overview
Since the very early days of computing, organizations have used log data generated from their IT environments for various operational needs such as monitoring and troubleshooting application performance and network problems, investigating security incidents, improving customer experience, and more. While log data plays an increasingly important role across a range of use cases, capturing and acting upon it has become a significant challenge.
Traditionally, the collection of log data was done using homegrown scripts, which involved time- and labor-intensive manual processes. With the transition from monolithic applications to distributed multi-tiered architectures, this approach became practically infeasible.
In response, the first generation of log management tools emerged to automate the processes of collecting, storing and managing logs. Still, making sense out of the data remained an issue. Users had to know exactly what to look for and make their own correlations to get the results they wanted. As IT environments continued to grow in scale and complexity, log management solutions offered new functionalities such as the ability to run queries to retrieve events based on keywords, specific values or values within a specific range, visualization of data to facilitate search, and more. Although early log management solutions required specialized skills such as knowledge of vendor-specific search languages and techniques for framing log-specific inquiries, they were very useful in times when IT environments used to consist of systems developed by a relatively small number of suppliers.
Today, to keep up with the ongoing transformation of the IT industry, log management should take another leap forward.
Over the years, log management achieved mainstream adoption. According to a recent IDC survey, 90% of organizations of all sizes are either using or planning to use a log management solution. Adoption is particularly strong among software vendors (around 98% are currently using or planning to use) and financial services companies (90%).
Figure 1
Log Management and Analytics Adoption
- Does your organization use, or is it planning to use, any tool or solution to manage log data?
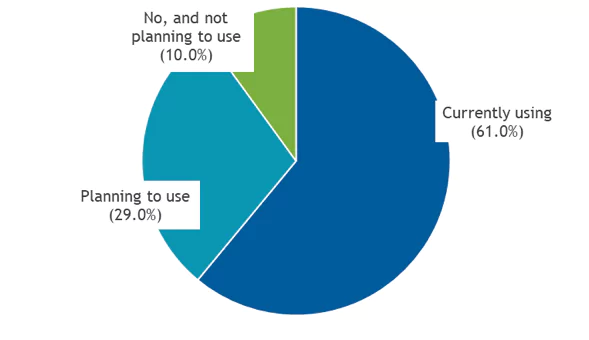
Note: N = 180
Source: IDC, 2019
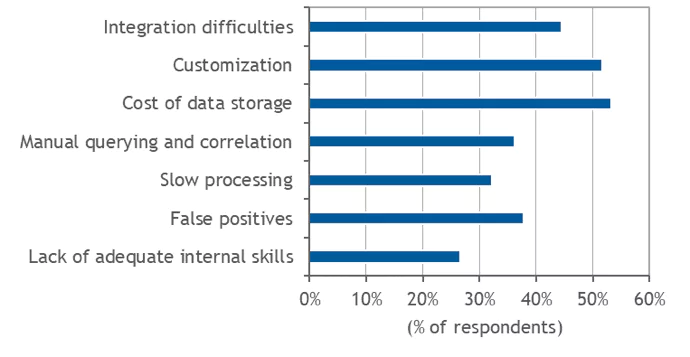
Log Management and Analytics Challenges
Despite the extensive use of log management, IDC’s survey revealed that many organizations are still struggling with different issues that compromise their ability to convert log data into actionable insights. In particular, the participants in the survey highlighted cost of data storage (mentioned by 53.33% of respondents), customization (51.67%) and integration (44.44%) as top concerns.
Figure 2
Log Management Challenges
- What are the biggest challenges related to effective use of log management across your organization?
Note: N = 180
Source: IDC, 2019
The challenges experienced by the survey participants reflect the difficulties of operating modern IT infrastructures that continue to grow in scale and complexity. Moreover, the emergence of containers, microservices and serverless computing architectures that are based on autonomous interactions between independent single-function modules via APIs, is drastically increasing the number of moving parts that must be constantly monitored.
Traditional log management solutions were not designed to handle the huge amounts of log data flowing in from these chaotic IT environments, which can explain the above mentioned difficulties. For example, lack of effective scaling leads to mounting storage costs; and manual-intensive efforts are made to compensate for the lack of automation and integration capabilities. Other challenges mentioned by a relatively high proportion of respondents – including high rate of false positives, the need for manual querying and correlation, and slow processing – provide further evidence of the technical shortcomings of traditional solutions.
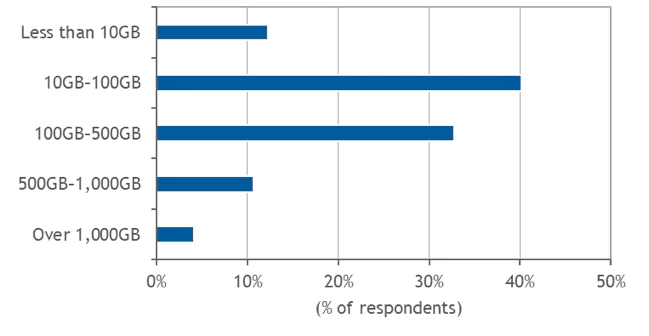
How Much is Too Much Data?
The amounts of log data collected and managed by organizations are overwhelming. According to IDC’s survey, nearly 50% of all organizations process more than 100GB of log data per day. In some industries, and especially in highly regulated sectors where data must be retained and protected for compliance purposes, data volumes are significantly higher. For example, 15.15% of financial services companies process more than 1,000GB (1TB) of log data per day.
Figure 3
Amount of Log Data Processed per Day
- How much log data does your log management solution process per day?
Note: N = 180
Source: IDC, 2019
Log Diversity in the Workplace
Unlike structured data – such as data kept in relational databases or contained within enterprise applications like ERP and CRM – log data is mostly unstructured. As each system or application generates logs in its own format, and often uses its own time format, data must be transformed into a common structured format before it can be queried and analyzed. Driven by the proliferation of intelligent, sensor-based systems and IoT devices, new types of log data are constantly being added to this mix.
The diversity of log data often leads to operational issues. For example, due to the difficulty of achieving a unified view of logs collected from multiple different sources using traditional solutions, organizations are often required to manually search and correlate disparate data sets – an error-prone and labor-intensive process.
Log Analysis Paralysis:
While collecting and searching through logs is more difficult due to the increased size and diversity of datasets, organizations have become dependent on their ability to analyze operational data.
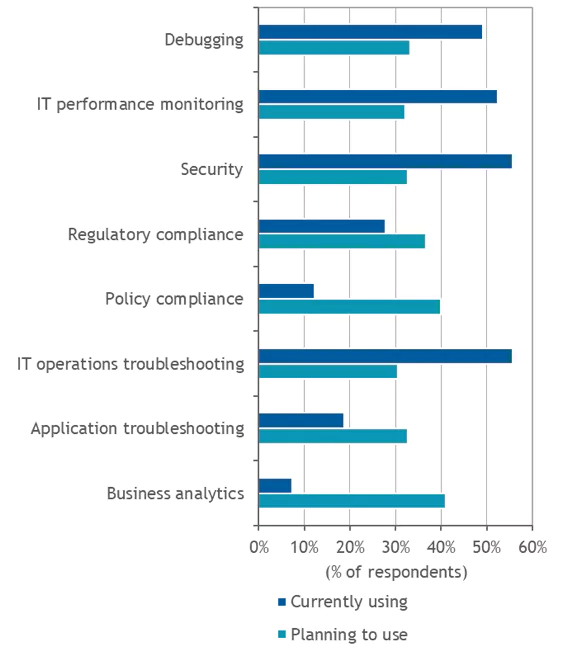
IDC’s survey provided a clear indication of the growing importance of log analytics. While IT operations troubleshooting and security remain the most common use case for log management, business analytics was the primary use case for companies that plan to use a log management solution in the next 12 months. The growing reliance on log analytics puts more emphasis on the need to automatically integrate and correlate different types of data from different sources to achieve comprehensive and accurate visibility, and the ability to detect and resolve problems quickly.
Figure 4
Log Management Use Cases
- What are the use cases for your organization’s log management solution?

Note: N = 180
Source: IDC, 2019
Next-Generation Log Management and Analytics
IDC’s survey demonstrated the importance of gaining real-time operational intelligence from machine-generated data. To address this need, log management solutions should evolve to tackle the above mentioned challenges of scalability, format diversity, lack of automation, and perhaps most importantly – offer advanced analytics capabilities.
In this regard, Artificial intelligence (AI) machine learning (ML) analytics are key technologies that can be used to identify anomalies, help teams focus on what matters most, optimize processes such as log clustering (the grouping together of related logs to facilitate search), correlation and alerting, and more. As depicted above, integration with other IT management systems is also essential for log management solutions in order to achieve comprehensive visibility across different environments and uses cases.
Log management is seeing rising demand from organizations of all sizes and industries. Cloud deployment options are therefore required to provide organizations – and particularly ones that lack the expertise or resources to implement and maintain complex in-house systems – with access to advanced functionalities. At the same time, given the amounts of log data delivered over the cloud, next-generation solutions should be designed to scale on-demand to avoid network congestion and data access latency.
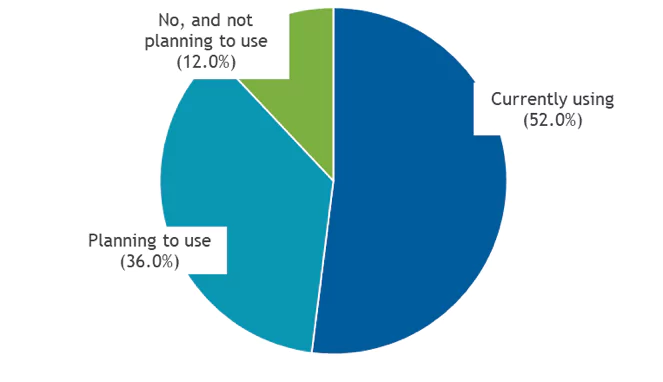
Log Analytics Across the CI/CD Pipeline
Another important requirement of next-generation solutions is the incorporation of log management and analytics into continuous integration/continuous deployment (CI/CD) processes. CI/CD is now a common method for bridging once-siloed development and operations teams and processes, creating streamlined delivery pipelines that support the rapid pace of changes. In accordance, 52% of the participants in IDC’s survey are already using CI/CD methodologies, while additional 36% are planning to use CI/CD in the near future.
Figure 5
CI/CD Adoption
- Does your organization use, or is it planning to use CI/CD methodology?

Note: N = 200
Source: IDC, 2019
While having a CI/CD pipeline is a growing necessity in today’s dynamic, software-driven IT environments, it also introduces new challenges. As things get more complex, gaining insight into every stage of the delivery pipeline – for every version release – is more difficult. To measure the quality of software versions in a more accurate and timely manner, organizations often combine log data analysis with other methods including, test automation and metrics.
Metrics allow for measuring the functionality and performance of applications or services, typically through the establishment of thresholds for operational indicators such as CPU and memory utilization, transaction throughput, application response time, errors, etc.; as well as various business indicators. Continuously collected at regular intervals, metrics can be used for identifying trends and potential issues over time, as well as events, i.e. deviations from thresholds that point to unusual occurrences at specific time that need further investigation or analysis.
The combination of open source log analysis with different monitoring methods can help development, application support, site reliability engineering (SRE), DevOps and operations teams address various issues across all stages of the CI/CD pipeline, from design to release. Next-generation log management and analytics solutions can play a key role here, enabling organizations to make sense of huge amounts of operational data in various formats and obtain a unified and comprehensive view of the IT environment.
Coralogix Company Overview
Coralogix is a full-stack observability platform provider that aims to facilitate log data management and accelerate problem resolution with automation tools and machine learning algorithms. The solution, which launched the first version in 2015, is based on the open source ELK stack coupled with proprietary algorithms and advanced enterprise features.
To reduce the time wasted searching through logs to solve issues, Coralogix automatically clusters multiple logs are into a handful of shared templates without the need for configurations. The company has developed ML capabilities in order to model the normal behavior of environments and services and the flows in between, to automatically alert users to unnatural deviations.
For example, new errors are automatically identified as soon as they appear for the first time, or when a combination of logs that are expected to arrive in a particular sequence deviates from the expected flow. These capabilities should result in less time spent creating and managing alerts manually. The ML-assisted approach also has the effect of surfacing otherwise unknown issues before they drastically affect the customer experience.
To support the increased velocity of releases in CI/CD practices, Coralogix automatically generates version benchmark reports upon every release or environmental change. These reports let teams know how the software quality compares to previous versions in terms of new errors, higher error ratios, or new broken flows.
Coralogix is available as software-as-a-service with licensing based on the size of daily logs ingested and the retention period chosen. It includes quick integrations with the majority of clouds, servers, applications, frameworks, log files, platforms, containers, systems and databases available.
Coralogix has introduced several new features over the past 12 months, including threat intelligence by enriching logs based on reputational IP blacklists, quota usage management tools to save on cost, and volume anomaly detection which triggers an alert when a trend of errors or bad API responses is detected in one of the system components.
Coralogix is a good option to consider for midsize and enterprise businesses requiring a scaled and secure centralized logging solution for log management and analytics, compliance, and monitoring, as well as white glove support services which comes handy when facing more complicated integrations and setups.
Essential Guidance
The results from IDC’s survey demonstrate that despite the mass-scale adoption of log management solutions, organizations struggle to extract insight from the ever-increasing amount and diversity of machine-generated data. The survey highlighted customer concerns over cost of data storage, the need for customizations and integrations and other challenges that point to the limitations of traditional solutions. To tackle these issues and obtain continuous and comprehensive monitoring of modern IT environments, organizations should seek to leverage advanced log analytics across various use cases and as part of their CI/CD and DevOps pipelines.
About IDC research
International Data Corporation (IDC) is the premier global provider of market intelligence, advisory services, and events for the information technology, telecommunications, and consumer technology markets. IDC helps IT professionals, business executives, and the investment community make fact-based decisions on technology purchases and business strategy. More than 1,100 IDC analysts provide global, regional, and local expertise on technology and industry opportunities and trends in over 110 countries worldwide. For 50 years, IDC has provided strategic insights to help our clients achieve their key business objectives. IDC is a subsidiary of IDG, the world’s leading technology media, research, and events company.