Mezmo Logging vs Coralogix Logging: Features, Pricing and Support

Mezmo, formerly known as LogDNA, offers log analytics without any native capabilities around metrics and tracing data. While Coralogix’s full-stack observability supports logs, metrics, tracing and security data, for the purpose of this comparison with Mezmo, we will focus primarily on logs.

But before diving into the nitty gritty, it’s important to note that Coralogix is a leader in providing in-stream log analysis, leveraging open source telemetry and storage (no vendor lock-in) with up to 70% cost savings in comparison to all other observability solutions.

Additionally, when it comes to support, Coralogix offers all customers a median 30-second response time, an SLA measured in minutes with 24/7 live support. All at no extra cost. 

Let’s look at the details.

Coralogix logging vs Mezmo logging 

Open source friendly

Data portability is an important consideration within a dynamic business environment and is essential on the collection and shipping side, as well as on the storage side.

With Coralogix you can use open source shipping agents, such as Open Telemetry, and if you’re moving data to multiple destinations, use a single agent instead.. With Mezmo, however, you’ll need to use their proprietary agent. 

On the storage side, Coralogix customers can hold data in object storage in their own cloud account. The Coralogix format, CX-Data, is based on open source Parquet so you can directly index and query logs using Amazon Athena or other popular tools. And with Coralogix you’ll never lose ownership of your data through proprietary formats that may hold you ransom with vendor lock-in. 

Observe more data for less cost

Aside from all the limits and additional costs that Mezmo has (e.g. you need to pay extra for their Telemetry Pipeline) their flat rate for all data will often force you to choose which data you can afford to monitor.

On the other hand, Coralogix only charges for data ingested. Furthermore, our TCO optimization empowers you to select how your data will be indexed and stored. Logs needed for compliance can be archived. The remainder of logs are processed in-stream for analysis, alerts, ML dashboards and more, after which they are sent to either archive or indexing and hot storage (this is optional for logs that require instantaneous query results).

For logs that don’t require hot storage, Coralogix’s in-stream analysis still allows you to rapidly query and analyze fresh, incoming logs or older ones already in archive, with up to 70% cost savings. 

Bottom line, Coralogix allows you to monitor all your logs, tracing, metrics and security data without having to pay top dollar for it all. 

Can I get some support here!

While Mezmo does offer support via a ticketing system, average response and resolution times are not documented anywhere which would indicate that support is not in real-time. 

By contrast, part of Coralogix’s package includes customer support with a median 30-second response time, an SLA measured in minutes, and 24/7 support. Coralogix also has a median resolution time of 43 minutes which means we are resolving issues faster than most of our competitors are even acknowledging them!

Alerts are important

Mezmo offers some basic alerting functionality, however it does not compare to Coralogix. Coralogix offers 6 different types of alerts, ranging from simple log counts, all the way through to ratio and time relative alerts. Coralogix log alerting is by far the most sophisticated on the market, and enables highly sophisticated insight generation.

Additionally, Coralogix supports the “more than usual” and “less than usual” alert conditions, which are driven by a machine learning algorithm to detect anomalous data flow patterns in customer data. These enable the detection of “unknown-unknowns” and act as a safety blanket to catch issues that may otherwise go undetected. 

Coralogix Flow Alerts allow users to orchestrate their logs, metrics, traces, and security data into a single alert that tracks multiple events over time. Using Flow Alerts, customers can track the change in their system.

If you seek a cost-effective, full-stack observability solution that gives you comprehensive visibility into logs, metrics, tracing and security events, get a free demo with us today. 

Logs vs Metrics: What Are They and How to Benefit From Them

In a rapidly evolving realm of IT, organizations are constantly seeking peak performance and dependability, leading them to rely on a full stack observability platform to obtain valuable system insights.

That’s why the topic of logs vs metrics is so important with both of these data sources playing a vital role, as any full-stack observability guide would tell you, serving as essential elements for efficient system monitoring and troubleshooting. But what are logs and metrics, exactly?

In this article, we’ll take a closer look at logs vs metrics, explore their differences, and see how they can work together to achieve even better results.

What are logs? 

Logs serve as a detailed record of events and activities within a system. They provide a chronological narrative of what happens in the system, enabling teams to gain visibility into the inner workings of applications, servers, and networks.

Log messages can contain information about user authentication, database queries, or error messages. They can present different levels, for instance:

  • Information for every action that was successful, like a server start.
  • Debug for information that is useful in a development environment, but rarely in production
  • Warning, which is slightly less severe than errors, signaling that something might fail in the future if no action is taken
  • Error when something has gone wrong and a failure has been detected in the system.

Logs usually take the form of unstructured text with a timestamp:

Logs offer numerous benefits. They are crucial during troubleshooting to diagnose issues and identify the root cause of problems. By analyzing logs, IT professionals and DevOps teams can gain valuable insights into system behavior and quickly resolve issues.

Logs also play a vital role in meeting regulatory requirements and ensuring system security. They offer a comprehensive audit trail, enabling organizations to track and monitor user activities, identify potential security breaches, and maintain compliance with industry standards. They also provide a wealth of performance-related information, allowing teams to monitor system behavior, track response times, identify bottlenecks, and optimize performance.

Despite their many advantages, working with logs can present certain challenges. Logs often generate massive volumes of data, making it difficult to filter through and extract the relevant information. It is also important to note that logs don’t always have the same structure and format, which means that developers need to set up specific parsing and filtering capabilities.

What are metrics?

Metrics, on the other hand, provide a more aggregated and high-level view of system performance. They offer quantifiable measurements and statistical data, providing insights into overall system health, capacity, and usage. Examples of metrics include measurements such as response time, error rate, request throughput, and CPU usage.

Metrics offer several benefits, including:

  • Real-time monitoring: Metrics provide continuous monitoring capabilities, allowing teams to gain immediate insights into system performance and detect anomalies in real time. This enables proactive troubleshooting and rapid response to potential issues.
  • Scalability and capacity planning: Metrics help organizations understand system capacity and scalability needs. By monitoring key metrics such as CPU utilization, memory usage, and network throughput, teams can make informed decisions about resource allocation and ensure optimal performance.
  • Trend analysis: Metrics provide historical data that can be analyzed to identify patterns and trends. This information can be invaluable for capacity planning, forecasting, and identifying long-term performance trends.

While metrics offer significant advantages, they also have limitations. Metrics provide aggregated data, which means that detailed event-level information may be lost. Additionally, some complex system behaviors and edge cases may not be captured effectively through metrics alone.

Logs vs metrics: Do I need both?

The decision to use both metrics and logs depends on the specific requirements of your organization. In many cases, leveraging both logs and metrics is highly recommended, as they complement each other and provide a holistic view of system behavior. While metrics offer a high-level overview of system performance and health, logs provide the necessary context and details for in-depth analysis. 

Let’s say you’re a site reliability engineer responsible for maintaining a large e-commerce platform. You have a set of metrics in place to monitor key performance indicators such as response time, error rate, and transaction throughput.

While analyzing the metrics, you notice a sudden increase in the error rate for the checkout process. The error rate metric shows a significant spike, indicating that a problem has occurred. This metric alerts you to the presence of an issue that needs investigation.

To investigate the root cause of the increased error rate, you turn to the logs associated with the checkout process. These logs contain detailed information about each step of the checkout flow, including customer interactions, API calls, and system responses. 

By examining the logs during the time period of the increased error rate, you can pinpoint the specific errors and related events that contributed to the problem. You may discover that a new version of a payment gateway integration was deployed during that time, causing compatibility issues with the existing system. 

The logs might reveal errors related to failed API calls, timeouts, or incorrect data formats. Armed with the insights gained from the logs, you can take appropriate actions to resolve the issue. In this example, you might roll back the problematic payment gateway integration to a previous version or collaborate with the development team to fix the compatibility issues. 

After implementing the necessary changes, you can monitor both metrics and logs to ensure that the error rate returns to normal and the checkout process functions smoothly.

Using metrics and logs with Coralogix

Coralogix is a powerful observability platform that offers full-stack observability capabilities, combining metrics and logs in a unified interface. With Coralogix, IT professionals can effortlessly collect, analyze, and visualize both metrics and logs, gaining deep insights into system performance.

By integrating with Coralogix, you can benefit from its advanced log parsing and analysis features, as well as its ability to extract metrics from logs. You can aggregate and visualize logs in real-time, making it easier to spot patterns, anomalies, and potential issues. 

Additionally, Coralogix allows you to define custom metrics and key performance indicators (KPIs) based on the extracted data from logs. This combination of metrics and logs enables you to gain comprehensive insights into your system’s behavior, efficiently identify the root causes of problems, and make data-driven decisions for optimizing performance and maintaining robustness in your applications.

Everything You Need to Know About Log Management Challenges

Distributed microservices and cloud computing have been game changers for developers and enterprises. These services have helped enterprises develop complex systems easily and deploy apps faster.

That being said, these new system architectures have also introduced some modern challenges. For example, monitoring data logs generated across various distributed systems can be problematic.

With strong log monitoring tools and strategies in your developer’s toolkit, you’ll be able to centralize, monitor and analyze any wealth of data. In this article, we’ll first go over different log management issues you could potentially face down the line, and how to effectively overcome each one along the way.

Common log management problems

Monitoring vast data logs across a distributed system poses multiple challenges. When talking about a full-stack observability guide, here are some of the most common log management issues, and ways to fix them.

1. Your log management system is too complex

Overcomplexity is one of the primary causes of inefficient log systems. Traditional log monitoring tools are designed to handle data in a single monolithic system. Therefore, cross-platform interactions and integrations require the aid of third-party integration apps.

In the worst-case scenario, you might have to implement different integration procedures for different platforms to understand disparate outputs. This complicates your log monitoring system and drives up maintenance costs. 

Coralogix resolves this with a simple, centralized, and actionable log dashboard built for maximum efficiency. With a clear and simple graphical representation of your logs, you can easily drill down and identify issues. 

2. Dealing with an overwhelming amount of data 

Traditional legacy and modern cloud computing systems often produce vast amounts of unstructured data. Not just that, these different data formats are often incompatible with each other, resulting in data silos and hindered data integration efforts. The incompatibility between various data formats poses significant challenges for businesses in terms of data management, analysis, and decision-making processes.

Data volume also drives up the cost of traditional monitoring strategies. As your system produces more data, you will have to upgrade your monitoring stack to handle the increased volume. Having a modern log observability and monitoring tool can help you manage this data effectively.

You need an automated real-time log-parsing tool that converts data logs into structured events.  These structured events can help you extract useful insights into your system’s health and operating conditions. 

3. Taking too long to fix system bugs, leading to downtime

Log data is extremely useful for monitoring potential threats, containing time-stamped data of system conditions when incidents occur. However, the lack of visibility in distributed systems can make systems logs with bugs difficult to pinpoint. 

Therefore, you often have to spend a lot of time shifting through large amounts of data to system bugs. The longer it takes to find the bugs, the higher the likelihood that your system might face downtime. Modern distributed systems make this even harder, since system elements are scattered across many platforms. 

Coralogix’s real-time log monitoring dashboard helps you streamline this by providing a centralized view of the layers of connections between your distributed systems. This makes it possible to monitor and trace the path of individual requests and incidents without combing through tons of data logs. 

With this, you can greatly improve the accuracy of your log monitoring efforts, identify and resolve bugs faster and reduce the frequency of downtimes in your system.

4. Be proactive to prevent problems

Threat hunting and incident management is another common log monitoring problem. Traditional log monitoring software makes detecting threats in real time and deflecting them nearly impossible. 

In some situations, you only become aware of a threat after the system experiences downtime. Downtime has massive detrimental effects on a business, leading to loss of productivity, revenue and customer trust. Real-time log monitoring helps you resolve this by actively parsing through your data logs in real time and identifying unusual events and sequences. 

With a tool like Coralogix’s automated alerting system and AI prevention mechanism for log management, you can set up active alerts that are triggered by thresholds. The AI sets off alerts when your system encounters a previously unknown threshold. Thus, you can prevent threats before they affect your system.

Simplifying your log management system for better efficiency

Log monitoring is an essential task for forward-facing enterprises and developers. The simpler your log monitoring system, the faster you can find useful information from your data logs.

However, the data size involved in log management might make it challenging to eliminate problems manually. There are different log monitoring dashboards that can streamline your entire log monitoring journey. Choose the right one for your business. 

An Introduction to Kubernetes Observability

If your organization is embracing cloud-native practices, then breaking systems into smaller components or services and moving those services to containers is an essential step in that journey. 

Containers allow you to take advantage of cloud-hosted distributed infrastructure, move and replicate services as required to ensure your application can meet demand, and take instances offline when they’re no longer needed to save costs.

Once you’re dealing with more than a handful of containers in production, a container orchestration platform becomes practically essential. Kubernetes, or K8s for short, has become the de-facto standard for container orchestration, with all major cloud providers offering K8s support and their own Kubernetes managed service.

With Kubernetes observability, you can automate your containers’ deployment, management, and scaling, making it possible to work with hundreds or thousands of containers and ensure reliable and resilient service. 

Fundamental to the design of Kubernetes is its declarative model: you define what you want the state of your system to be, and Kubernetes works to ensure that the cluster meets those requirements, automatically adding, removing, or replacing pods (the wrapper around individual containers) as required.  

The self-healing design can give the impression that observability and monitoring are all taken care of when you deploy with Kubernetes. Unfortunately, that’s not the case. While some things are handled automatically – like replacing failed cluster nodes or scaling services – Kubernetes observability still needs to be built in and used to ensure the health and performance of a K8s deployment.

Log data plays a central role in creating an observable system. By monitoring logs in real-time, you gain a better understanding of how your system is operating and can be proactive in addressing issues as they emerge, before they cause any real damage. This article will look at how Kubernetes observability can be built into your Kubernetes-managed cluster, starting at the bottom of the stack.

Observability for K8s infrastructure

As a container orchestration platform, Kubernetes handles the containers running your application workloads but doesn’t manage the underlying infrastructure that hosts those containers. 

A Kubernetes cluster consists of multiple physical and/or virtual machines (the cluster nodes) connected over a network. While Kubernetes will take care of deploying containers to the nodes (according to the declared configuration) and packing them efficiently, it cannot manage the nodes’ health.

Your cloud provider is responsible for keeping servers online and providing computing resources on demand in a public cloud context. However, to avoid the risk of a huge bill, you’ll want to keep an eye on your usage – and potentially set quotas – to prevent auto-scaling and elastic resources from running wild. If you’ve set quotas, you’ll need to monitor your usage and be ready to provision additional capacity as demand grows.

If you’re running Kubernetes on a private cloud or on-premise infrastructure, monitoring the health of your servers – including disk space, memory, and CPU – and keeping them patched and up-to-date is essential. 

Although Kubernetes will take care of moving pods to healthy nodes if a machine fails, with a fixed set of resources, that approach can only stretch so far before running out of server nodes. To use Kubernetes’ self-healing and auto-scaling features to the best effect, you must ensure sufficient cluster nodes are online and available at all times.

Using Kubernetes’ metrics and logs

Once you’ve considered the observability of the servers hosting your Kubernetes cluster, the next layer to consider is the Kubernetes deployment itself. 

Although Kubernetes is self-healing, it is still dependent on the configuration you specify; by getting visibility into how your cluster is being used, you can identify misconfigurations, such as faulty replica sets, and spot opportunities to streamline your setup, like underused nodes.

As you might expect, the various components of Kubernetes each emit log messages so that the inner workings of the system can be observed. This includes:

  • kube-apiserver – This serves the REST API that allows you, as an end-user, to communicate with the cluster components via kubectl or a GUI application, and enables communication between control plane components over gRPC. The API server logs include details of error messages and requests. Monitoring these logs can alert you to early signs of the server needing to be scaled out to accommodate increased load or issues down the pipeline that are slowing down the processing of incoming requests.
  • kube-scheduler – The scheduler assigns pods to cluster nodes according to configuration rules and node availability. Unexpected changes in the number of pods assigned could signify a misconfiguration or issues with the infrastructure hosting the pods.
  • kube-controller-manager – This runs the controller processes. Controllers are responsible for monitoring the status of the different elements in a cluster, such as nodes or endpoints, and moving them to the desired state when needed. By monitoring the controller manager over time, you can determine a baseline for normal operations and use that information to spot increases in latency or retries. This may indicate something is not working as expected.

The Kubernetes logging library, klog, generates log messages for these system components and others, such as kubelet. Configuring the log verbosity allows you to control whether logs are only generated for critical or error states or lower severity levels too. 

While you can view log messages from the Kubernetes CLI, kubectl, forwarding logs to a central platform allows you to gain deeper insights. By building up a picture of the log data over time, you can identify trends and compare these to the latest data in real-time, using it to identify changes in cluster behavior.

Monitoring a Kubernetes-hosted application

In addition to the cluster-level logging, you need to generate logs at the application level for full observability of your system. Kubernetes observability ensures your services are available, but it lacks visibility or understanding of your application logic. 

Instrumenting your code to generate logs at appropriate severity levels makes it possible to understand how your application is behaving at runtime and can provide essential clues when debugging failures or investigating security issues.

Once you’ve enabled logging into your application, the next step is to ensure those logs are stored and available for analysis. By their very nature, containers are ephemeral – spun up and taken offline as demand requires. 

Kubernetes stores the logs for the current pods and the previous pods on a given node, but if a pod is created and removed multiple times, the earlier log data is lost. 

As log data is essential for determining what normal behavior looks like, investigating past incidents and for audit purposes, it’s a good idea to consider shipping logs to a centralized platform for storage and analysis.

The two main patterns for shipping logs from Kubernetes are to use either a node logging agent or a sidecar logging agent:

  • With a node logging agent, the agent is installed on the cluster node (the physical or virtual server) and forwards the logs for all pods on that node.
  • With a sidecar logging agent, each pod holds the application container together with a sidecar container hosting the logging agent. The agent forwards all logs from the container.

Once you’ve forwarded your application logs to a log observability platform, you can start analyzing the log data in real-time. Tracking business metrics, such as completed transactions or order quantities, can help to spot unusual patterns as they begin to emerge. 

Monitoring these alongside lower-level application, cluster, and infrastructure health data makes it easier to correlate data and drill down into the root cause of issues.

Summary

While Kubernetes offers many benefits when running distributed, complex systems, it doesn’t prevent the need to build observability into your application and monitor outputs from all levels of the stack to understand how your system is behaving. 

With Coralogix, you can perform real-time analysis of log data from each part of the system to build a holistic view of your services. You can forward your logs using Fluentd, Fluent-Bit, or Filebeat, and use the Coralogix Kubernetes operator to apply log parsing and alerting features to your Kubernetes deployment natively using Kubernetes custom resources.

Comparing REST and GraphQL Monitoring Techniques

Maintaining an endpoint, especially a customer-facing one, requires constant log monitoring, whether using REST or GraphQL. As the industry has looked for solutions to build a more adaptive endpoint technology, it is also a must to monitor these endpoints. GraphQL and REST are two different technologies that allow user-facing clients to link to databases and platform logic. Both GraphQL and REST include monitoring techniques. Here, we will compare enterprise monitoring an endpoint using AWS API Gateway backed by a REST or GraphQL.

REST and GraphQL Monitoring Architecture

The architecture of a GraphQL versus a REST endpoint is fundamentally different. The architecture gives different locations available for monitoring your solution. Both RESTful and GraphQL systems are stateless, meaning the server and client do not need to know what state the other is in for interactions. Both RESTful and GraphQL systems also separate the client from the server. Either architecture can modify the server or client without affecting operations of the other as long as the format of the requests on the endpoint(s) remain consistent.  

GraphQL Monitoring and Server Architecture

GraphQL uses a single endpoint and allows users to select what portion of the available returned data is required, making it more flexible for developers to integrate and update. GraphQL endpoints include these components:

  1. A single HTTP endpoint
  2. A schema that defines data types
  3. An engine that uses the schema to route inputs to resolvers
  4. Resolvers process the inputs and interact with resources. 

Developers can place GraphQL Monitoring in any of several locations. Monitoring the HTTP endpoint itself will reveal all the traffic hitting the GraphQL server. Developers can monitor the GraphQL server where the server routes data from the endpoint to a specific resolver. Each resolver, query or mutation, can have monitoring implemented.  

REST Monitoring and Server Architecture

RESTful architecture is similar in components to GraphQL but requires a very different and more strict setup. REST is a paradigm for how to set up an endpoint following some relatively strict rules. Many endpoints exist claiming to be REST, but they do not precisely follow these rules. Endpoints that do not conform to the rules are better defined as HTTP APIs. REST is robust but inflexible in its capabilities since each endpoint requires its own design and building. It is up to the developers to design their endpoints as needed, but many believe only endpoints following these rules should be labeled as REST.

Designing a RESTful API includes defining the resources that will be made accessible using HTTP, identifying all resources with URLs (or resources), and mapping CRUD operations to standard HTTP methods. CRUD operations (create, retrieve, update, delete) are mapped to POST, GET, PUT, and DELETE methods, respectively.

Each RESTful URL expects to receive specific inputs and will return results based on those inputs. Inputs and outputs of each resource are set and known by both client and server to interact. 

Monitoring on RESTful APIs has some similarities to GraphQL. Developers can set up monitoring on the API endpoints directly. Monitoring may be averaged across all endpoints with the same base URL or broken up for each specific resource. When developers use compute functions between the database and the endpoint, developers can monitor these functions as well. If using AWS monitoring, it is common to use Lambda to power API endpoints. 

REST and GraphQL Error Monitoring

REST Error Format

RESTful APIs use well-defined HTTP status codes to signify errors. When a client makes a request, the server notifies the client if the request was successfully handled. A status code is returned with all request results, signifying what kind of error has occurred or what server response the client should expect. HTTP includes a few categories of status codes. These include 200 level (success), 400 level (client errors), and 500 level (server errors).

Errors can be caught in several places and monitored for RESTful endpoints. The API itself may be able to monitor the status codes and provide metrics for which codes are returned and how often. Logs from computing functions behind the endpoint can also be used to help troubleshoot error codes. Logs can be sent to third-party tools like Coralogix’s log analytics platform to help alert developers of systemic issues.

GraphQL Error Format

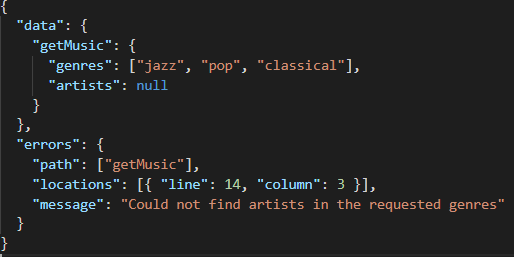
GraphQL monitoring looks at server responses to determine if an issue has arisen. Errors returned are categorized based on the error source. GraphQL’s model combines errors with data. So, when the server cannot retrieve some data, the server will return all available data and append an error when appropriate. The return format for GraphQL resolvers is shown below:

The Apollo server library allows developers to use internally generated syntax and validation errors that are applied automatically. Developers can also define custom error logic in resolvers so errors can be handled gracefully by the client.

A typical HTTP error can still be seen when there is an error in the API endpoint in front of a GraphQL server. For example, if the client was not authorized to interact with the GraphQL server, a 401 error is returned in the HTTP format. 

Monitoring errors in a GraphQL endpoint is more complex than Restful APIs. The status codes returned tend towards success (200) since any data that is found is returned. Error messages are secondary if only parts of the data needed are missing. Errors could instead be logged in the compute function behind the GraphQL server. If this is the case, CloudWatch log analytics would be helpful to track the errors. Custom metrics can be configured to differentiate errors. Developers can use third-party tools like Coralogix’s log analytics platform to analyze GraphQL logs and automatically find the causes of errors.

AWS API Gateway Monitoring

Developers could use many tools to host a cloud server. AWS, Azure, and many third-party companies accommodate API management tools that accommodate either RESTful or GraphQL architecture. Amazon’s API Gateway tool allows developers to build, manage, and maintain their endpoints.

API Gateway is backed by AWS’s monitoring tools, including but not limited to CloudWatch CloudTrail, and Kinesis. 

GraphQL Monitoring using CloudWatch API integration

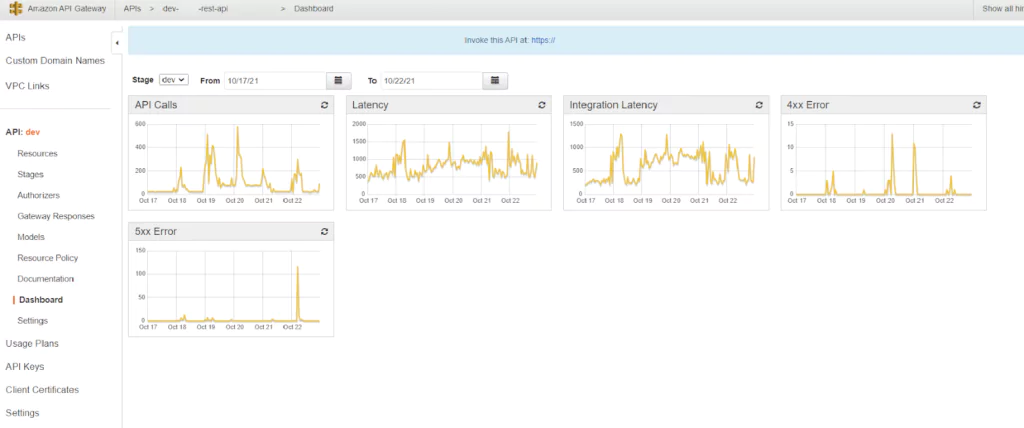
The API Gateway Dashboard page includes some high-level graphs. These all allow developers to check how their APIs are currently functioning. Graphs include the number of API calls over time, both latency and integration latency over time, and different returned errors (both 4xx and 5xx errors over time). While these graphs are helpful to see the overall health of an endpoint, they do little else to help determine the actual issue and fix it. 

In CloudWatch, users can get a more clear picture of which APIs are failing using CloudWatch metrics. The same graphs in the API Dashboard shown above are available for each method (GET, POST, PUT, etc.) and each endpoint resource. Developers can use these metrics to understand which APIs are causing issues, so troubleshooting and optimization can be focussed on specific APIs. Metrics may be sent to other systems like Coralogix’s scalable metrics platform for alerting and analysis.

Since RESTful endpoints have different resources defined for each unique need, these separate graphs help find where problems are in the server. For example, if a single endpoint has high latency, it would bring up the average latency for the entire API. That endpoint can be isolated using the resource-specific graphs and fixed after checking other logs. With GraphQL endpoints, these resource-specific graphs are less valuable since GraphQL uses a single endpoint to access all endpoint data. So, while the graphs show an increased latency, users cannot know which resolvers are to blame for the problem.

Differences in Endpoint Traffic Monitoring

GraphQL and REST use fundamentally different techniques to get data for a client. Differences in how traffic is routed and handled highlight differences in how monitoring can be applied. 

Caching

Caching data allows for reducing the traffic requirements of your endpoint. The HTTP specification used by RESTful APIs has caching requirements. Different endpoints can set up caching based on which path semantics are used. Servers can cache GET requests according to HTTP. However, since GraphQL uses a single POST endpoint, these defined specifications do not apply to GraphQL. It is up to developers to implement caching for non-mutable (query) endpoints. It is also critical that developers implement their requirements to separate mutable (mutation) and non-mutable (query) functions on their GraphQL server. 

Resource Fetching 

REST APIs typically require data chaining to get a complete data set. Clients first retrieve data about a user, then can retrieve other vital data subsequently using different calls. By design, REST endpoints are generally split to get data separately and point to different, single resources or databases. GraphQL, on the other hand, was designed to have a single endpoint that can point at many resources. So, clients can retrieve more data with a single query. GraphQL endpoints tend to require less traffic. This fundamental difference emphasizes the importance of traffic monitoring on REST endpoints over that need in GraphQL servers.

Summary

GraphQL uses a single HTTP endpoint for all functions and allows different requests to route to the appropriate location in the GraphQL server. Monitoring these endpoints can be more difficult since only a single endpoint is used. Log analytics plays a vital role in troubleshooting GraphQL endpoints because GraphQL monitoring is a uniquely tricky challenge.

RESTful endpoints use HTTP endpoints for each available request. Each request will return an appropriate status code and message based on whether the request was successful or not. Status codes can be used to monitor the health of the system and logs used to troubleshoot when functionality is not as expected. 

Third-party metrics tools can be used to monitor and alert on RESTful endpoints using status codes. Log analytics tools will help developers isolate and repair issues in both GraphQL and RESTful endpoints. 

Introducing Log Observability for Microservices

Two popular deployment architectures exist in software: the out-of-favor monolithic architecture and the newly popular microservices architecture. Monolithic architectures were quite popular in the past, with almost all companies adopting them. As time went on, the drawbacks of these systems drove companies to rework entire systems to use microservices instead.

Microservice Observability Logs

Monolithic architectures build applications using a single unit. They may contain a database, a client-facing application, and a server-side executable. Monoliths are simple to develop and deploy when small but quickly get large and unmanageable as a product grows. When upgrades or fixes are required, teams must deploy a new version of the entire executable.  

By contrast, microservice architectures use loosely-coupled services which communicate through various interfaces, often using cloud computing. Each service can be upgraded or fixed individually without requiring the deployment of the entire system. 

The microservice architecture builds a product as a series of small services that work together to become a product offering. Microservices are ideal for producing maintainable, scalable, and deployable code. They also enable development and quality control teams to work efficiently and independently on different features. However, with microservices comes increased complexity in monitoring system health. Monolithic architectures did not have the same observability issues as microservice architectures do. Microservice observability tools need to track data both within a single service and across different services.

As microservices have gained popularity, so have tools that provide microservice observability. Observability can help limit or prevent system failures, track security issues, monitor user-system interactions, and provide operational insights to reduce cost. This article discusses observability techniques and some of the microservices observability problems that can arise.

Logging for microservices

Logging is the same conceptually in both monolithic and microservice architecture. Logs tell your teams what is happening in your system. Microservices, however, require some further consideration over what has been sufficient for monolithic systems. Below are some tips on how to configure logging in microservices to be used with external tools. Tools such as Coralogix’s log analytics system can help you quickly troubleshoot your system when failures occur. Coralogix also provides examples of how to configure logging in apps.

Centralize log storage

Since microservices are ephemeral and distributed, services must send logs to a central location. When teams can view all logs together, it becomes possible to get an entire picture of what the system is doing rather than just a single service. This single location may be on a local server, a cloud service provider, or a third-party service specializing in observability tools. 

Structure log formatting

Logs tell developers and quality assurance teams what is happening in software. While making them human-readable is essential, having a consistent and structured format is also crucial. 

Human-readable logs are essential for finding specific issues in a microservice. However, logs alone are less helpful in finding troubleshooting issues in microservices simply because issues can take a significant amount of time to find. Without help from other tools, the scale and diversity of a distributed system can make finding specific events difficult. Using a consistent structure allows logs to be proactively analyzed. These make logs more easily searchable and can even provide insights that prevent issues. 

Label logs

Microservice logs come from a large number of sources. Aggregation and log analysis tools need to have a method for discriminating between logs for better analysis. Add labels to these logs for fast and efficient searching. These labels will allow tools to differentiate between logs and only include those necessary in an analysis. Developers can add labels into the log text itself, but keep in mind that you need a consistent log structure for searching.

Measuring microservice metrics

Metrics track numerical values associated with specific data measurements over time. Because they use numerical values, the data set tends to be smaller than logs. Their size allows them to be stored for longer and to scale more efficiently. Like logs, it is crucial to keep a consistent metadata format and associate descriptive labels with metrics to ensure fast and effective analysis. 

System metrics

System metrics are those values associated with your deployment’s infrastructure. Measurements could include performance, availability, reliability, duration, and memory use. 

Tracking these metrics can help your team understand where infrastructure designs may need to be changed or where additional infrastructure is needed to scale the system.

Network metrics

Network metrics are values related to the quality of service your system gives the end-user. Measurements could include bandwidth, throughput, latency, and connectivity. Tracking these metrics will show how the end-user is experiencing your app in terms of speed and quality of experience. Detecting and fixing poor experiences due to network issues can significantly differ the number of conversion rates of app users.

Business intelligence metrics

Business intelligence (BI) metrics are values related to sales and marketing successes and failures. Values tracked could include app traffic, bounce rates, open rates, and conversion rates. Teams often track these metrics in separate tools from technical metrics. However, keeping BI metrics with these technical measurements can help teams understand how technical issues affect customer interactions so you can best focus energies on fixing issues. 

Metric cardinality

Metrics tend to require less storage space than logs and are generally faster to query as well. The query speed and efficiency greatly depend on the cardinality of the data. A high cardinality metric will use a unique value for a label. For example, if you use a timestamp as a label, there will be very few metrics that use the same label. Since metric tools use labels for searching, high cardinality data may slow down your search. When designing your metric system, choose a tool with scalable metrics regardless of the label chosen, or be sure to choose labels wisely and keep cardinality low. 

Correlating Metrics

Developers should correlate the metrics discussed above in some centralized location. Doing this allows users to have a holistic view of what is going on in the system. If your system spans different metric collectors, you can use a third-party system that integrates metrics from multiple sources. Understanding how much capacity a system has or how many users tend to use services at a given time is invaluable to scaling, troubleshooting, and building your system. 

Tracing requests

Logs and metrics show what has happened to data in a single microservice. On the other hand, traces allow developers to understand the lifecycle of any given request in a system. Traces are pieces of metadata that flow with a request through the entire distributed system. They show you where data moves from one service to another, where bottlenecks are in the system, and where errors have occurred.

Traces can point to microservices or infrastructure that are causing errors in your system. Once the erroring service is known, troubleshooters can use logs and metrics to zero in on the problem and fix it. Without traces to point to the error in the first place, troubleshooting can take significantly longer. Unlike monolithic deployments, microservice issues often cannot be found by isolating and recreating issues. Traces provide an alternative tracking method for teams.

Service mesh for distributed tracing

Service meshes work as an intermediary for data between microservices. They operate outside of the microservice itself as a separate infrastructure layer. Meshes themselves can include logs or metrics to help users understand how microservices are interacting. Since all data flows through them to get to a service, they can inject traces as metadata onto microservice calls. 

Service meshes provide a clean way to implement traces in microservices deployed on containers like Kubernetes. Service meshes may already be in place for load balancing or security. Using these also means developers do not need to alter container code to implement tracing.

Wrapping up

Microservice architecture gives development teams more flexibility than ever before when implementing various tools in a single product offering. Developers could work on a unique feature within the product using different development tools and even languages. Features could be deployed as they were made ready without disrupting other parts of the product. Deployments no longer require product downtime and could be done one microservice at a time.

Products must attain microservice observability differently than they would for monolithic services. While monoliths required developers to zone in on issues using logs and test inputs, microservice require more involved tools. The benefits of microservices still outweigh these new issues they have brought forth. 

Designs must include logging, metrics, and traces in their distribution system to obtain microservice observability. Including logging, metrics, and traces will give developers the tools needed to find and fix issues efficiently and effectively. Using a centralized tool to analyze each of these data sets can help your team find errors first before clients see them. Coralogix offers a platform that uses machine learning to predict where errors will occur. 

Discovering the Differences Between Log Observability and Monitoring

Log observability and log monitoring are terms often used interchangeably, but really they describe two approaches to solving and understanding different things. 

Observability refers to the ability to understand the state of a complex system (or series of systems) without needing to make any changes or deploy new code. 

Monitoring is the collection, aggregation, and analysis of data (from applications, networks, and systems) which allows engineers to both proactively and reactively deal with problems in production.

It’s easy to see why they’re treated as interchangeable terms, as they are deeply tied to each other. Without monitoring, there would be no observability (because you need all of that data that you’re collecting and aggregating in order to gain system observability). That said, there’s a lot more to observability than passively monitoring systems in case something goes wrong.

In this article, we will examine the different elements that make up monitoring and observability and see how they overlap. 

Types of Monitoring

Monitoring is a complex and diverse field. There are a number of key elements and practices that should be employed for effective monitoring. If monitoring refers to looking at a series of processes, and how they are conducted, whether they complete successfully and efficiently, then you should be aware of the following types of monitoring to build your monitoring practice.

Black and White Box Monitoring

Black box monitoring, also known as server-level monitoring, refers to the monitoring of specific metrics on the server such as disk space, health, CPU metrics, and load. At a granular level, this means aggregating data from network switches, load balancers, looking at disk health, and many other metrics that you may traditionally associate with system administration.

White box monitoring refers more specifically to what is running on the server. This can include things like queries to databases, application performance versus user requests, and what response codes your application is generating. White box monitoring is critical for application and web layer vulnerability understanding.

White and black box monitoring shouldn’t be practiced in isolation. Previously, more focus may have been given to black box or server-level monitoring. However, with the rise of the DevOps and DevSecOps methodologies, they are more frequently carried out in tandem. When using black and white box monitoring harmoniously, you can use the principles of observability to gain a better understanding of total system health and performance. More on that later!

Real-Time vs Trend Analysis

Real-time monitoring is critical for understanding what is going on in your system. It covers the active status of your environment, with log and metric data relating to things like availability, response time, CPU usage, and latency. Strong real-time analysis is important for setting accurate and useful alerts, which may notify you of critical events such as outages and security breaches. Log observability and monitoring depend heavily on real-time analysis.

Think of trend analysis as the next stage of real-time analysis. If you’re collecting data and monitoring events in your system in real-time, trend analysis is helpful for gaining visibility into patterns of events. This can be accomplished with a visualization tool, such as Kibana or native Coralogix dashboards.

Trend analysis allows organizations to correlate information and events from disparate systems which may together paint a better picture of system health or performance. Thinking back to the introduction of this piece, we can see where this might link into observability.

Performance Monitoring

Performance monitoring is pretty self-explanatory. It is a set of processes that enable you to understand either network, server, or application performance. This is closely linked to system monitoring, which may be the combination of multiple metrics from multiple sources. 

Performance monitoring is particularly important for organizations with customer-facing applications or platforms. If your customers catch problems before you do, then you risk reputational or financial impact. 

Analyzing Metrics

Good monitoring relies on the collection, aggregation, and analysis of metrics. How these metrics are analyzed will vary from organization to organization, or on a more granular level, from team to team.

There is no “one size fits all” for analyzing metrics. However, there are two powerful tools at your disposal when considering metric analysis. 

Visualization 

Data visualization is nothing particularly new. However, its value in the context of monitoring is significant. Depending on what you choose to plot on a dashboard, you can cross-pollinate data from different sources which enhances your overall system understanding.

For example, you might see on a single dashboard with multiple metrics that your response time is particularly high during a specific part of the day. When this is overlaid with network latency, CPU performance, and third-party outages, you can gain context.

Context is key here. Visualization gives your engineers the context to truly understand events in your system, not as isolated incidents, but interconnected events.

Machine Learning

The introduction of machine learning to log and metric analysis is an industry-wide game changer. Machine learning allows predictive analytics based on your current system health and status and past events. Log observability and monitoring are taken to the next level by machine learning practices.

Sifting through logs for log observability and monitoring is an often time-consuming task. However, tools like Loggregation effectively filter and promote logs based on precedent, without needing user intervention. Not only does this save time in analysis, which is particularly important post-security events, but it also means your logging system stays lean and accurate.

Defining Rules

Monitoring traditionally relies on rules which trigger alerts. These rules often need to be fine-tuned over time, because setting rules to alert you of things that you don’t know are going to happen in advance is difficult.

Additionally, rules are only as good as your understanding of the system they relate to. Alerts and rules require a good amount of testing, to prepare you for each possible eventuality. While machine learning (as discussed above) can make this a lot easier for your team, it’s important to get the noise-to-signal ratio correct.

The Noise-to-Signal Ratio

This is a scientific term (backed up by a formula), which helps to define what the acceptable level of background noise is for clear signals or, in this case, insights. In terms of monitoring, rules, and alerts; we’re talking about how many false or acceptable error messages there are in combination with unhelpful log data. Coralogix has a whole set of features that help filter out the noise, while ensuring the important signals reach their target, to help defend your log observability and monitoring against unexpected changes in data.

From Monitoring to Observability

So what is the difference then? 

Monitoring is the harvesting and aggregation of data and metrics from your system. Observability builds on this and turns the harvested data into insights and actionable intelligence about your system. If monitoring provides visibility, then observability provides context.

A truly observable system provides all the data that’s needed in order to understand what’s going on, without the need for more data. Ultimately, an observability platform gives you the ability to see trends and abnormalities as they emerge, instead of waiting for alerts to be triggered. A cornerstone of your observability is log observability and monitoring. 

In this way, you can use marketing metrics as a diagnostic tool for system health, or even understand the human aspect of responses to outages by pulling in data from collaboration tools.

Log Observability and Monitoring

Monitoring and observability shouldn’t be viewed in isolation: the former is a precursor to the latter. Observability has taken monitoring up a few notches, meaning that you don’t need to know every question you’ll ask of your system before implementing the solution.

True observability is heterogeneous, allowing you to cross-analyze data from your Kubernetes cluster, your firewall, and your load balancer in a single pane of glass. Why? Well, you might not know why you need it yet, but the beauty of a truly observable system is that it’s there when you need to query it. 

As systems grow ever more advanced, and there are increasing numbers of variables in play, a robust observability platform will give you the information and context you need to stay in the know.