JSON Logging: What, Why, How, & Tips

When you’re working with large data sets, having that data structured in a way that means you can use software to process and understand it will enable you to derive insights far more quickly than any manual approach. Logfile data is no exception.

As increasing numbers of organizations embrace the idea that log files can offer far more than an aid to troubleshooting or a regulatory requirement, the importance of log file monitoring and structuring the data in those log files so that it can be extracted, manipulated, and analyzed efficiently is quickly moving up the priority list. In this article, we’re going to explore one of the most popular formats for structuring log files: JSON.

What is JSON?

JSON, or JavaScript Object Notation to give it its full form, is a machine-readable syntax for encoding and exchanging data. Despite the name, you’ll find JSON in use far outside its original realm of web servers and browsers. With all major computing languages supporting it, JSON is one of the most widely used formats for exchanging data in machine-to-machine communications.

One of the advantages of JSON over other data exchange formats, such as XML, is that it’s easy for us humans to both read and write. Unlike XML, JSON doesn’t rely on a complex schema and completely avoids the forest of angle brackets that results from requiring everything to be enclosed within tags. This makes it much easier for first-time users to get started with JSON.

A JSON document is made up of a simple syntax of key-value pairs ordered and nested within arrays. For example, a key called “status” might have values “success,” “warning,” and “error.” Keys are defined within the document and are always quoted, meaning there are no reserved words to avoid, and arrays can be nested to create hierarchies. 

That means you can create whatever keys make sense for your context, and structure them however you need. The keys and how they are nested (the JSON specification) need to be agreed upon between the sender and the recipient, which can then read the file and extract the data as required.

The simplicity and flexibility of JSON make it an ideal candidate for generating structured log statements; log data can be extracted and analyzed programmatically, while the messages remain easy for individuals to understand. JSON logging is supported by all major programming languages, either natively or via libraries.

Benefits of JSON logging

Given that log messages are always generated by software, you might expect that they are always structured and be wondering what JSON can add. While it’s true that log messages will always follow a particular syntax (in accordance with how the software has been programmed to output logs), that syntax could be one long string of characters, multiple lines of obscure codes and statuses, or a series of values delimited by a character of the programmer’s choice.

In order to make sense of these logs, you first need to decipher their syntax and then write logic to parse the messages and extract the data you need. Unfortunately, that logic is often quite brittle, so if something changes in the log format – perhaps a new piece of data is included, or the order of items is changed – then the parser will break. 

If you’re only dealing with logs from a single system that you have control over, that might be manageable. But the reality in many enterprises is that you’re working with multiple systems and services, some developed in-house and others that are open-source or commercial, and all of them are generating log messages.

Those log messages are a potential mine of information that can be used to gain insights into how your systems – and therefore your business – are performing. However, before you can derive those insights, you first need to make sense of the information that is being provided. Writing and maintaining custom logic to parse logs for dozens of pieces of software is no small task. 

That’s where a structured format such as JSON can help. The key-value pairs make it easy to extract specific values and to filter and search across a data set. If new key-value pairs are added, the software parsing the log messages will just ignore those keys it doesn’t expect, rather than failing completely.

Writing logs in JSON format

So what does a log message written in JSON look like? The following is an example log line generated by an Nginx web server and formatted in JSON:

{
"time": "17/May/2015:08:05:24 +0000",
"remote_ip": "31.22.86.126",
"remote_user": "-",
"request": "GET /downloads/product_1 HTTP/1.1",
"response": 304,
"bytes": 0,
"referrer": "-",
"agent": "Debian APT-HTTP/1.3 (0.8.16~exp12ubuntu10.16)"
}

The same data in combined log format would look like this:

31.22.86.126 - - 17/May/2015:08:05:24 +0000 "GET /downloads/product_1 HTTP/1.1" 304 0 "-" "Debian APT-HTTP/1.3 (0.8.16~exp12ubuntu10.16)"

With the JSON format, it’s easy for someone unfamiliar with web server logs to understand what the message contains, as each field is labeled. With a common log format, you need to know what you’re looking at.

Of course, common log format is widely used by web servers, and most log analysis platforms can parse it natively, without further manual configuration. But what about log files generated by other software, such as a custom-built application or third-party software? Looking at this unstructured log file from an iOS application you’d be forgiven for wondering what it’s telling you:

08:51:08 [DataLogger:27]: G L 35.76 +/- 12m <+52.55497710,-0.38856690> +/- 15.27m 0.60

A JSON formatted version of the same log returns:

{
  "eventTime": "08:51:08",
  "source":
      {
      "file": "DataLogger",
      "line": 27
      },
  "eventType": "GPS update",
  "eventData":
{
      "altitude": 35.76,
    "verticalAccuracy": 12,
      "latitude": 52.55497710,
      "longitude": -0.38856690,
      "horizontalAccuracy": 15.27,
      "speed": 0.60
  }
}

With this format, it’s easy to understand the values and see how the fields are related.

JSON logging best practices

Now that we’ve covered the what, why, and how of JSON logging, let’s discuss some tips to help you get the most out of your JSON logs. Most of these apply whether you’re writing software in-house or are using third-party or open-source tools that allow you to configure the format of the logs they output.

Invest time in designing your logs

Just as you wouldn’t jump in and start writing code for the next ticket on the backlog without first thinking through the problem you’re trying to solve and how it fits into the wider solution, it’s important to take the time to design your log format. There is no standard format for JSON logs – just the JSON syntax – so you can decide on a structure to serve your needs.

When defining keys, think about what level of granularity makes sense. For example, do you need a dedicated “error” key, or is it more useful to have a key labeled “message” that is used for any type of message, and another labeled “status” that will record whether the message was an error, warning, or just information? With the latter approach, you can filter log data by status to view only error messages while reducing the number of columns and filter options.

Add log lines as you code

If you’re developing software in-house, make adding log lines as much a part of your code hygiene as writing unit tests. It’s much easier to decide what information would be useful to output, and at what level (for example, is this a critical error or just useful to know when debugging) when you’re writing that particular piece of functionality, than after you’ve finished the development work.

Capture as much detail as possible

When you’re thinking about what data to capture, it’s easy to focus on the parameters you want to be able to filter, sort, and query by, while losing sight of what you might want to learn from your logs when drilling down into more detail. 

Log files provide value on both a macro and micro level: by aggregating and analyzing log files, we can identify patterns of behavior and spot changes that might indicate a problem. Once we know where to look, we can zoom into the individual log files to find out more about what’s going on. This is where capturing as much detail as possible pays dividends.

For application logs, details such as the module name and line number will help you identify the cause of the problem quickly. In the case of server access logs, details such as the requester’s IP, their time zone, logged-in username, and authentication method can be invaluable when investigating a potential security breach.

Keep in mind that not all data needs to be broken down into separate fields; you can create a key to capture more verbose information that you wouldn’t want to filter by, but which is useful when reading individual log messages.

Consistency is king

Being consistent in the way you name keys and the way you record values will help you to analyze logs more efficiently. This applies both within a single piece of software and when designing logs across multiple systems and services. 

For example, using the same set of log levels across applications means you can easily filter by a particular type while being consistent in writing status codes, as either strings or numbers will ensure you can manipulate the data effectively.

Unstructured logs – parsing to JSON

Although structuring logs with JSON offers many advantages, in some cases it’s not possible to output logs in this format. For some third-party software, you may not have the ability to configure the format or content of log messages. 

If you’re dealing with a legacy system plagued with technical debt, the effort involved in updating the logging mechanism might not be justified – particularly if work on a replacement is underway.

When you’re stuck with an existing unstructured log format, the next best thing is to parse those logs into a JSON format after the fact. This involves identifying the individual values within each message (using a regular expression, for example) and mapping them to particular keys. 

Many log analysis platforms allow you to configure rules for parsing unstructured logs to JSON so that they can be processed automatically. You can then analyze the data programmatically alongside your structured log data. Transforming logs to JSON also renders the individual log files more readable to humans, ready for when you want to drill down in more detail.  

JSON log analytics with Coralogix

By structuring your logs in JSON format you can more effectively analyze log files from multiple sources and leverage machine learning techniques to identify trends and anomalies in your data. Because JSON is easy to read, you can still view and understand individual log entries when investigating and troubleshooting issues.

As a log analysis and observability platform, Coralogix automatically extracts fields from your JSON logs so that you can filter, sort, query, and visualize according to your JSON log file viewer. With custom views, you can configure reports based on the fields you’re interested in. For unstructured logs, you can set up log parsing rules to extract values and append the JSON to the log entry, or replace the entire entry with structured JSON, according to your needs. Using the Coralogix log analytics platform you can collate and aggregate logs from multiple sources and use sophisticated data analysis tools to improve your understanding of your systems and unlock valuable insights.

A Practical Guide to Logstash: Parsing Common Log Patterns with Grok

In a previous post, we explored the basic concepts behind using Grok patterns with Logstash to parse files. We saw how versatile this combo is and how it can be adapted to process almost anything we want to throw at it. But the first few times you use something, it can be hard to figure out how to configure for your specific use case. Looking at real-world examples can help here, so let’s learn how to use Grok patterns in Logstash to parse common logs we’d often encounter, such as those generated by Nginx, MySQL, Elasticsearch, and others.

First, Some Preparation

We’ll take a look at a lot of example logs and Logstash config files in this post so, if you want to follow along, instead of downloading each one at each step, let’s just copy all of them at once and place them in the “/etc/logstash/conf.d/logstash” directory.

First, install Git if it’s not already installed:

sudo apt update && sudo apt install git

Now let’s download the files and place them in the directory:

sudo git clone https://github.com/coralogix-resources/logstash.git /etc/logstash/conf.d/logstash

NGINX Access Logs

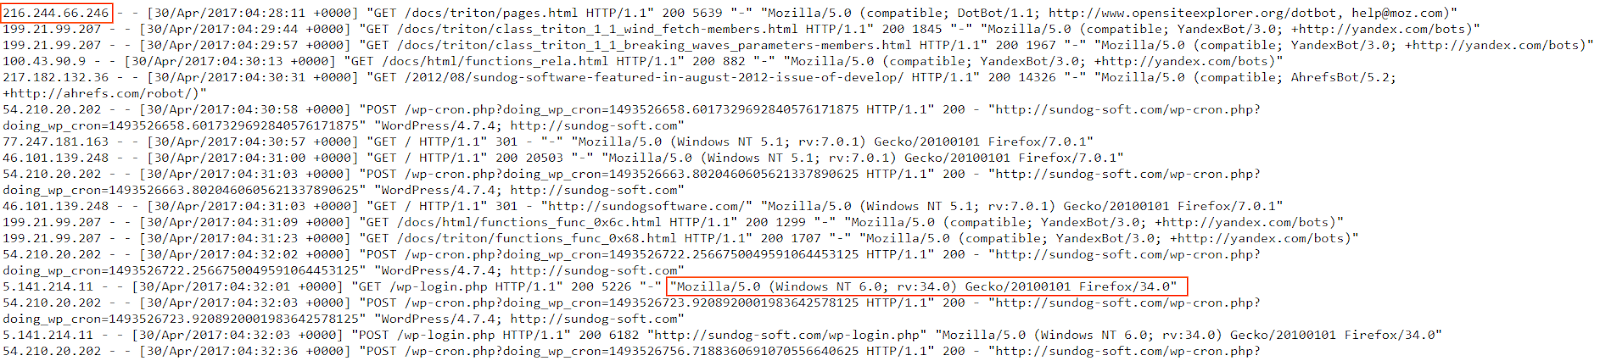
NGINX and Apache are the most popular web servers in the world. So, chances are, we will often have contact with the logs they generate. These logs reveal information about visits to your site like file access requests, NGINX responses to those requests, and information about the actual visitors, including their IP, browser, operating system, etc. This data is helpful for general business intelligence, but also for monitoring for security threats by malicious actors. 

Let’s see how a typical Nginx log is structured.

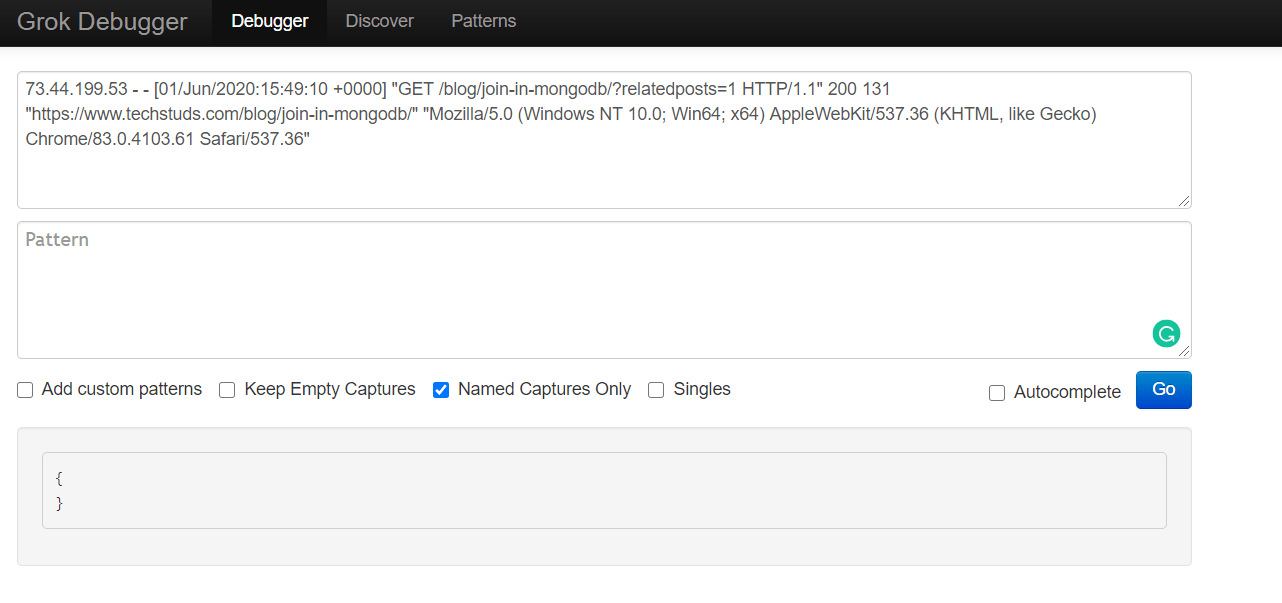
We’ll open the following link in a web browser https://raw.githubusercontent.com/coralogix-resources/logstash/master/nginx/access.log and then copy the first line. Depending on your monitor’s resolution, the first line might actually be broken into two lines, to fit on the screen (otherwise called “line wrapping”). To avoid any mistakes, here is the exact content of the line we will copy:

73.44.199.53 - - [01/Jun/2020:15:49:10 +0000] "GET /blog/join-in-mongodb/?relatedposts=1 HTTP/1.1" 200 131 "https://www.techstuds.com/blog/join-in-mongodb/" "Mozilla/5.0 (Windows NT 10.0; Win64; x64) AppleWebKit/537.36 (KHTML, like Gecko) Chrome/83.0.4103.61 Safari/537.36"

Original image link here

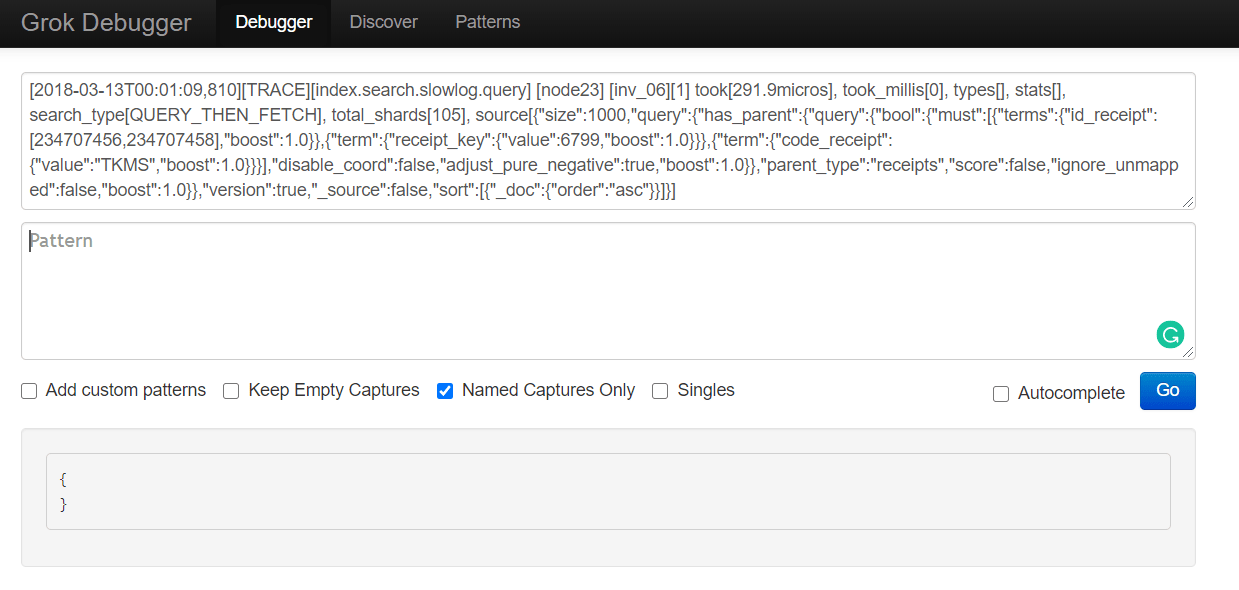
Next, let’s open the Grok Debugger Tool at https://grokdebug.herokuapp.com/ to help us out. In the first field, the input section, we’ll paste the previously copied line.

Original image link here

Now let’s have a look at the Logstash config we’ll use to parse our Nginx log: https://raw.githubusercontent.com/coralogix-resources/logstash/master/nginx/nginx-access-final.conf

From here, we’ll copy the Grok pattern from the “match” section. This is the exact string we should copy:

%{IPORHOST:remote_ip} - %{DATA:user_name} [%{HTTPDATE:access_time}] "%{WORD:http_method} %{DATA:url} HTTP/%{NUMBER:http_version}" %{NUMBER:response_code} %{NUMBER:body_sent_bytes} "%{DATA:referrer}" "%{DATA:agent}"

Original image link 

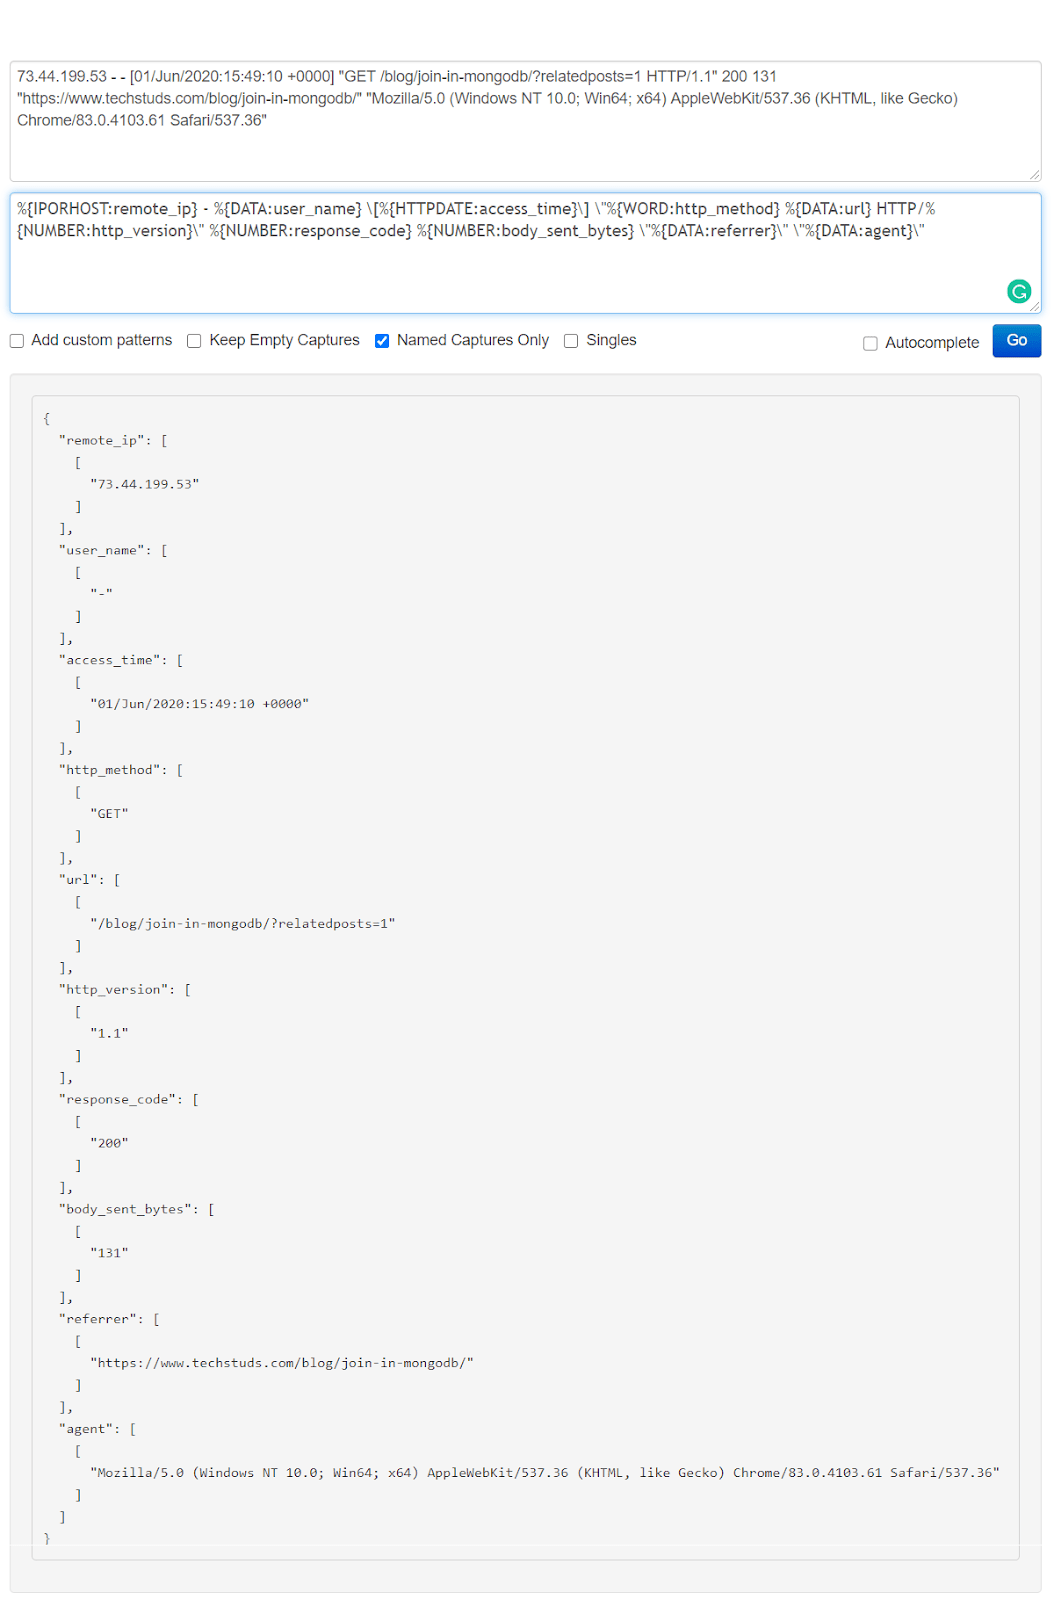
We go back to the https://grokdebug.herokuapp.com/ website and paste the Grok pattern in the second field, the pattern section. We’ll also tick the “Named captures only” checkbox and then click the “Go” button.

Note: For every line you copy and paste, make sure there are no empty lines before (or after) the actual text in the pattern field. Depending on how you copy and paste text, sometimes an empty line might get inserted before or after the copied string, which will make the Grok Debugger fail to parse your text. If this happens, just delete the empty line(s).

Original image link here

This tool is useful to test if our Grok patterns work as intended. It makes it convenient to try out new patterns, or modify existing ones and see in advance if they produce the desired results.

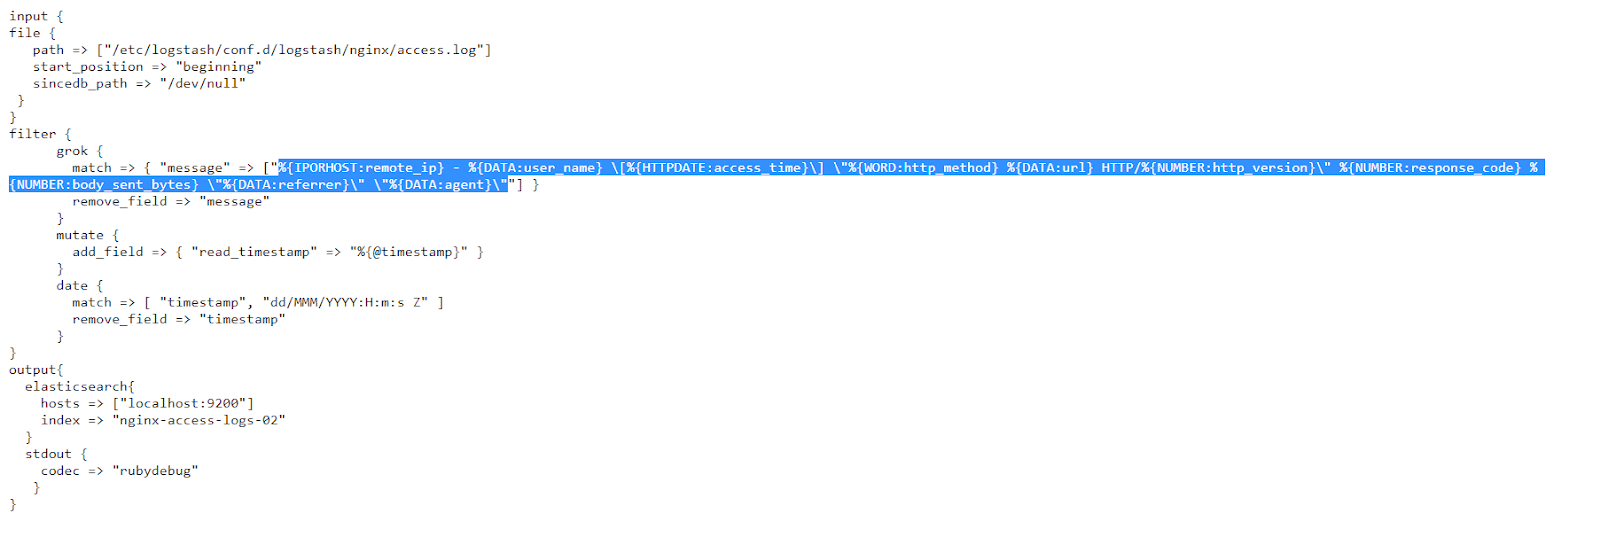
Now that we’ve seen that this correctly separates and extracts the data we need, let’s run Logstash with the configuration created specifically to work with the Nginx log file:

sudo /usr/share/logstash/bin/logstash -f /etc/logstash/conf.d/logstash/nginx/nginx-access-final.conf

The job should finish in a few seconds. When we notice no more output is generated, we can close Logstash by pressing CTRL+C.

Now let’s see how the log file has been parsed and indexed:

curl -XGET "https://localhost:9200/nginx-access-logs-02/_search?pretty" -H 'Content-Type: application/json' -d'{
  "size": 1, 
  "track_total_hits": true,
  "query": {
    "bool": {
      "must_not": [
        {
          "term": {
            "tags.keyword": "_grokparsefailure"
          }
        }
      ]
    }
  }
}'

We’ll see a response similar to the following:

      {
        "_index" : "nginx-access-logs-02",
        "_type" : "_doc",
        "_id" : "vvhO2XIBB7MjzkVPHJhV",
        "_score" : 0.0,
        "_source" : {
          "access_time" : "01/Jun/2020:15:49:10 +0000",
          "user_name" : "-",
          "url" : "/blog/join-in-mongodb/?relatedposts=1",
          "path" : "/etc/logstash/conf.d/logstash/nginx/access.log",
          "body_sent_bytes" : "131",
          "response_code" : "200",
          "@version" : "1",
          "referrer" : "https://www.techstuds.com/blog/join-in-mongodb/",
          "http_version" : "1.1",
          "read_timestamp" : "2020-06-21T23:54:33.738Z",
          "@timestamp" : "2020-06-21T23:54:33.738Z",
          "agent" : "Mozilla/5.0 (Windows NT 10.0; Win64; x64) AppleWebKit/537.36 (KHTML, like Gecko) Chrome/83.0.4103.61 Safari/537.36",
          "http_method" : "GET",
          "host" : "coralogix",
          "remote_ip" : "73.44.199.53"
        }

We can see the fields and their associated values neatly extracted by the Grok patterns.
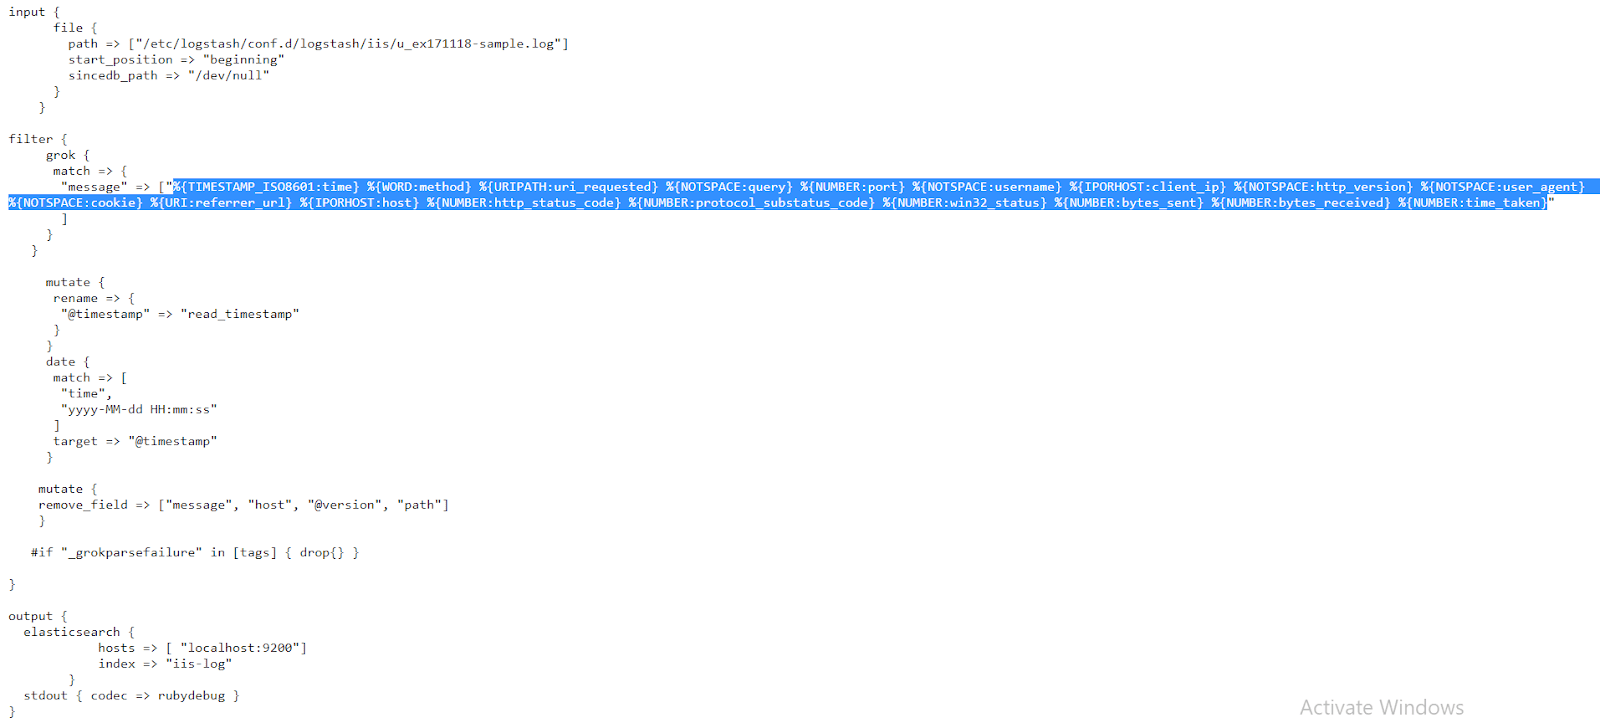
IIS Logs

While we’ll often see Apache and Nginx web servers on the Linux operating system, Microsoft Windows has its own web server included in IIS (Internet Information Services). These generate their own logs that can be helpful to monitor the state and activity of applications. Let’s learn how to parse logs generated by IIS.

Just as before, we will take a look at the sample log file and extract the first useful line: https://raw.githubusercontent.com/coralogix-resources/logstash/master/iis/u_ex171118-sample.log.

We’ll ignore the first few lines starting with “#” as that is a header, and not actual logged data. The line we’ll extract is the following:

2017-11-18 08:48:20 GET /de adpar=12345&gclid=1234567890 443 - 149.172.138.41 HTTP/2.0 Mozilla/5.0+(Windows+NT+10.0;+Win64;+x64)+AppleWebKit/537.36+(KHTML,+like+Gecko)+Chrome/62.0.3202.89+Safari/537.36+OPR/49.0.2725.39 - https://www.google.de/ www.site-logfile-explorer.com 301 0 0 624 543 46

Original image link here

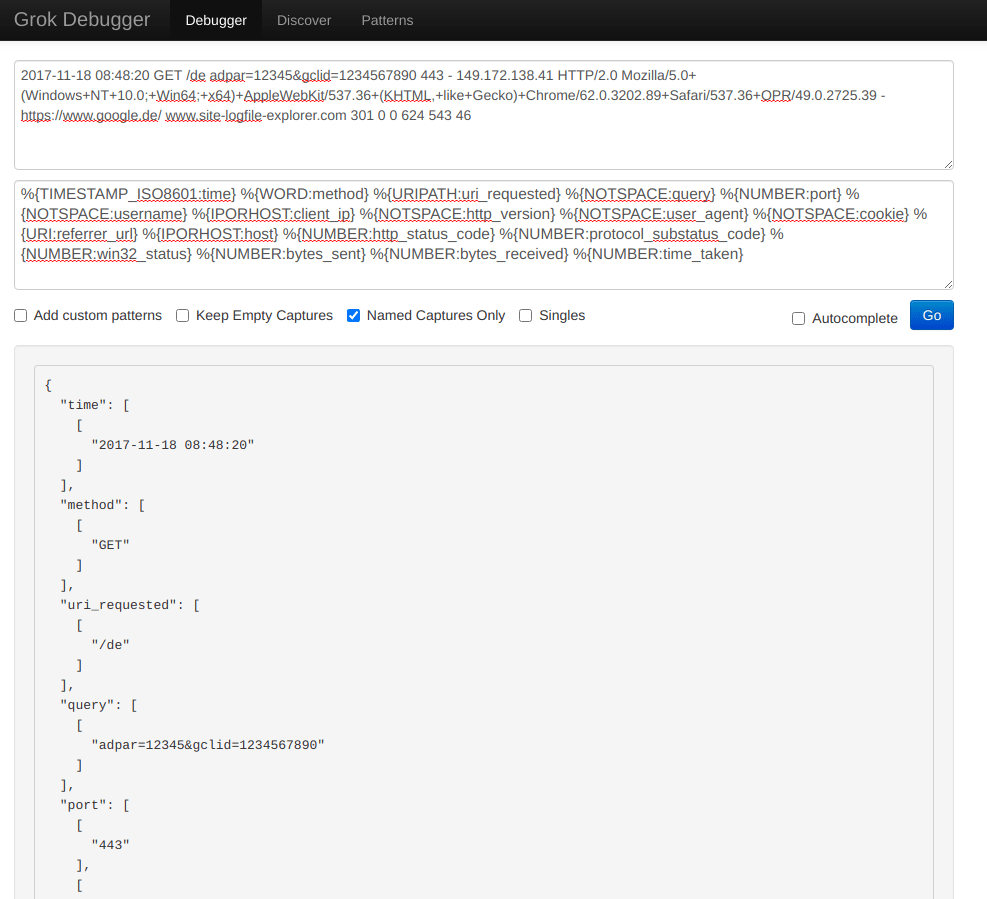
Once again, to take a closer look at how our specific Grok patterns will work, we’ll paste our log line into the Grok Debugger Tool tool, in the first field, the input section.

Original image link here

The config file we’ll use to parse the log can be found at https://raw.githubusercontent.com/coralogix-resources/logstash/master/iis/iis-final-working.conf.

Original image link here 

Once again, let’s copy the Grok pattern within:

%{TIMESTAMP_ISO8601:time} %{WORD:method} %{URIPATH:uri_requested} %{NOTSPACE:query} %{NUMBER:port} %{NOTSPACE:username} %{IPORHOST:client_ip} %{NOTSPACE:http_version} %{NOTSPACE:user_agent} %{NOTSPACE:cookie} %{URI:referrer_url} %{IPORHOST:host} %{NUMBER:http_status_code} %{NUMBER:protocol_substatus_code} %{NUMBER:win32_status} %{NUMBER:bytes_sent} %{NUMBER:bytes_received} %{NUMBER:time_taken}

…and paste it to the second field in the https://grokdebug.herokuapp.com/ website, the pattern section:

Original Image Link here

Let’s run Logstash and parse this IIS log:

sudo /usr/share/logstash/bin/logstash -f /etc/logstash/conf.d/logstash/iis/iis-final-working.conf

As usual, we’ll wait for a few seconds until the job is done and then press CTRL+C to exit the utility.

Let’s look at the parsed data:

curl -XGET "https://localhost:9200/iis-log/_search?pretty" -H 'Content-Type: application/json' -d'{
  "size": 1, 
  "track_total_hits": true,
  "query": {
    "bool": {
      "must_not": [
        {
          "term": {
            "tags.keyword": "_grokparsefailure"
          }
        }
      ]
    }
  }
}'

A response similar to the following shows us that everything is neatly structured in the index.

      {
        "_index" : "iis-log",
        "_type" : "_doc",
        "_id" : "6_i62XIBB7MjzkVPS5xL",
        "_score" : 0.0,
        "_source" : {
          "http_version" : "HTTP/2.0",
          "query" : "adpar=12345&gclid=1234567890",
          "bytes_received" : "543",
          "read_timestamp" : "2020-06-22T01:52:43.628Z",
          "user_agent" : "Mozilla/5.0+(Windows+NT+10.0;+Win64;+x64)+AppleWebKit/537.36+(KHTML,+like+Gecko)+Chrome/62.0.3202.89+Safari/537.36+OPR/49.0.2725.39",
          "uri_requested" : "/de",
          "username" : "-",
          "time_taken" : "46",
          "referrer_url" : "https://www.google.de/",
          "client_ip" : "149.172.138.41",
          "http_status_code" : "301",
          "bytes_sent" : "624",
          "time" : "2017-11-18 08:48:20",
          "cookie" : "-",
          "method" : "GET",
          "@timestamp" : "2017-11-18T06:48:20.000Z",
          "protocol_substatus_code" : "0",
          "win32_status" : "0",
          "port" : "443"
        }

MongoDB Logs

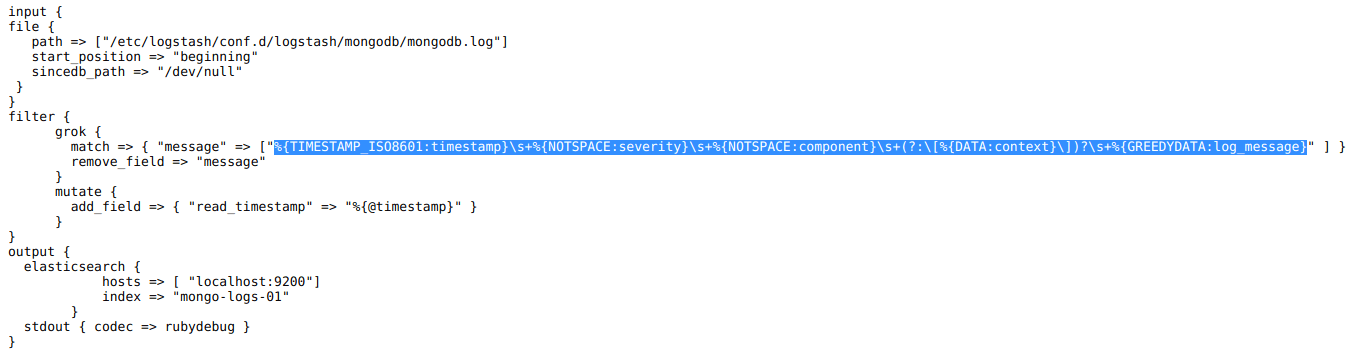
While not as popular as MySQL, the MongoDB database engine still has a fairly significant market share and is used by many leading companies. The MongoDB logs can help us track the database performance and resource utilization to help with troubleshooting and performance tuning. 

Let’s see how a MongoDB log looks like: https://raw.githubusercontent.com/coralogix-resources/logstash/master/mongodb/mongodb.log.

Original image link

We can see fields are structured in a less repetitive and predictable way than in a typical Nginx log.

Let’s copy the first line from the log and paste it into the first field of the Grok Debugger Tool website.

2019-06-25T10:08:01.111+0000 I CONTROL  [main] Automatically disabling TLS 1.0, to force-enable TLS 1.0 specify --sslDisabledProtocols 'none'

Original image link

The config file we will use for Logstash, to parse our log, can be found at https://raw.githubusercontent.com/coralogix-resources/logstash/master/mongodb/mongodb-final.conf.

Original image link

And here is the Grok pattern we need to copy:

%{TIMESTAMP_ISO8601:timestamp}s+%{NOTSPACE:severity}s+%{NOTSPACE:component}s+(?:[%{DATA:context}])?s+%{GREEDYDATA:log_message}

As usual, let’s paste it to the second field in the https://grokdebug.herokuapp.com/ website.

Original image link 

Let’s run Logstash:

sudo /usr/share/logstash/bin/logstash -f /etc/logstash/conf.d/logstash/mongodb/mongodb-final.conf

When the job is done, we press CTRL+C to exit the program and then we can take a look at how the data was parsed:

curl -XGET "https://localhost:9200/mongo-logs-01/_search?pretty" -H 'Content-Type: application/json' -d'{
  "size": 1, 
  "track_total_hits": true,
  "query": {
    "bool": {
      "must_not": [
        {
          "term": {
            "tags.keyword": "_grokparsefailure"
          }
        }
      ]
    }
  }
}'

The output should be similar to the following:

      {
        "_index" : "mongo-logs-01",
        "_type" : "_doc",
        "_id" : "0vjo2XIBB7MjzkVPS6y9",
        "_score" : 0.0,
        "_source" : {
          "log_message" : "Automatically disabling TLS 1.0, to force-enable TLS 1.0 specify --sslDisabledProtocols 'none'",
          "@timestamp" : "2020-06-22T02:42:58.604Z",
          "timestamp" : "2019-06-25T10:08:01.111+0000",
          "context" : "main",
          "component" : "CONTROL",
          "read_timestamp" : "2020-06-22T02:42:58.604Z",
          "@version" : "1",
          "path" : "/etc/logstash/conf.d/logstash/mongodb/mongodb.log",
          "host" : "coralogix",
          "severity" : "I"
        }

User Agent Mapping and IP to Geo Location Mapping in Logs

Very often, when a web browser requests a web page from a web server, it also sends a so-called “user agent”. This can contain information such as the operating system used by a user, the device, the web browser name and version and so on. Obviously, this can be very useful data in certain scenarios. For example, it can help you find out if users of a particular operating system are experiencing issues.

Web servers also log the IP addresses of the visitors. While that’s useful to have in raw logs, those numbers themselves are not always useful to humans. They might be nice to have when trying to debug connectivity issues, or block a class of IPs, but for statistics and charts, it might be more relevant to have the geographic location of each IP, like country/city and so on.

Logstash can “transform” user agents like

Mozilla/5.0+(Windows+NT+10.0;+Win64;+x64)+AppleWebKit/537.36+(KHTML,+like+Gecko)+Chrome/62.0.3202.89+Safari/537.36+OPR/49.0.2725.39

to the actual names of the specific operating system, device and/or browser that was used, and other info which is much more easy to read and understand by humans. Likewise, IP addresses can be transformed to estimated geographical locations. The technical term for these transformations is mapping.

Let’s take a look at an Apache access log: https://raw.githubusercontent.com/coralogix-resources/logstash/master/apache/access_log.

Original image link

We notice IP addresses and user agents all throughout the log. Now let’s see the Logstash config we’ll use to do our mapping magic with this information: https://raw.githubusercontent.com/coralogix-resources/logstash/master/apache/apache-access-enriched.conf.

The interesting entries here can be seen under “useragent” and “geoip“.

Original image link 

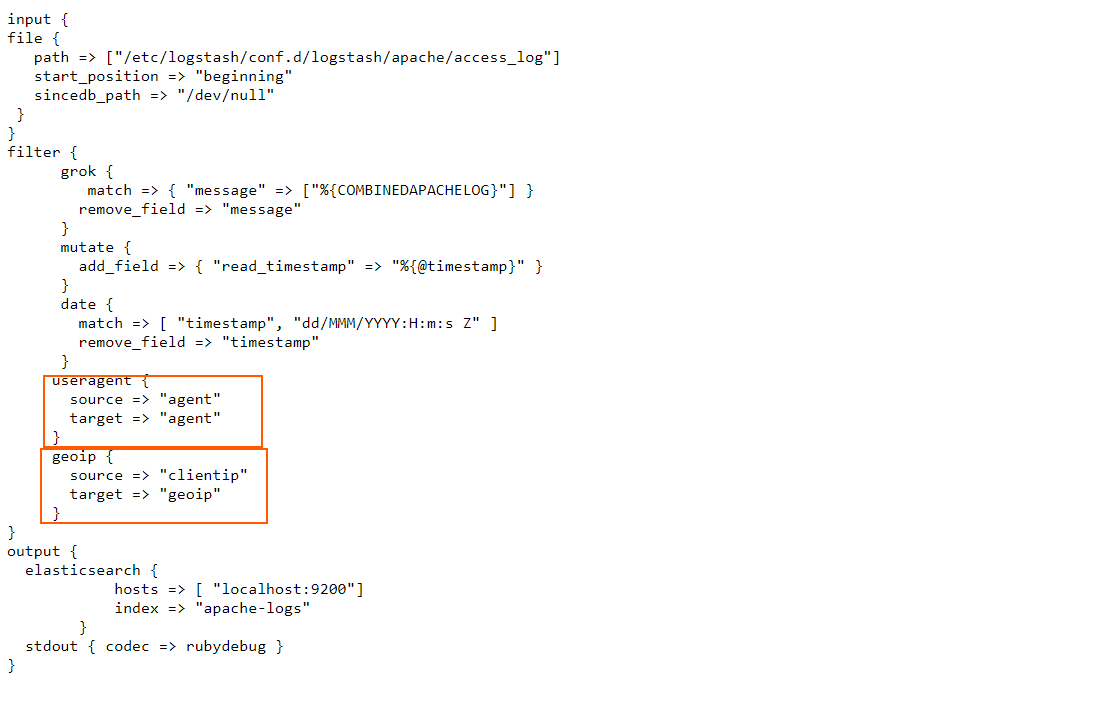
In the useragent filter section, we simply instruct Logstash to take the contents of the agent field, process them accordingly, and map them back to the agent field.

In the geoip filter, we instruct Logstash to take the information from the clientip field, process it, and then insert the output in a new field, called geoip.

Let’s run Logstash with this config and see what happens:

sudo /usr/share/logstash/bin/logstash -f /etc/logstash/conf.d/logstash/apache/apache-access-enriched.conf

We’ll need to wait for a longer period of time for this to be done as there are many more lines the utility has to process (tens of thousands). As usual, when it’s done, we’ll press CTRL+C to exit.

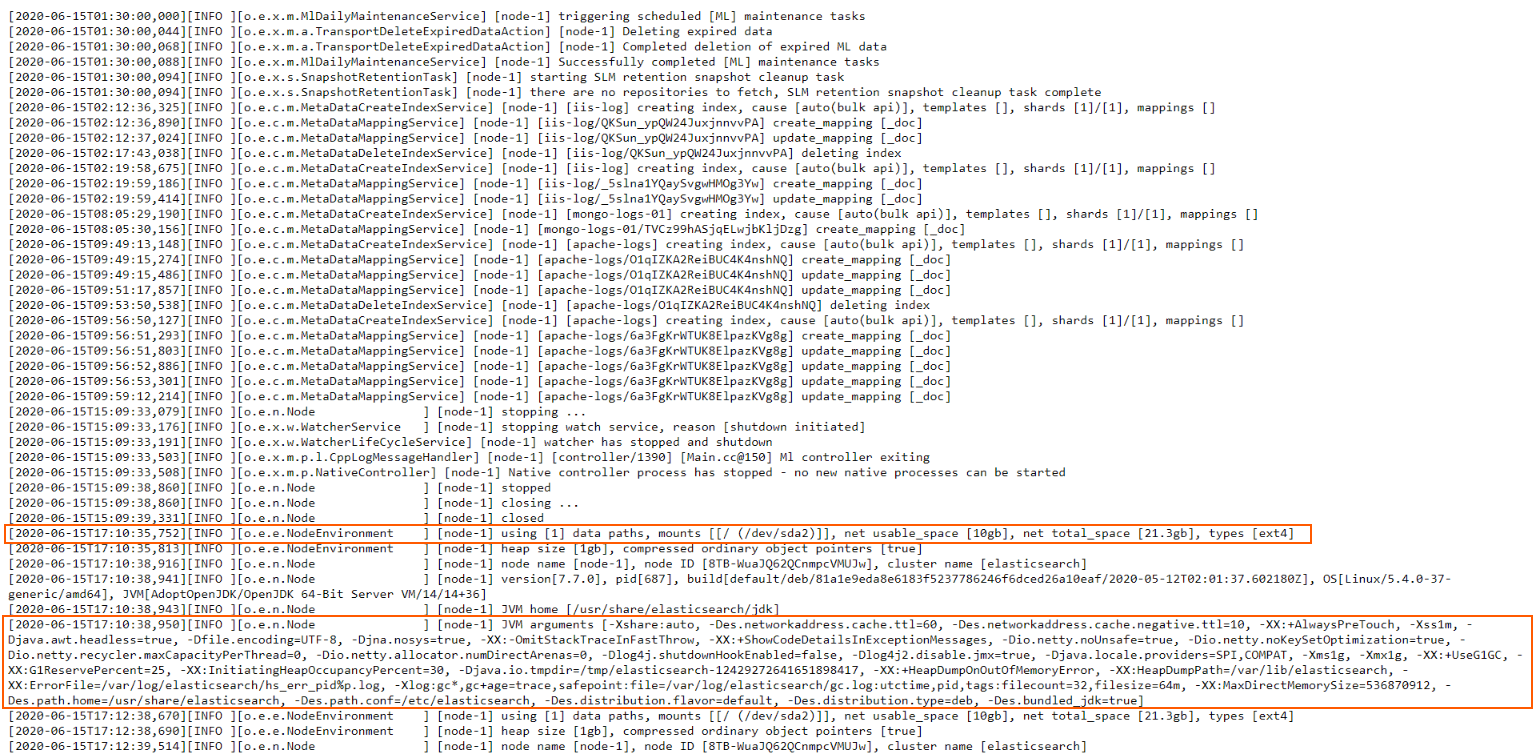
Now let’s explore how this log was parsed and what was inserted to the index:

curl -XGET "https://localhost:9200/apache-logs/_search?pretty" -H 'Content-Type: application/json' -d'{
  "size": 1,
  "track_total_hits": true,
  "query": {
  "bool": {
    "must_not": [
      {
        "term": {
          "tags.keyword": "_grokparsefailure"
        }
      }
    ]
  }
  }
}'

The output will be similar to the following:

      {
        "_index" : "apache-logs",
        "_type" : "_doc",
        "_id" : "4vgC2nIBB7MjzkVPhtPl",
        "_score" : 0.0,
        "_source" : {
          "verb" : "GET",
          "host" : "coralogix",
          "response" : "200",
          "agent" : {
            "name" : "Firefox",
            "build" : "",
            "device" : "Other",
            "os" : "Windows",
            "major" : "34",
            "minor" : "0",
            "os_name" : "Windows"
          },
          "clientip" : "178.150.5.107",
          "ident" : "-",
          "bytes" : "5226",
          "geoip" : {
            "continent_code" : "EU",
            "timezone" : "Europe/Kiev",
            "country_code3" : "UA",
            "country_name" : "Ukraine",
            "location" : {
              "lat" : 50.4547,
              "lon" : 30.5238
            },
            "region_name" : "Kyiv City",
            "city_name" : "Kyiv",
            "country_code2" : "UA",
            "ip" : "178.150.5.107",
            "postal_code" : "04128",
            "longitude" : 30.5238,
            "region_code" : "30",
            "latitude" : 50.4547
          },
          "referrer" : ""-"",
          "auth" : "-",
          "httpversion" : "1.1",
          "read_timestamp" : "2020-06-22T03:11:37.715Z",
          "path" : "/etc/logstash/conf.d/logstash/apache/access_log",
          "@timestamp" : "2017-04-30T19:16:43.000Z",
          "request" : "/wp-login.php",
          "@version" : "1"
        }
      }

Looking good. We can see the newly added geoip and agent fields are very detailed and very easy to read.

Elasticsearch Logs

We explored many log types, but let’s not forget, Elasticsearch generates logs too which helps us troubleshooting issues, like for example, figuring out why a node hasn’t started. Let’s look at a sample: https://raw.githubusercontent.com/coralogix-resources/logstash/master/elasticsearch_logs/elasticsearch.log.

Original link here

Now, this is slightly different from what we’ve worked with up until now. In all the other logs, each line represented one specific log entry (or message). That meant we could process them line by line and reasonably expect that each logged event is contained within a single line, in its entirety. 

Here, however, we sometimes encounter multi-line log entries. This means that a logged event can span across multiple lines, not just one. Fortunately, though, Elasticsearch clearly signals where a logged event begins and where it ends. It does so by using opening [ and closing ] square brackets. If you see that a line opens a square bracket [ but doesn’t close it on the same line, you know that’s a multi-line log entry and it ends on the line that finally uses the closing square bracket ].

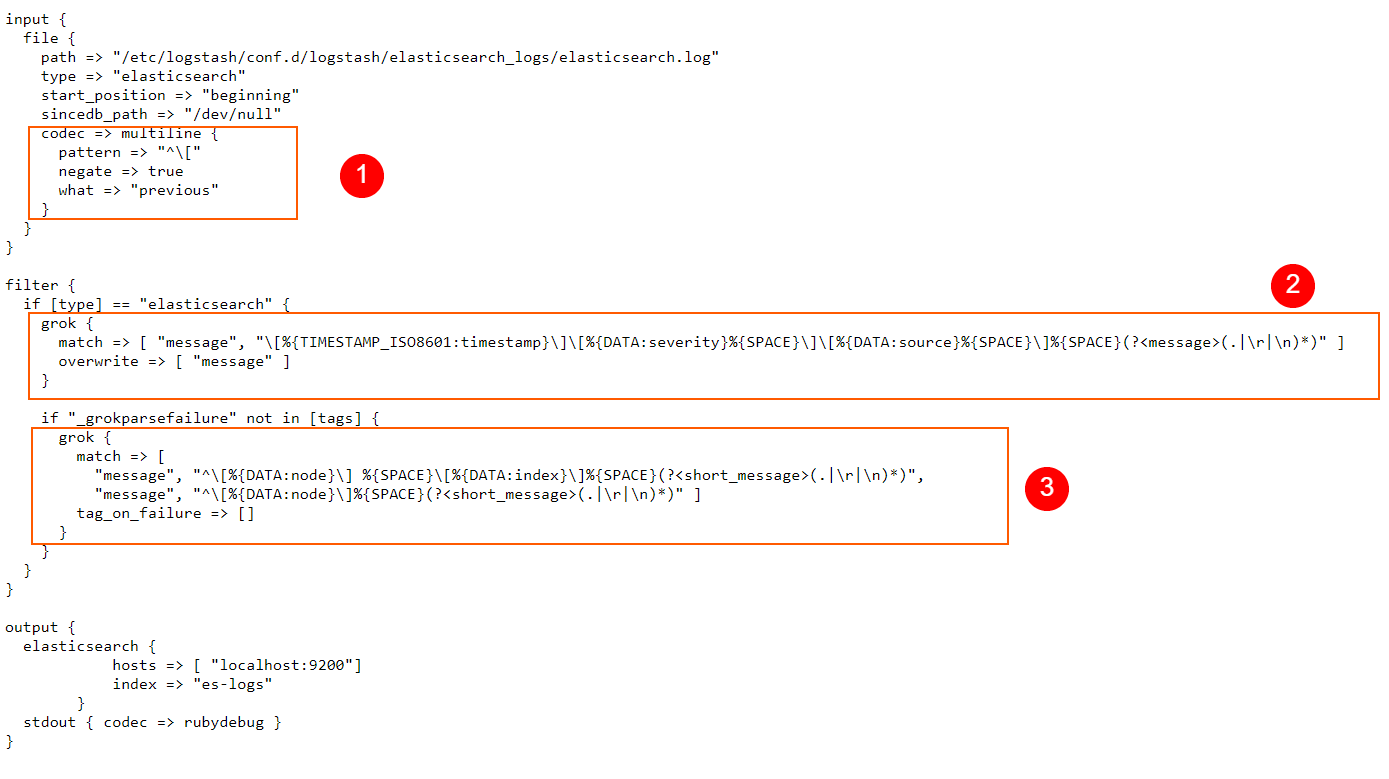
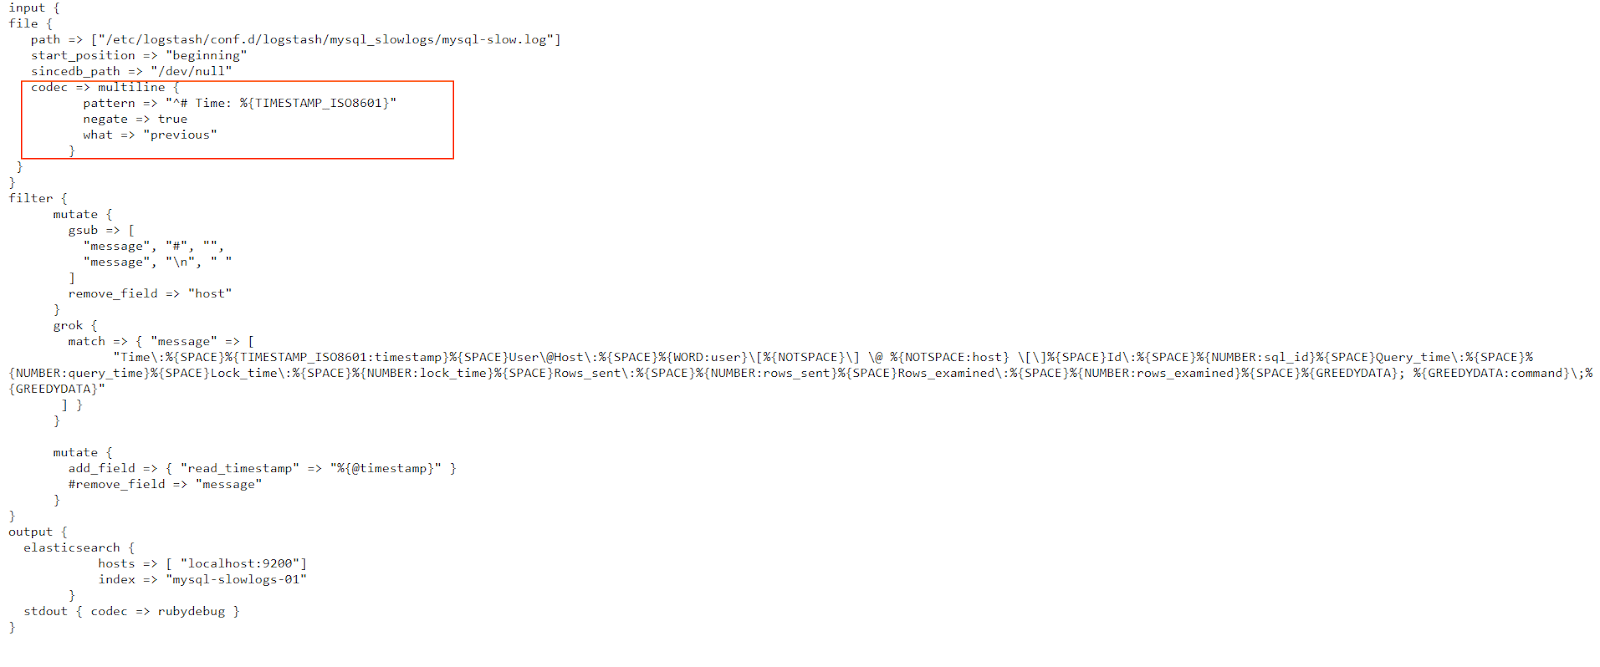
Logstash can easily process these logs by using the multiline input codec.

Let’s take a look at the Logstash config we’ll use here: https://raw.githubusercontent.com/coralogix-resources/logstash/master/elasticsearch_logs/es-logs-final.conf.

Original link here

In the codec => multiline section of our config, we define the pattern that instructs Logstash on how to identify multiline log entries. Here, we use a RegEx pattern, but of course, we can also use Grok patterns when we need to.

With negate set to true, a message that matches the pattern is not considered a match for the multiline filter. By default, this is set to false and when it is false, a message that matches the pattern is considered a match for multiline.

what” can be assigned a value of “previous” or “next“. For example, if we have a match, negate is set to false, and what has a value set to previous, this means that the current matched line belongs to the same event as the previous line.

In a nutshell, what we are doing for our scenario here is telling Logstash that if a line does not start with an opening square bracket [ then the line in the log file is a continuation of the previous line, so these will be grouped in a single event. Logstash will apply a “multiline” tag to such entries, which can be useful for debugging, or other similar purposes if we ever need to know which entry was contained in a single line, and which on multiple lines.

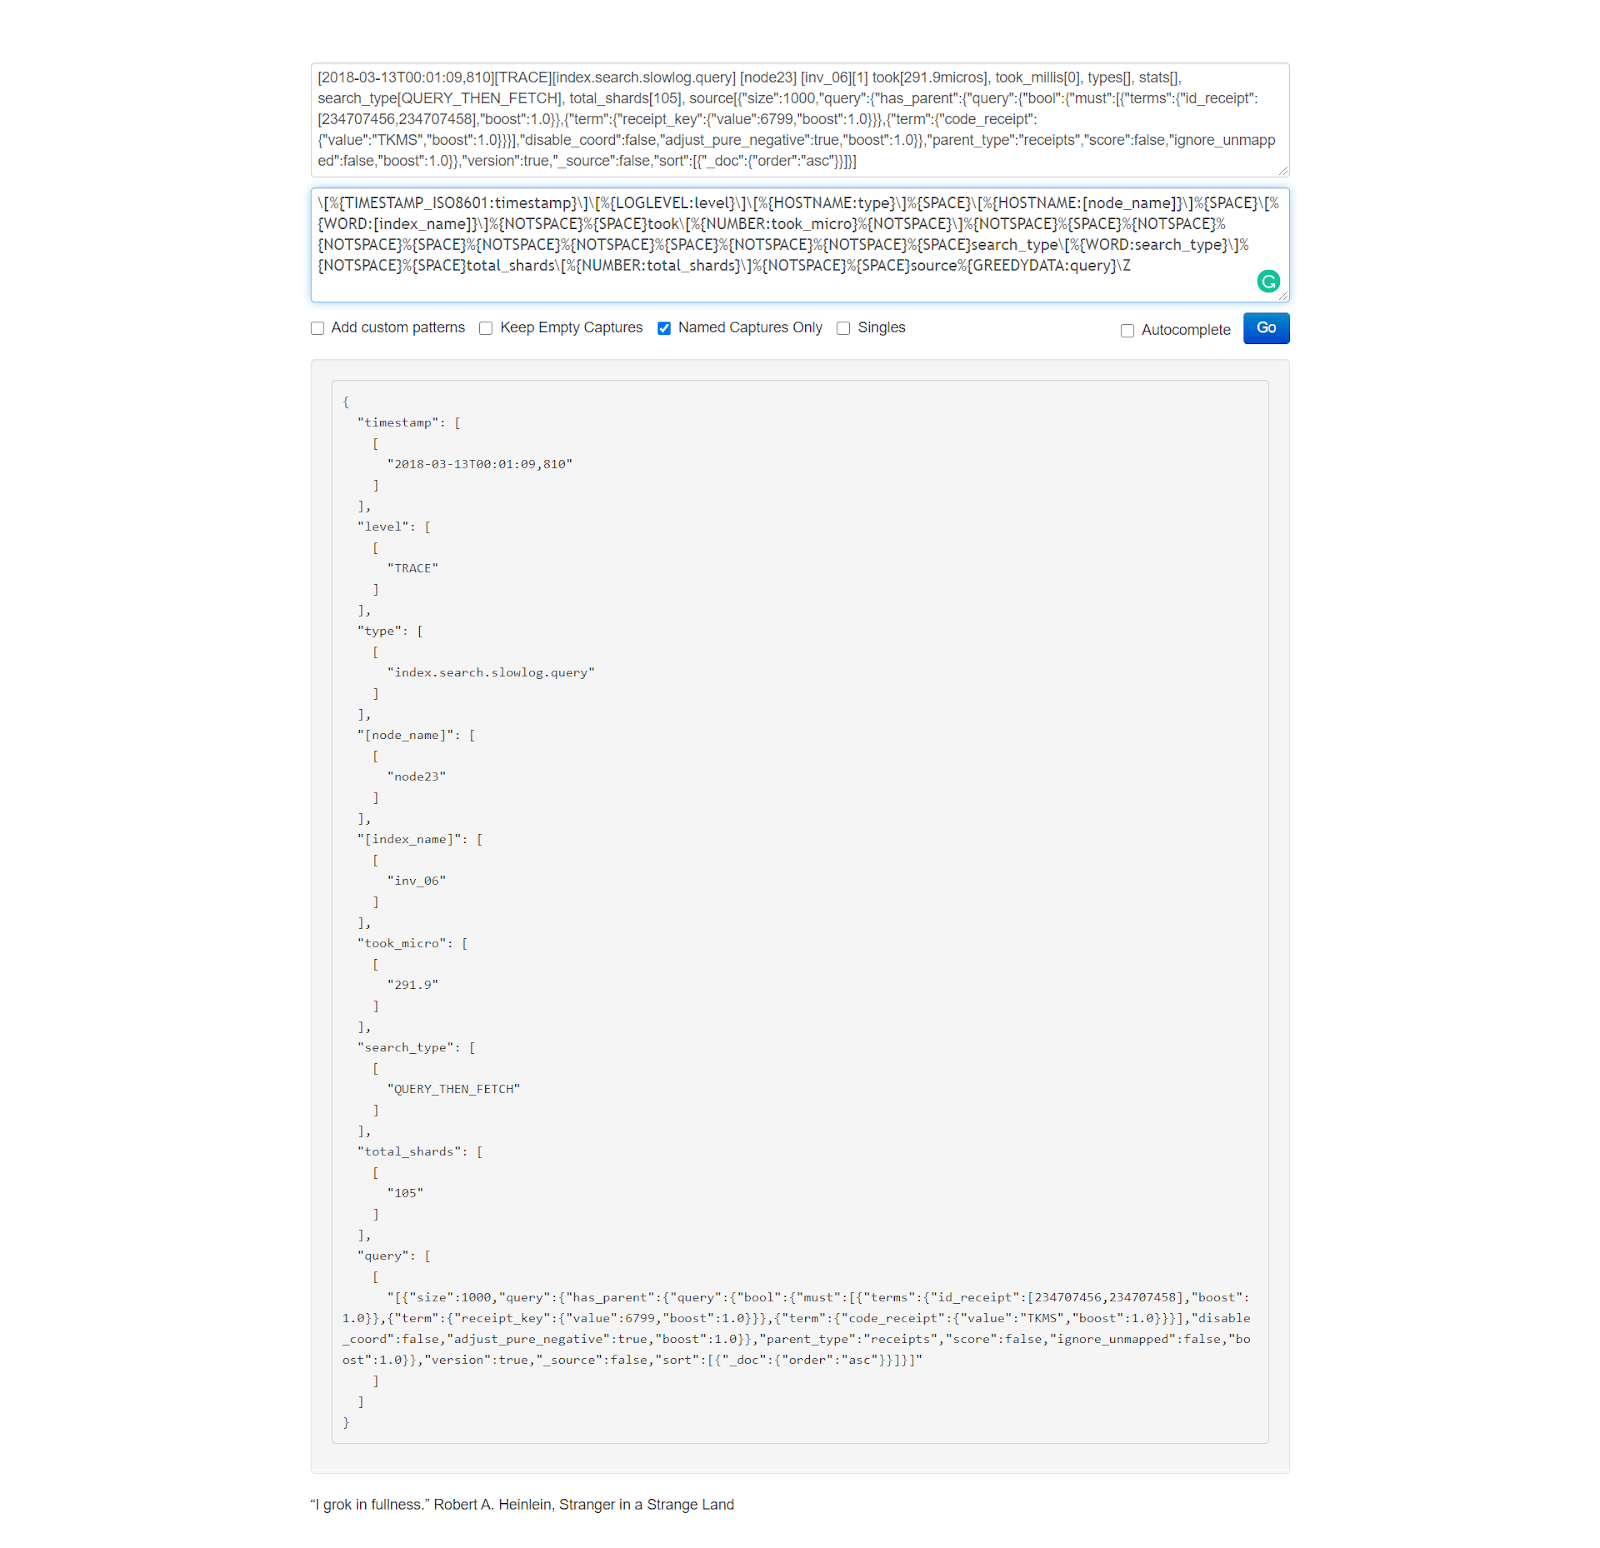
In the filter section we use a typical Grok pattern, just like we did many times before, and replace the message field with the parsed content.

Finally, a second Grok pattern will process the content in the message field even further, extracting things like the logged node name, index name, and so on.

Let’s run Logstash and see all of this in action:

sudo /usr/share/logstash/bin/logstash -f /etc/logstash/conf.d/logstash/elasticsearch_logs/es-logs-final.conf

After the program does its job, we press CTRL+C to exit.

Logstash has now parsed both single-line events and multiline events. We will now see how useful it can be that multiline events have been tagged appropriately. Because of this tag, we can now search entries that contain only single-line events. We do this by specifying in our cURL request that the matches must_not contain the tags called multiline.

curl -XGET "https://localhost:9200/es-test-logs/_search?pretty" -H 'Content-Type: application/json' -d'{
  "size": 1, 
  "query": {
    "bool": {
      "must_not": [
        {
          "match": {
            "tags": "multiline"
          }
        }
      ]
    }
  }
}'

The output will look something like this:

      {
        "_index" : "es-test-logs",
        "_type" : "_doc",
        "_id" : "9voa2nIBB7MjzkVP7ULy",
        "_score" : 0.0,
        "_source" : {
          "node" : "node-1",
          "source" : "o.e.x.m.MlDailyMaintenanceService",
          "host" : "coralogix",
          "@timestamp" : "2020-06-22T03:38:16.842Z",
          "@version" : "1",
          "message" : "[node-1] triggering scheduled [ML] maintenance tasks",
          "timestamp" : "2020-06-15T01:30:00,000",
          "short_message" : "triggering scheduled [ML] maintenance tasks",
          "type" : "elasticsearch",
          "severity" : "INFO",
          "path" : "/etc/logstash/conf.d/logstash/elasticsearch_logs/elasticsearch.log"
        }

Now let’s filter only the multiline entries:

curl -XGET "https://localhost:9200/es-test-logs/_search?pretty" -H 'Content-Type: application/json' -d'{
  "size": 1, 
  "query": {
    "bool": {
      "must": [
        {
          "match": {
            "tags": "multiline"
          }
        }
      ]
    }
  }
}'

Output should look similar to this:

      {
        "_index" : "es-test-logs",
        "_type" : "_doc",
        "_id" : "Kfoa2nIBB7MjzkVP7UPy",
        "_score" : 0.046520013,
        "_source" : {
          "node" : "node-1",
          "source" : "r.suppressed",
          "host" : "coralogix",
          "@timestamp" : "2020-06-22T03:38:16.968Z",
          "@version" : "1",
          "message" : "[node-1] path: /.kibana/_count, params: {index=.kibana}norg.elasticsearch.action.search.SearchPhaseExecutionException: all shards failedntat org.elasticsearch.action.search.AbstractSearchAsyncAction.onPhaseFailure(AbstractSearchAsyncAction.java:551) [elasticsearch-7.7.0.jar:7.7.0]ntat org.elasticsearch.action.search.AbstractSearchAsyncAction.executeNextPhase(AbstractSearchAsyncAction.java:309) [elasticsearch-7.7.0.jar:7.7.0]ntat org.elasticsearch.action.search.AbstractSearchAsyncAction.onPhaseDone(AbstractSearchAsyncAction.java:580) [elasticsearch-7.7.0.jar:7.7.0]ntat org.elasticsearch.action.search.AbstractSearchAsyncAction.onShardFailure(AbstractSearchAsyncAction.java:393) [elasticsearch-7.7.0.jar:7.7.0]ntat org.elasticsearch.action.search.AbstractSearchAsyncAction.lambda$performPhaseOnShard$0(AbstractSearchAsyncAction.java:223) [elasticsearch-7.7.0.jar:7.7.0]ntat org.elasticsearch.action.search.AbstractSearchAsyncAction$2.doRun(AbstractSearchAsyncAction.java:288) [elasticsearch-7.7.0.jar:7.7.0]ntat org.elasticsearch.common.util.concurrent.AbstractRunnable.run(AbstractRunnable.java:37) [elasticsearch-7.7.0.jar:7.7.0]ntat org.elasticsearch.common.util.concurrent.TimedRunnable.doRun(TimedRunnable.java:44) [elasticsearch-7.7.0.jar:7.7.0]ntat org.elasticsearch.common.util.concurrent.ThreadContext$ContextPreservingAbstractRunnable.doRun(ThreadContext.java:692) [elasticsearch-7.7.0.jar:7.7.0]ntat org.elasticsearch.common.util.concurrent.AbstractRunnable.run(AbstractRunnable.java:37) [elasticsearch-7.7.0.jar:7.7.0]ntat java.util.concurrent.ThreadPoolExecutor.runWorker(ThreadPoolExecutor.java:1130) [?:?]ntat java.util.concurrent.ThreadPoolExecutor$Worker.run(ThreadPoolExecutor.java:630) [?:?]ntat java.lang.Thread.run(Thread.java:832) [?:?]",
          "timestamp" : "2020-06-15T17:13:35,457",
          "short_message" : "path: /.kibana/_count, params: {index=.kibana}norg.elasticsearch.action.search.SearchPhaseExecutionException: all shards failedntat org.elasticsearch.action.search.AbstractSearchAsyncAction.onPhaseFailure(AbstractSearchAsyncAction.java:551) [elasticsearch-7.7.0.jar:7.7.0]ntat org.elasticsearch.action.search.AbstractSearchAsyncAction.executeNextPhase(AbstractSearchAsyncAction.java:309) [elasticsearch-7.7.0.jar:7.7.0]ntat org.elasticsearch.action.search.AbstractSearchAsyncAction.onPhaseDone(AbstractSearchAsyncAction.java:580) [elasticsearch-7.7.0.jar:7.7.0]ntat org.elasticsearch.action.search.AbstractSearchAsyncAction.onShardFailure(AbstractSearchAsyncAction.java:393) [elasticsearch-7.7.0.jar:7.7.0]ntat org.elasticsearch.action.search.AbstractSearchAsyncAction.lambda$performPhaseOnShard$0(AbstractSearchAsyncAction.java:223) [elasticsearch-7.7.0.jar:7.7.0]ntat org.elasticsearch.action.search.AbstractSearchAsyncAction$2.doRun(AbstractSearchAsyncAction.java:288) [elasticsearch-7.7.0.jar:7.7.0]ntat org.elasticsearch.common.util.concurrent.AbstractRunnable.run(AbstractRunnable.java:37) [elasticsearch-7.7.0.jar:7.7.0]ntat org.elasticsearch.common.util.concurrent.TimedRunnable.doRun(TimedRunnable.java:44) [elasticsearch-7.7.0.jar:7.7.0]ntat org.elasticsearch.common.util.concurrent.ThreadContext$ContextPreservingAbstractRunnable.doRun(ThreadContext.java:692) [elasticsearch-7.7.0.jar:7.7.0]ntat org.elasticsearch.common.util.concurrent.AbstractRunnable.run(AbstractRunnable.java:37) [elasticsearch-7.7.0.jar:7.7.0]ntat java.util.concurrent.ThreadPoolExecutor.runWorker(ThreadPoolExecutor.java:1130) [?:?]ntat java.util.concurrent.ThreadPoolExecutor$Worker.run(ThreadPoolExecutor.java:630) [?:?]ntat java.lang.Thread.run(Thread.java:832) [?:?]",
          "type" : "elasticsearch",
          "severity" : "WARN",
          "tags" : [
            "multiline"
          ],
          "path" : "/etc/logstash/conf.d/logstash/elasticsearch_logs/elasticsearch.log"
        }

Elasticsearch Slow Logs

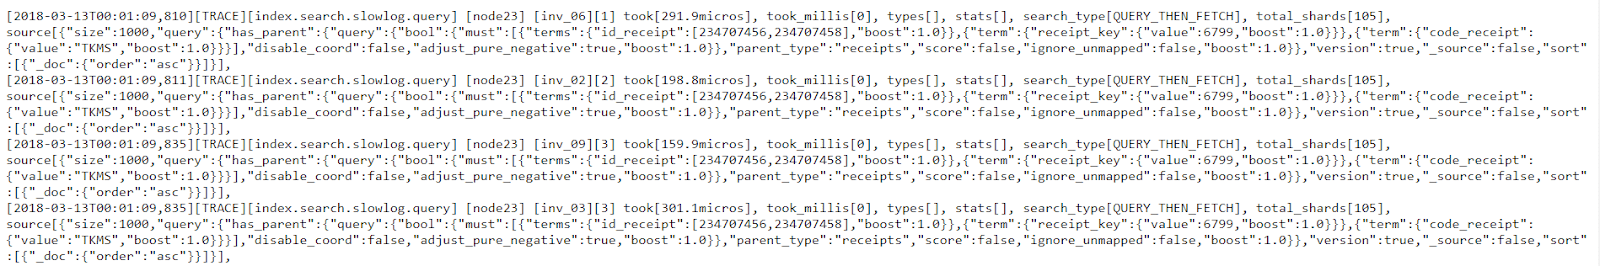
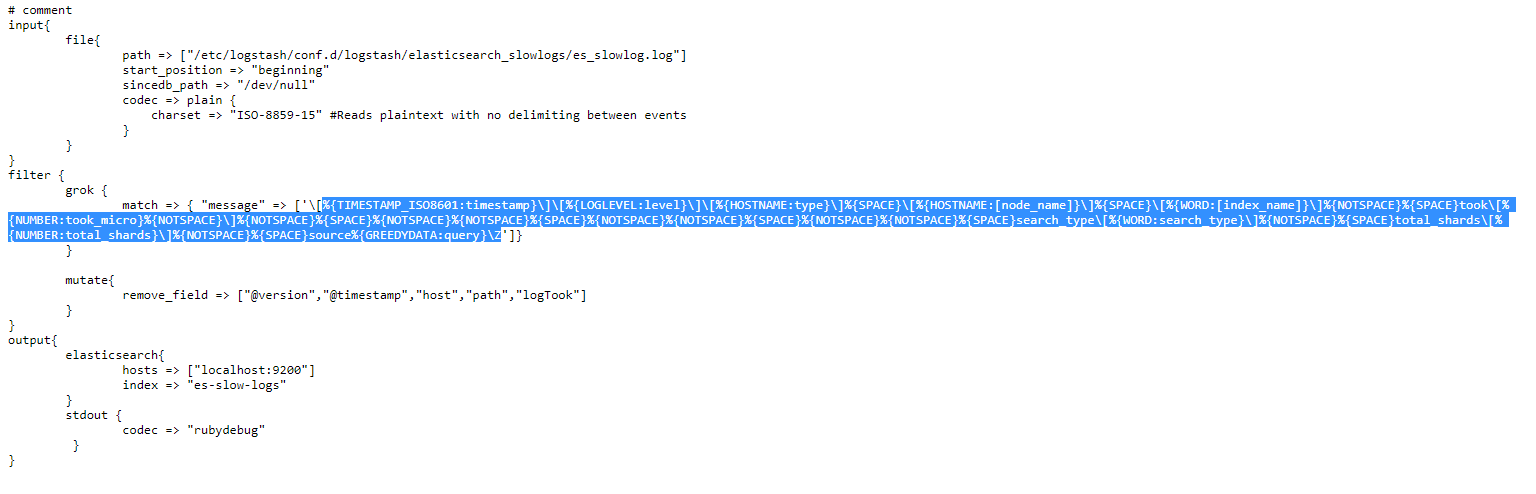
Elasticsearch can also generate another type of logs, called slow logs and are used to optimize Elasticsearch search and indexing operations. These are easier to process since they don’t contain multiline messages.

Let’s take a look at a slow log: https://raw.githubusercontent.com/coralogix-resources/logstash/master/elasticsearch_slowlogs/es_slowlog.log.

Original image link 

As we did in previous sections, let’s copy the first line and paste it into the first (input) field of the https://grokdebug.herokuapp.com/ website.

[2018-03-13T00:01:09,810][TRACE][index.search.slowlog.query] [node23] [inv_06][1] took[291.9micros], took_millis[0], types[], stats[], search_type[QUERY_THEN_FETCH], total_shards[105], source[{"size":1000,"query":{"has_parent":{"query":{"bool":{"must":[{"terms":{"id_receipt":[234707456,234707458],"boost":1.0}},{"term":{"receipt_key":{"value":6799,"boost":1.0}}},{"term":{"code_receipt":{"value":"TKMS","boost":1.0}}}],"disable_coord":false,"adjust_pure_negative":true,"boost":1.0}},"parent_type":"receipts","score":false,"ignore_unmapped":false,"boost":1.0}},"version":true,"_source":false,"sort":[{"_doc":{"order":"asc"}}]}],

Original image link

Now let’s take a look at the Logstash config we’ll use: https://raw.githubusercontent.com/coralogix-resources/logstash/master/elasticsearch_slowlogs/es-slowlog-final.conf.

Original image link

Let’s copy the Grok pattern within this config and paste it to the second (pattern) field of the https://grokdebug.herokuapp.com/ website.

%{TIMESTAMP_ISO8601:timestamp}][%{LOGLEVEL:level}][%{HOSTNAME:type}]%{SPACE}[%{HOSTNAME:[node_name]}]%{SPACE}[%{WORD:[index_name]}]%{NOTSPACE}%{SPACE}took[%{NUMBER:took_micro}%{NOTSPACE}]%{NOTSPACE}%{SPACE}%{NOTSPACE}%{NOTSPACE}%{SPACE}%{NOTSPACE}%{NOTSPACE}%{SPACE}%{NOTSPACE}%{NOTSPACE}%{SPACE}search_type[%{WORD:search_type}]%{NOTSPACE}%{SPACE}total_shards[%{NUMBER:total_shards}]%{NOTSPACE}%{SPACE}source%{GREEDYDATA:query}Z

Original image link 

Now that we saw how this Grok pattern works, let’s run Logstash with our new config file.

sudo /usr/share/logstash/bin/logstash -f /etc/logstash/conf.d/logstash/elasticsearch_slowlogs/es-slowlog-final.conf

As usual, once the parsing is done, we press CTRL+C to exit the application.

Let’s see how the log file was parsed and added to the index:

curl -XGET "https://localhost:9200/es-slow-logs/_search?pretty" -H 'Content-Type: application/json' -d'{  "size": 1}'

The output will look something like this:

      {
        "_index" : "es-slow-logs",
        "_type" : "_doc",
        "_id" : "e-JzvHIBocjiYgvgqO4l",
        "_score" : 1.0,
        "_source" : {
          "total_shards" : "105",
          "message" : """[2018-03-13T00:01:09,810][TRACE][index.search.slowlog.query] [node23] [inv_06][1] took[291.9micros], took_millis[0], types[], stats[], search_type[QUERY_THEN_FETCH], total_shards[105], source[{"size":1000,"query":{"has_parent":{"query":{"bool":{"must":[{"terms":{"id_receipt":[234707456,234707458],"boost":1.0}},{"term":{"receipt_key":{"value":6799,"boost":1.0}}},{"term":{"code_receipt":{"value":"TKMS","boost":1.0}}}],"disable_coord":false,"adjust_pure_negative":true,"boost":1.0}},"parent_type":"receipts","score":false,"ignore_unmapped":false,"boost":1.0}},"version":true,"_source":false,"sort":[{"_doc":{"order":"asc"}}]}], """,
          "node_name" : "node23",
          "index_name" : "inv_06",
          "level" : "TRACE",
          "type" : "index.search.slowlog.query",
          "took_micro" : "291.9",
          "timestamp" : "2018-03-13T00:01:09,810",
          "query" : """[{"size":1000,"query":{"has_parent":{"query":{"bool":{"must":[{"terms":{"id_receipt":[234707456,234707458],"boost":1.0}},{"term":{"receipt_key":{"value":6799,"boost":1.0}}},{"term":{"code_receipt":{"value":"TKMS","boost":1.0}}}],"disable_coord":false,"adjust_pure_negative":true,"boost":1.0}},"parent_type":"receipts","score":false,"ignore_unmapped":false,"boost":1.0}},"version":true,"_source":false,"sort":[{"_doc":{"order":"asc"}}]}], """,
          "search_type" : "QUERY_THEN_FETCH"
        }
      }

MySQL Slow Logs

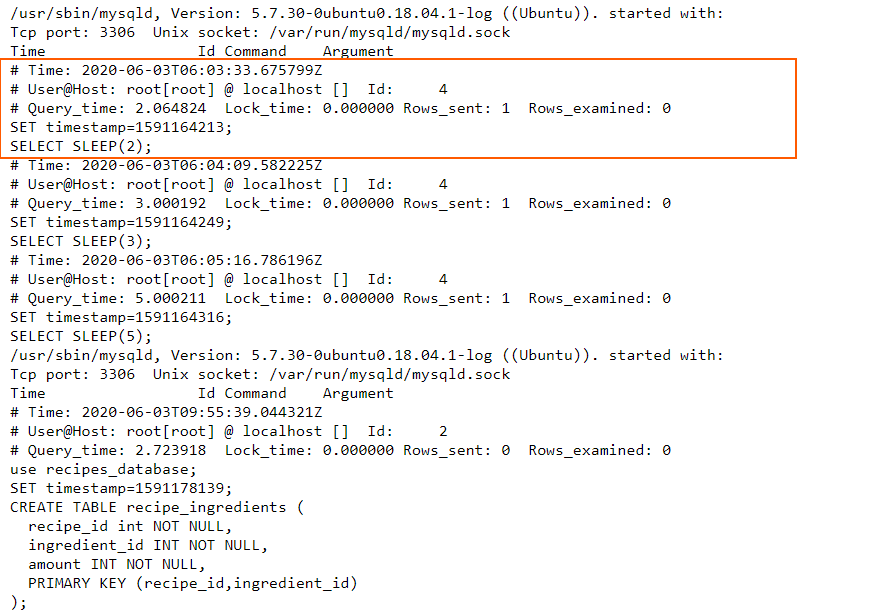
MySQL can also generate slow logs to help with optimization efforts. However, these will log events on multiple lines so we’ll need to use the multiline codec again.

Let’s look at a log file: https://raw.githubusercontent.com/coralogix-resources/logstash/master/mysql_slowlogs/mysql-slow.log.

Original image link here

Now let’s look at the Logstash config file: https://raw.githubusercontent.com/coralogix-resources/logstash/master/mysql_slowlogs/mysql-slowlogs.conf.

Original image link

In the multiline codec configuration, we use a Grok pattern. Simply put, we instruct Logstash that if the line doesn’t begin with the “# Time:” string, followed by a timestamp in the TIMESTAMP_ISO8601 format, then this line should be grouped together with previous lines in this event. This makes sense, since all logged events in this slow log begin with that specific timestamp, and then describe what has happened at that time, in the next few lines. Consequently, whenever a new timestamp appears, it signals the end of the current logged event and the beginning of the next.

Let’s run Logstash with this config:

sudo /usr/share/logstash/bin/logstash -f /etc/logstash/conf.d/logstash/mysql_slowlogs/mysql-slowlogs.conf

As always, after the parsing is done, we press CTRL+C to exit the utility.

Let’s look at how the slow log was parsed:

curl -XGET "https://localhost:9200/mysql-slowlogs-01/_search?pretty" -H 'Content-Type: application/json' -d'{

  "size":1,
  "query": {
    "bool": {
    "must_not": [
      {
        "term": {
          "tags.keyword": "_grokparsefailure"
        }
      }
    ]
  }
  }

}'

The output should look like this:

      {
        "_index" : "mysql-slowlogs-01",
        "_type" : "_doc",
        "_id" : "Zfo42nIBB7MjzkVPGUfK",
        "_score" : 0.0,
        "_source" : {
          "tags" : [
            "multiline"
          ],
          "host" : "localhost",
          "user" : "root",
          "lock_time" : "0.000000",
          "timestamp" : "2020-06-03T06:04:09.582225Z",
          "read_timestamp" : "2020-06-22T04:10:08.892Z",
          "message" : " Time: 2020-06-03T06:04:09.582225Z  User@Host: root[root] @ localhost []  Id:     4  Query_time: 3.000192  Lock_time: 0.000000 Rows_sent: 1  Rows_examined: 0 SET timestamp=1591164249; SELECT SLEEP(3);",
          "query_time" : "3.000192",
          "rows_examined" : "0",
          "path" : "/etc/logstash/conf.d/logstash/mysql_slowlogs/mysql-slow.log",
          "sql_id" : "4",
          "@version" : "1",
          "rows_sent" : "1",
          "@timestamp" : "2020-06-22T04:10:08.892Z",
          "command" : "SELECT SLEEP(3)"
        }
      }

AWS ELB

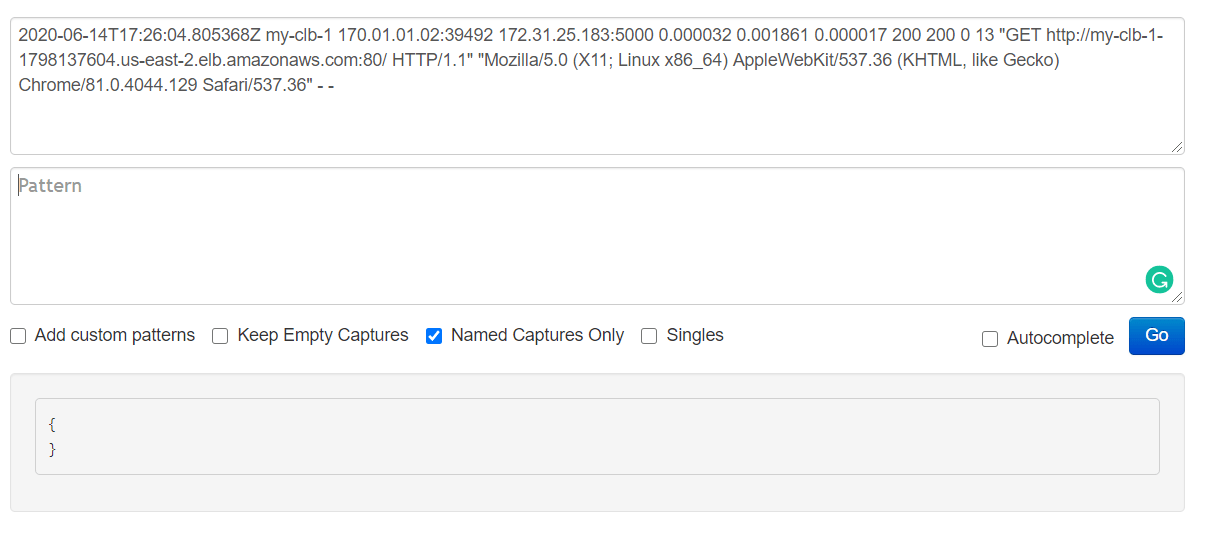
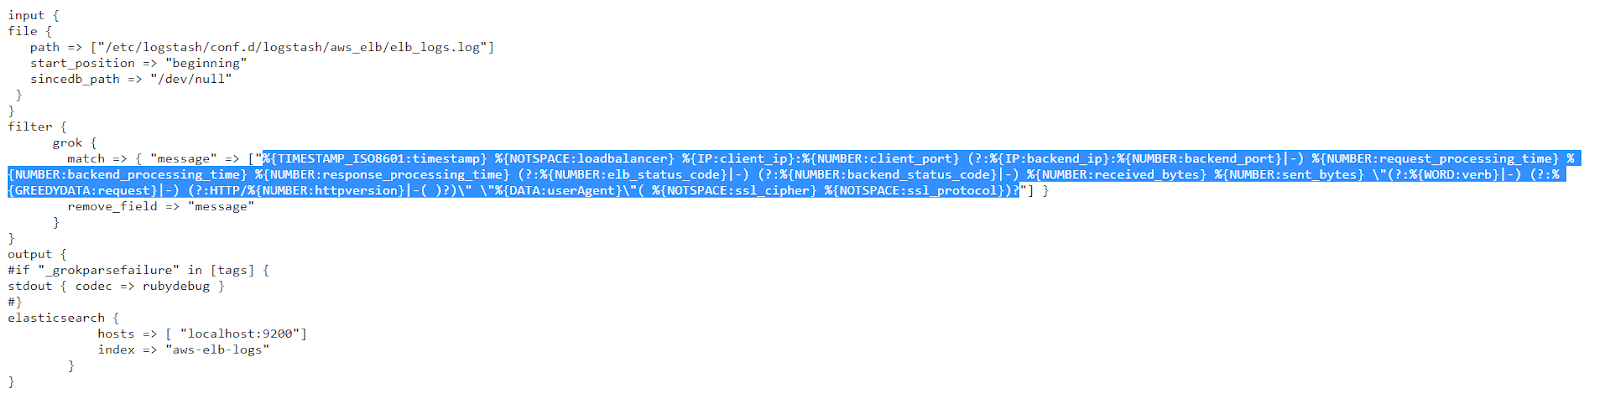
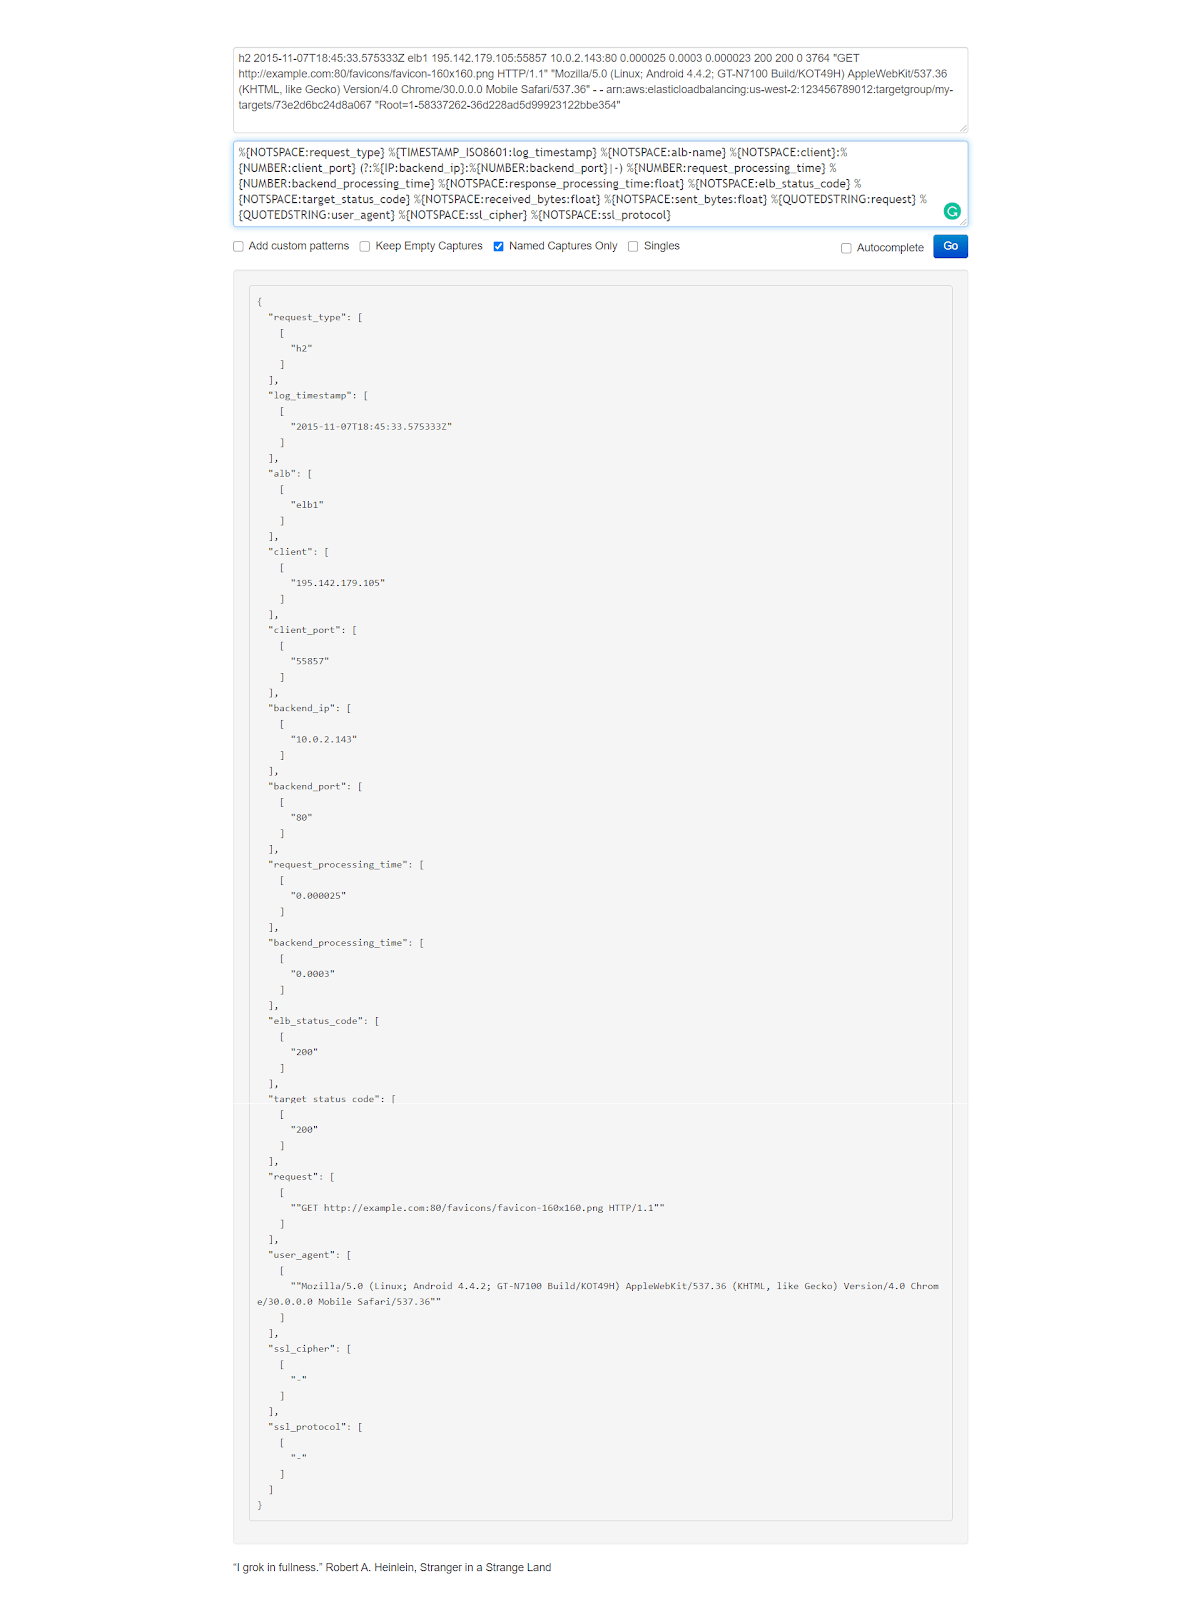
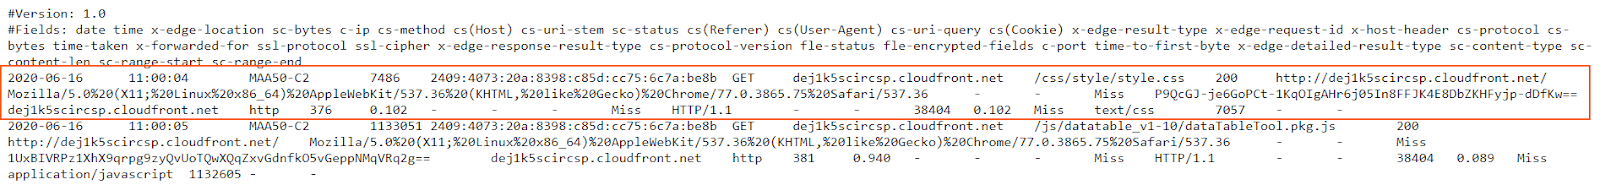
AWS Elastic Load Balancer is a popular service that intelligently distributes traffic across a number of instances. ELB provides access logs that capture detailed information about requests sent to your load balancer. Each ELB log contains information such as the time the request was received, the client’s IP address, latencies, request paths, and server responses.

Let’s look at an example of such a log: https://raw.githubusercontent.com/coralogix-resources/logstash/master/aws_elb/elb_logs.log

Original image link here

Once again, let’s copy the first line of this log and paste it into the first (input) field of the https://grokdebug.herokuapp.com/ website.

2020-06-14T17:26:04.805368Z my-clb-1 170.01.01.02:39492 172.31.25.183:5000 0.000032 0.001861 0.000017 200 200 0 13 "GET https://my-clb-1-1798137604.us-east-2.elb.amazonaws.com:80/ HTTP/1.1" "Mozilla/5.0 (X11; Linux x86_64) AppleWebKit/537.36 (KHTML, like Gecko) Chrome/81.0.4044.129 Safari/537.36" - -

Original image link here

The Logstash config we’ll use is this one: https://raw.githubusercontent.com/coralogix-resources/logstash/master/aws_elb/aws-elb.conf.

Original image link here 

From this config, we can copy the Grok pattern and paste it into the second (pattern) field of the https://grokdebug.herokuapp.com/ website.

%{TIMESTAMP_ISO8601:timestamp} %{NOTSPACE:loadbalancer} %{IP:client_ip}:%{NUMBER:client_port} (?:%{IP:backend_ip}:%{NUMBER:backend_port}|-) %{NUMBER:request_processing_time} %{NUMBER:backend_processing_time} %{NUMBER:response_processing_time} (?:%{NUMBER:elb_status_code}|-) (?:%{NUMBER:backend_status_code}|-) %{NUMBER:received_bytes} %{NUMBER:sent_bytes} "(?:%{WORD:verb}|-) (?:%{GREEDYDATA:request}|-) (?:HTTP/%{NUMBER:httpversion}|-( )?)" "%{DATA:userAgent}"( %{NOTSPACE:ssl_cipher} %{NOTSPACE:ssl_protocol})?

Original image link here

Let’s run Logstash:

sudo /usr/share/logstash/bin/logstash -f /etc/logstash/conf.d/logstash/aws_elb/aws-elb.conf

We press CTRL+C once it finishes its job and then take a look at the index to see how the log has been parsed:

curl -XGET "https://localhost:9200/aws-elb-logs/_search?pretty" -H 'Content-Type: application/json' -d'
{
  "size": 1,
  "query": {
    "bool": {
      "must_not": [
        {
        "term": {
          "tags": {
            "value": "_grokparsefailure"
          }
        }
      }
      ]
    }
  }
}'

The output should look similar to this:

      {
        "_index" : "aws-elb-logs",
        "_type" : "_doc",
        "_id" : "avpQ2nIBB7MjzkVPIEc-",
        "_score" : 0.0,
        "_source" : {
          "request_processing_time" : "0.000032",
          "timestamp" : "2020-06-14T17:26:05.145274Z",
          "sent_bytes" : "232",
          "@version" : "1",
          "userAgent" : "Mozilla/5.0 (X11; Linux x86_64) AppleWebKit/537.36 (KHTML, like Gecko) Chrome/81.0.4044.129 Safari/537.36",
          "elb_status_code" : "404",
          "ssl_protocol" : "-",
          "path" : "/etc/logstash/conf.d/logstash/aws_elb/elb_logs.log",
          "response_processing_time" : "0.000016",
          "backend_processing_time" : "0.002003",
          "client_port" : "39492",
          "verb" : "GET",
          "received_bytes" : "0",
          "backend_ip" : "172.31.25.183",
          "backend_status_code" : "404",
          "client_ip" : "170.01.01.02",
          "backend_port" : "5000",
          "host" : "coralogix",
          "loadbalancer" : "my-clb-1",
          "request" : "https://my-clb-1-1798137604.us-east-2.elb.amazonaws.com:80/favicon.ico",
          "ssl_cipher" : "-",
          "httpversion" : "1.1",
          "@timestamp" : "2020-06-22T04:36:23.160Z"
        }
      }

AWS ALB

Amazon also offers an Application Load Balancer that generates its own logs. These are very similar to the ELB logs and we can see an example here: https://raw.githubusercontent.com/coralogix-resources/logstash/master/aws_alb/alb_logs.log.

Original image link here

The config file we will use can be seen here: https://raw.githubusercontent.com/coralogix-resources/logstash/master/aws_alb/aws-alb.conf.

Original image link here

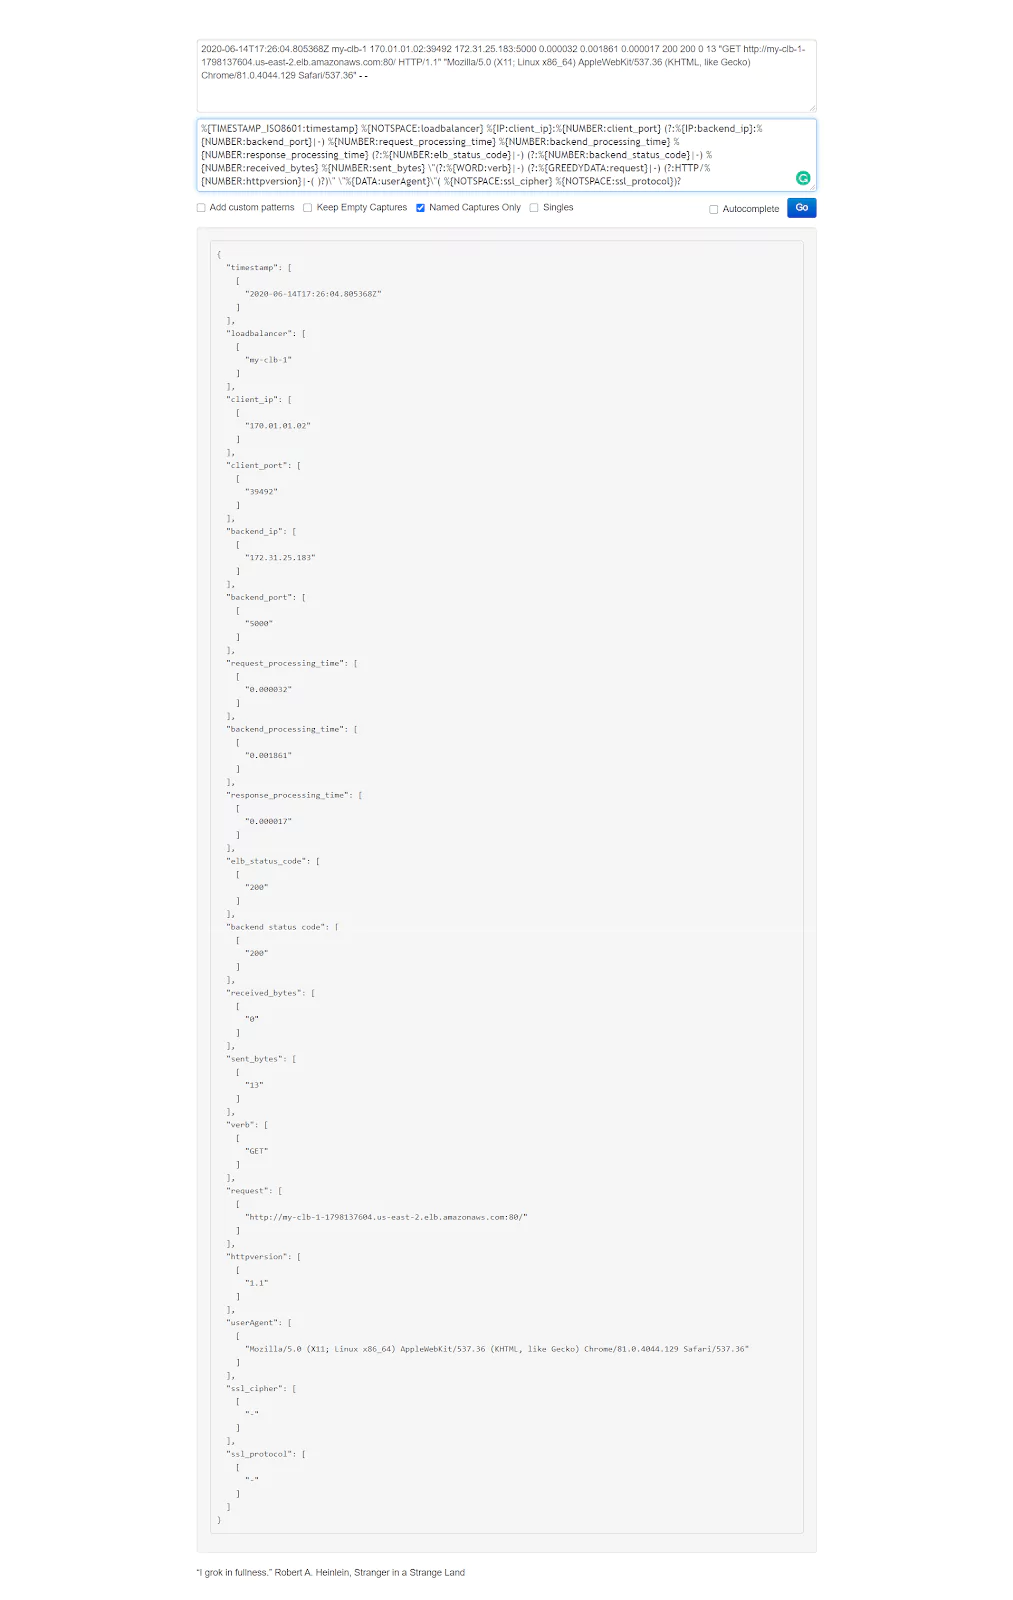
If you want to test things out in the https://grokdebug.herokuapp.com/ website, the input line you can copy and paste into the first field is the following:

h2 2015-11-07T18:45:33.575333Z elb1 195.142.179.105:55857 10.0.2.143:80 0.000025 0.0003 0.000023 200 200 0 3764 "GET https://example.com:80/favicons/favicon-160x160.png HTTP/1.1" "Mozilla/5.0 (Linux; Android 4.4.2; GT-N7100 Build/KOT49H) AppleWebKit/537.36 (KHTML, like Gecko) Version/4.0 Chrome/30.0.0.0 Mobile Safari/537.36" - - arn:aws:elasticloadbalancing:us-west-2:123456789012:targetgroup/my-targets/73e2d6bc24d8a067 "Root=1-58337262-36d228ad5d99923122bbe354"

And the Grok pattern is:

%{NOTSPACE:request_type} %{TIMESTAMP_ISO8601:log_timestamp} %{NOTSPACE:alb-name} %{NOTSPACE:client}:%{NUMBER:client_port} (?:%{IP:backend_ip}:%{NUMBER:backend_port}|-) %{NUMBER:request_processing_time} %{NUMBER:backend_processing_time} %{NOTSPACE:response_processing_time:float} %{NOTSPACE:elb_status_code} %{NOTSPACE:target_status_code} %{NOTSPACE:received_bytes:float} %{NOTSPACE:sent_bytes:float} %{QUOTEDSTRING:request} %{QUOTEDSTRING:user_agent} %{NOTSPACE:ssl_cipher} %{NOTSPACE:ssl_protocol} %{NOTSPACE:target_group_arn} %{QUOTEDSTRING:trace_id}

Original image link here

Once again, let’s run Logstash with the new config:

sudo /usr/share/logstash/bin/logstash -f /etc/logstash/conf.d/logstash/aws_alb/aws-alb.conf

We’ll press CTRL+C, once it’s done, and then take a look at how the log has been parsed and imported to the index:

curl -XGET "https://localhost:9200/aws-alb-logs/_search?pretty" -H 'Content-Type: application/json' -d'
{
  "size": 1,
  "query": {
    "bool": {
      "must_not": [
        {"term": {
          "tags": {
            "value": "_grokparsefailure"
          }
        }
      }
      ]
    }
  }
}'

The output should look something like this:

      {
        "_index" : "aws-alb-logs",
        "_type" : "_doc",
        "_id" : "dvpZ2nIBB7MjzkVPF0ex",
        "_score" : 0.0,
        "_source" : {
          "client" : "78.164.152.56",
          "path" : "/etc/logstash/conf.d/logstash/aws_alb/alb_logs.log",
          "client_port" : "60693",
          "ssl_protocol" : "-",
          "target_group_arn" : "arn:aws:elasticloadbalancing:us-west-2:123456789012:targetgroup/my-targets/73e2d6bc24d8a067",
          "backend_port" : "80",
          "trace_id" : ""Root=1-58337262-36d228ad5d99923122bbe354"",
          "backend_processing_time" : "0.001005",
          "response_processing_time" : 2.6E-5,
          "@timestamp" : "2020-06-22T04:46:09.813Z",
          "@version" : "1",
          "request_processing_time" : "0.000026",
          "received_bytes" : 0.0,
          "sent_bytes" : 33735.0,
          "alb-name" : "elb1",
          "log_timestamp" : "2015-11-07T18:45:33.578479Z",
          "request_type" : "h2",
          "user_agent" : ""Mozilla/5.0 (Windows NT 6.1; WOW64) AppleWebKit/537.36 (KHTML, like Gecko) Chrome/46.0.2490.80 Safari/537.36"",
          "request" : ""GET https://example.com:80/images/logo/devices.png HTTP/1.1"",
          "elb_status_code" : "200",
          "ssl_cipher" : "-",
          "host" : "coralogix",
          "backend_ip" : "10.0.0.215",
          "target_status_code" : "200"
        }
      }

AWS CloudFront

Amazon’s CloudFront content delivery network generates useful logs to help ensure availability, performance, and in security audits. 

Here is a sample log: https://raw.githubusercontent.com/coralogix-resources/logstash/master/aws_cloudfront/cloudfront_logs.log.

Original image link here

The Logstash config file can be viewed here: https://raw.githubusercontent.com/coralogix-resources/logstash/master/aws_cloudfront/aws-cloudfront.conf.

Original image link

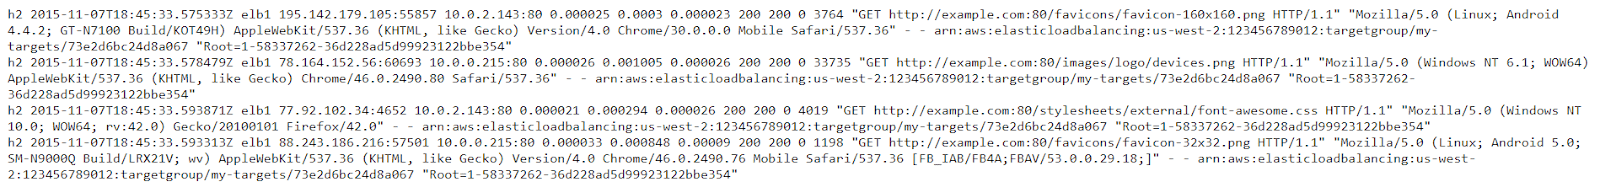
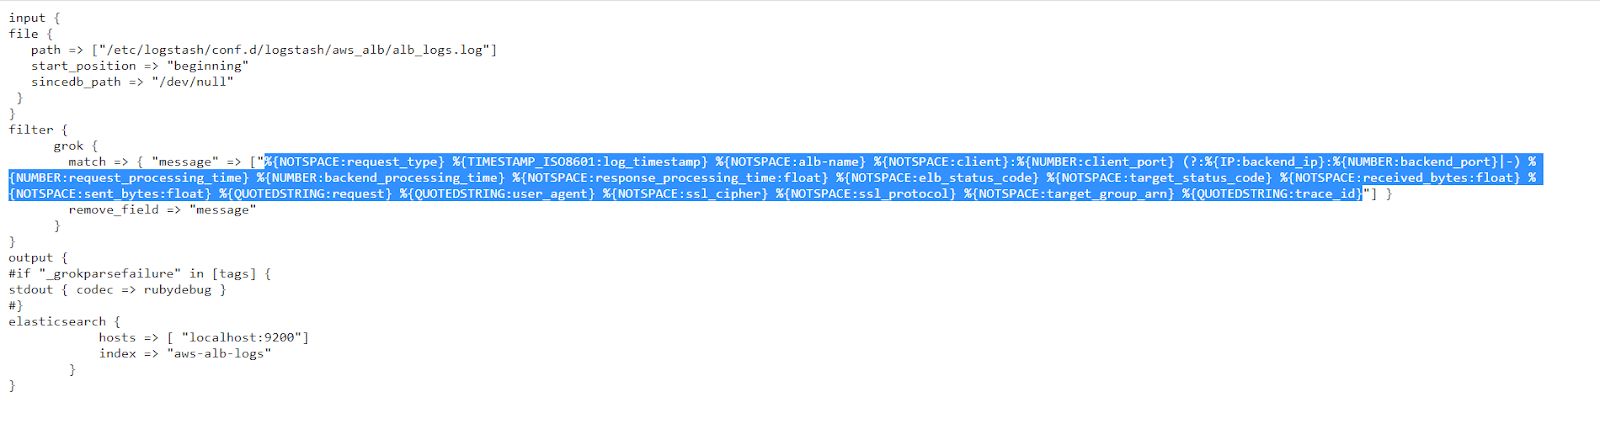
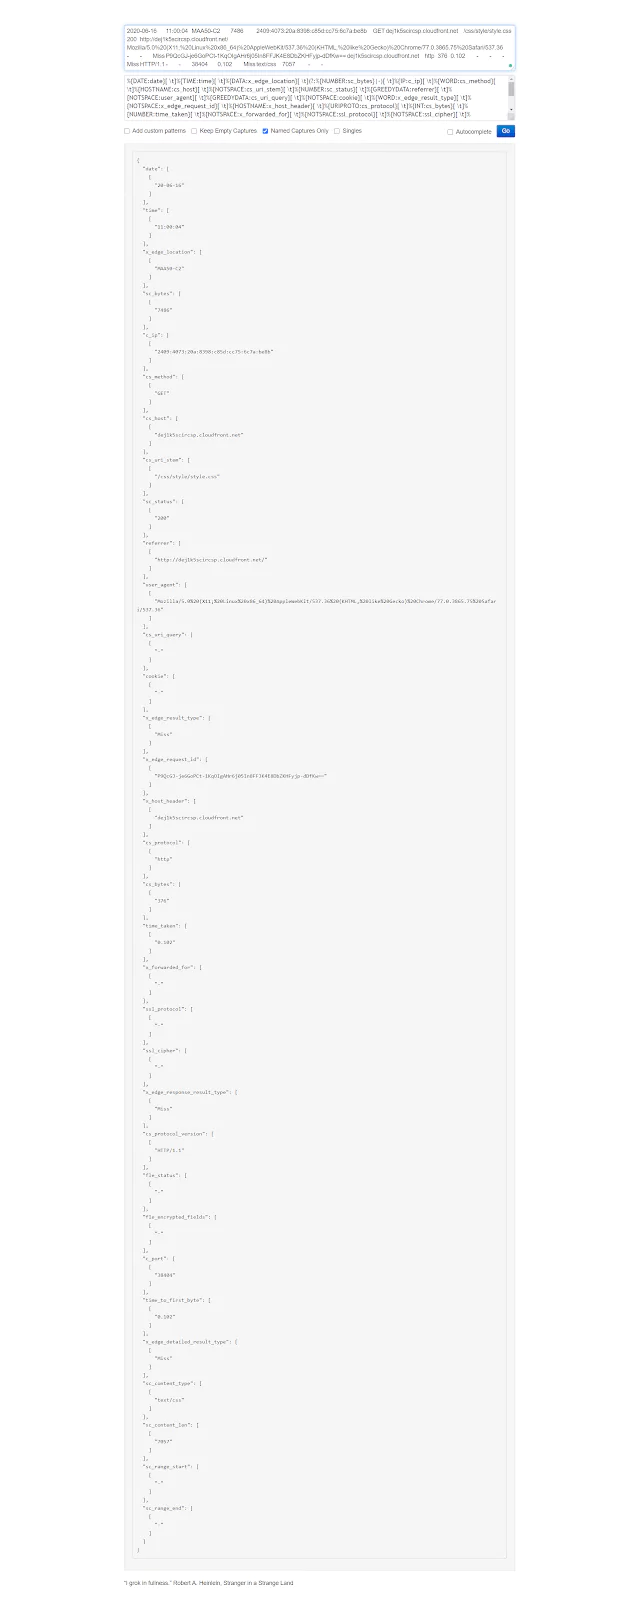
Once again, If you want to test how things work, in the https://grokdebug.herokuapp.com/ website, the input line you can copy and paste into the first field is this one:

2020-06-16	11:00:04	MAA50-C2	7486	2409:4073:20a:8398:c85d:cc75:6c7a:be8b	GET	dej1k5scircsp.cloudfront.net	/css/style/style.css	200	https://dej1k5scircsp.cloudfront.net/	Mozilla/5.0%20(X11;%20Linux%20x86_64)%20AppleWebKit/537.36%20(KHTML,%20like%20Gecko)%20Chrome/77.0.3865.75%20Safari/537.36	-	-	Miss	P9QcGJ-je6GoPCt-1KqOIgAHr6j05In8FFJK4E8DbZKHFyjp-dDfKw==	dej1k5scircsp.cloudfront.net	http	376	0.102	-	-	-	Miss	HTTP/1.1	-	-	38404	0.102	Miss	text/css	7057	-	-

And the Grok pattern is:

%{DATE:date}[ t]%{TIME:time}[ t]%{DATA:x_edge_location}[ t](?:%{NUMBER:sc_bytes}|-)[ t]%{IP:c_ip}[ t]%{WORD:cs_method}[ t]%{HOSTNAME:cs_host}[ t]%{NOTSPACE:cs_uri_stem}[ t]%{NUMBER:sc_status}[ t]%{GREEDYDATA:referrer}[ t]%{NOTSPACE:user_agent}[ t]%{GREEDYDATA:cs_uri_query}[ t]%{NOTSPACE:cookie}[ t]%{WORD:x_edge_result_type}[ t]%{NOTSPACE:x_edge_request_id}[ t]%{HOSTNAME:x_host_header}[ t]%{URIPROTO:cs_protocol}[ t]%{INT:cs_bytes}[ t]%{NUMBER:time_taken}[ t]%{NOTSPACE:x_forwarded_for}[ t]%{NOTSPACE:ssl_protocol}[ t]%{NOTSPACE:ssl_cipher}[ t]%{NOTSPACE:x_edge_response_result_type}[ t]%{NOTSPACE:cs_protocol_version}[ t]%{NOTSPACE:fle_status}[ t]%{NOTSPACE:fle_encrypted_fields}[ t]%{NOTSPACE:c_port}[ t]%{NOTSPACE:time_to_first_byte}[ t]%{NOTSPACE:x_edge_detailed_result_type}[ t]%{NOTSPACE:sc_content_type}[ t]%{NOTSPACE:sc_content_len}[ t]%{NOTSPACE:sc_range_start}[ t]%{NOTSPACE:sc_range_end}

Original image link here

Now let’s run Logstash:

sudo /usr/share/logstash/bin/logstash -f /etc/logstash/conf.d/logstash/aws_cloudfront/aws-cloudfront.conf

As always, we press CTRL+C once it finishes its job.

Once again, let’s take a look at how the log has been parsed and inserted into the index:

curl -XGET "https://localhost:9200/aws-cloudfront-logs/_search?pretty" -H 'Content-Type: application/json' -d'
{
  "query": {
    "bool": {
      "must_not": [
        {"term": {
          "tags": {
            "value": "_grokparsefailure"
          }
        }
      }
      ]
    }
  }
}'

Part of the output should be similar to the following:

{
        "_index" : "aws-cloudfront-logs",
        "_type" : "_doc",
        "_id" : "Da1s4nIBnKKcJetIb-p9",
        "_score" : 0.0,
        "_source" : {
          "time_to_first_byte" : "0.000",
          "cs_uri_stem" : "/favicon.ico",
          "x_edge_request_id" : "vhpLn3lotn2w4xMOxQg77DfFpeEtvX49mKzz5h7iwNXguHQpxD6QPQ==",
          "sc_bytes" : "910",
          "@version" : "1",
          "cs_host" : "dej1k5scircsp.cloudfront.net",
          "c_ip" : "2409:4073:20a:8398:c85d:cc75:6c7a:be8b",
          "user_agent" : "Mozilla/5.0%20(X11;%20Linux%20x86_64)%20AppleWebKit/537.36%20(KHTML,%20like%20Gecko)%20Chrome/77.0.3865.75%20Safari/537.36",
          "sc_range_start" : "-",
          "c_port" : "57406",
          "x_edge_result_type" : "Error",
          "referrer" : "https://dej1k5scircsp.cloudfront.net/",
          "x_edge_location" : "MAA50-C2",
          "path" : "/etc/logstash/conf.d/logstash/aws_cloudfront/cloudfront_logs.log",
          "cs_protocol" : "http",
          "time_taken" : "0.001",
          "x_forwarded_for" : "-",
          "time" : "10:58:07",
          "cookie" : "-",
          "sc_status" : "502",
          "date" : "20-06-16",
          "sc_range_end" : "-",
          "x_edge_detailed_result_type" : "Error",
          "ssl_cipher" : "-",
          "cs_method" : "GET",
          "x_host_header" : "dej1k5scircsp.cloudfront.net",
          "sc_content_len" : "507",
          "ssl_protocol" : "-",
          "fle_status" : "-",
          "@timestamp" : "2020-06-23T18:24:15.784Z",
          "fle_encrypted_fields" : "-",
          "cs_bytes" : "389",
          "x_edge_response_result_type" : "Error",
          "host" : "coralogix",
          "cs_uri_query" : "-",
          "sc_content_type" : "text/html",
          "cs_protocol_version" : "HTTP/1.1"
        }
      }

Cleaning Up

Before continuing with the next lesson, let’s clean up the resources we created here.

First, we’ll delete the directory where we stored our sample log files and Logstash configurations:

sudo rm -r /etc/logstash/conf.d/logstash/

Next, let’s delete all the new indices we created:

curl -XDELETE localhost:9200/nginx-access-logs-02

curl -XDELETE localhost:9200/iis-log

curl -XDELETE localhost:9200/mongo-logs-01

curl -XDELETE localhost:9200/apache-logs

curl -XDELETE localhost:9200/es-test-logs

curl -XDELETE localhost:9200/es-slow-logs

curl -XDELETE localhost:9200/mysql-slowlogs-01

curl -XDELETE localhost:9200/aws-elb-logs

curl -XDELETE localhost:9200/aws-alb-logs

curl -XDELETE localhost:9200/aws-cloudfront-logs

Conclusion

I hope this arsenal of Grok patterns for common log types are useful for most of your future Logstash needs. Keep in mind that if the log you encounter is just slightly different, only slight changes need to be made to these patterns, which you can use as your starting templates.

Tutorial: Logstash Grok Patterns with Examples

Logstash can parse CSV and JSON files easily because data in those formats are perfectly organized and ready for Elasticsearch analysis. Sometimes, though, we need to work with unstructured data, like plain-text logs. In these cases, we’ll need to parse the data to turn it into structured data using Logstash Grok or another 3rd party service like Coralogix. This tutorial will help you use Elasticsearch’s analysis and querying capabilities by parsing with Logstash Grok.

So, let’s dive in and learn how to deal with unstructured data using the Logstash Grok filter.

Why Choose Grok?

Logstash Grok isn’t the only option available to parse unstructured logs. Plenty of other plugins, such as Dissect, third-party log management tools, or just plain RegEx, could do the trick. We can even build our own custom parsing logic if we have super-specific needs.

Grok is a popular choice for a multitude of reasons, starting with how easy it is to use. Grok patterns are relatively easy to understand, especially if we are already familiar with regular expressions, and come with a wide range of built-in patterns for common log formats such as timestamps, IP addresses, and URLs. We can also create custom patterns to cater to our exact requirements. 

While there are standalone Grok parser libraries available for various programming languages, Logstash Grok is specifically designed for Logtsash and the tight integration means we can easily incorporate Grok patterns into our Logstash configurations. On top of that, the plugin has been available for years and has a large community of users who share new patterns and best practices online.

Dissect Vs Grok

People often ask if they should use Grok or Dissect to parse their logs in Logstash.

While Grok uses regular expressions to match patterns within log lines, Dissect operates by splitting log lines into key-value pairs based on predefined delimiters such as spaces, commas, or other characters. Dissect is often faster and more efficient than Grok if our log formats have well-defined structures and consistent delimiters. It also means that Dissect configurations are simpler and more concise than Grok patterns, especially for straightforward log formats. However, it is worth noting that Dissect is less flexible than Grok when dealing with more complex unstructured log data. We can decide to use one or the other, or both for a hybrid use case when a section of the line is reliably repeated, but the entire line is not.

Now that we have learned more about Grok and the alternatives let’s dive into Logstash Grok filters.

Theory

In a CSV file, each record has an identical list of fields. The sequence of these fields repeats predictably for any program to read in a structured way. Naturally, this is an ideal situation for Elasticsearch.

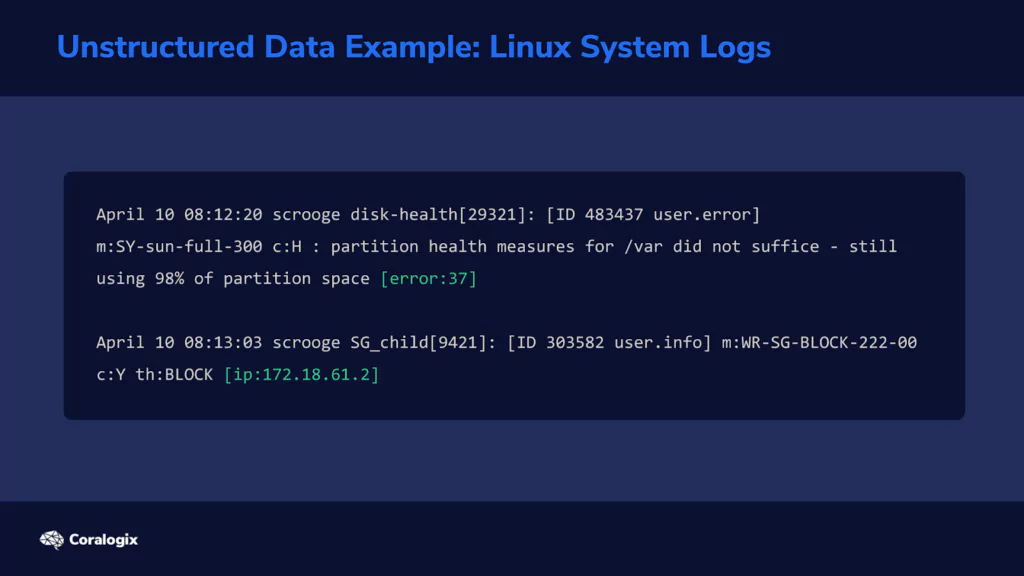
In other cases, information cannot be organized in this ideal way. Consider a typical Linux system log.

Multiple programs write their status or error messages to the same log file. On one line in the log, the last field might be an error code. But on the following line, the last field might be an IP address. This means that the parser now needs to have a way to “detect” what each field represents. Let’s look at how the Grok filter does this.

Understanding Grok Patterns and Syntax
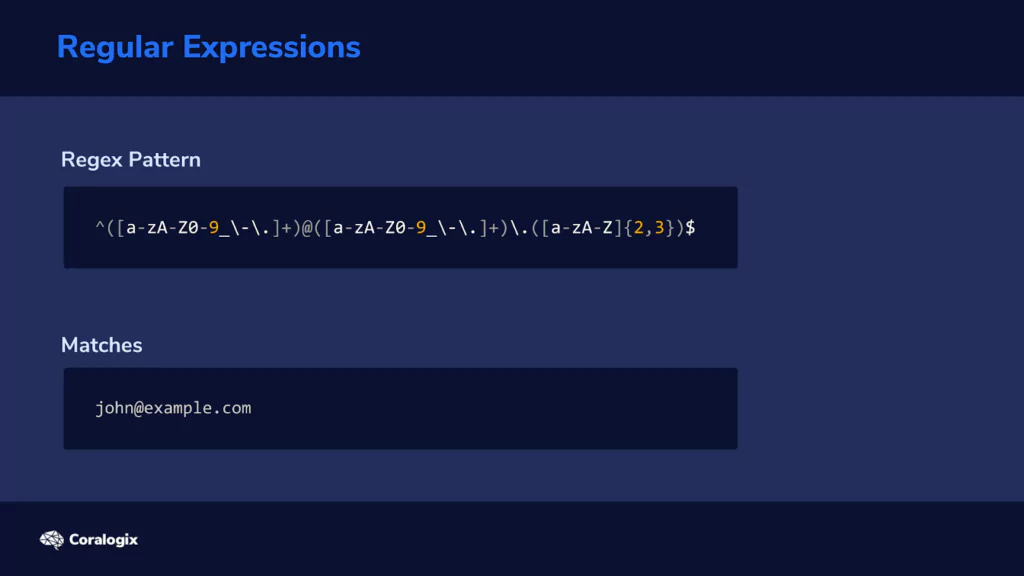
When we see something like “john@example.com,” we immediately think of “email address” because we have learned to recognize this pattern. Grok can do the same thing by analyzing each piece of text and checking if it matches the patterns you instruct it to look for.

Grok uses regular expressions, or RegEx for short, behind the scenes, which can look weird for someone unfamiliar. For example, here’s how a regular expression that matches an email looks like:

Fortunately, many common expressions are already predefined in Logstash’s Grok filter, and we can use their pattern names instead of writing those complicated strings of characters ourselves.

We can find a list of these predefined pattern names on the documentation page for the Grok filter plugin.

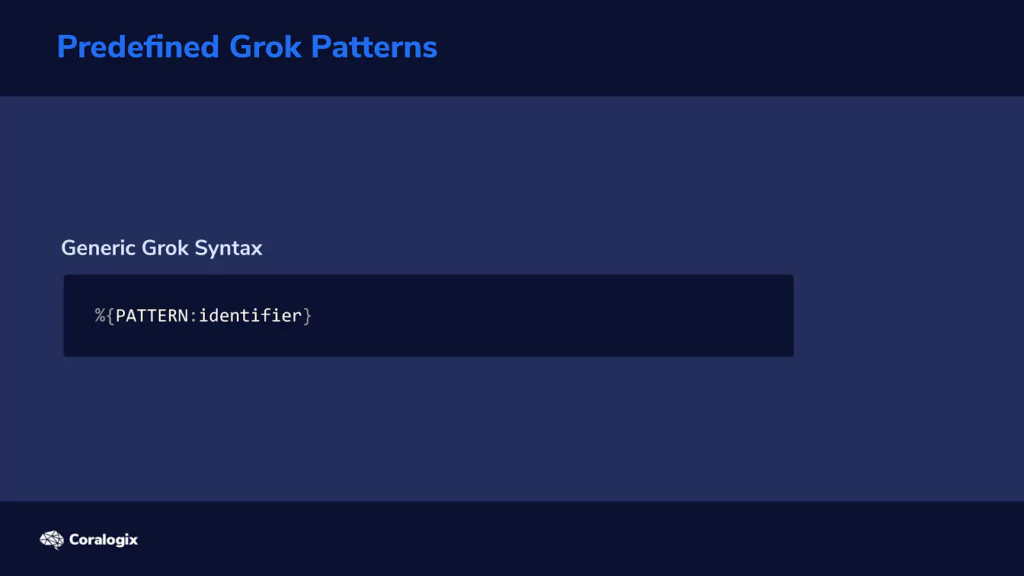
The generic Grok syntax looks like this:

In a nutshell, we tell it what pattern to look for and how to label the strings that match those patterns.

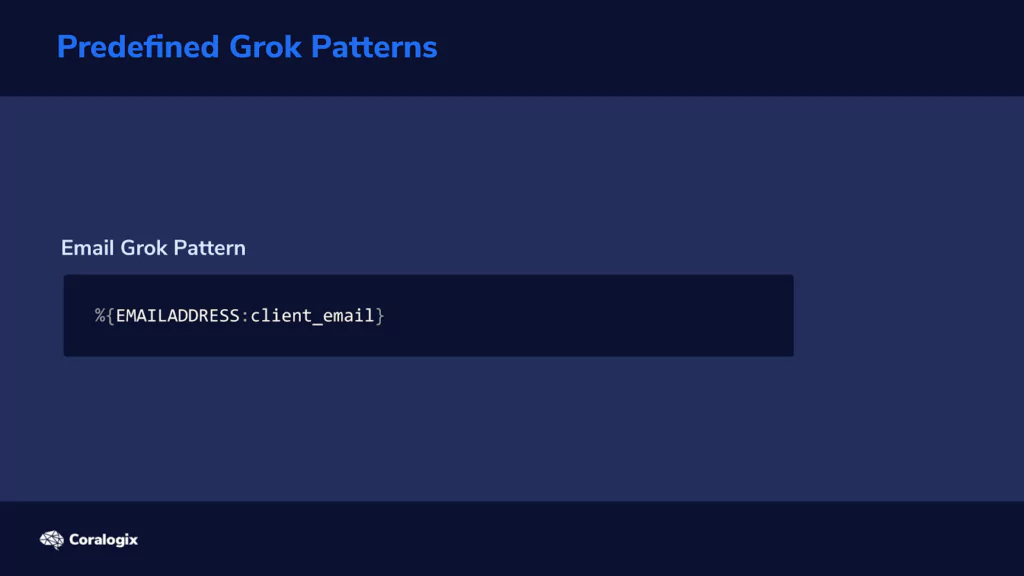
Back to our earlier example, this is how to define and label email addresses:


This Grok pattern will look for all email addresses and identify each as “client_email.” You’re free to choose whatever identifier name you want.

In our case, identifiers will be used as field names for matched values that will be imported to the index. We’ll see how this works in the hands-on exercises to follow.

Example Grok Filter

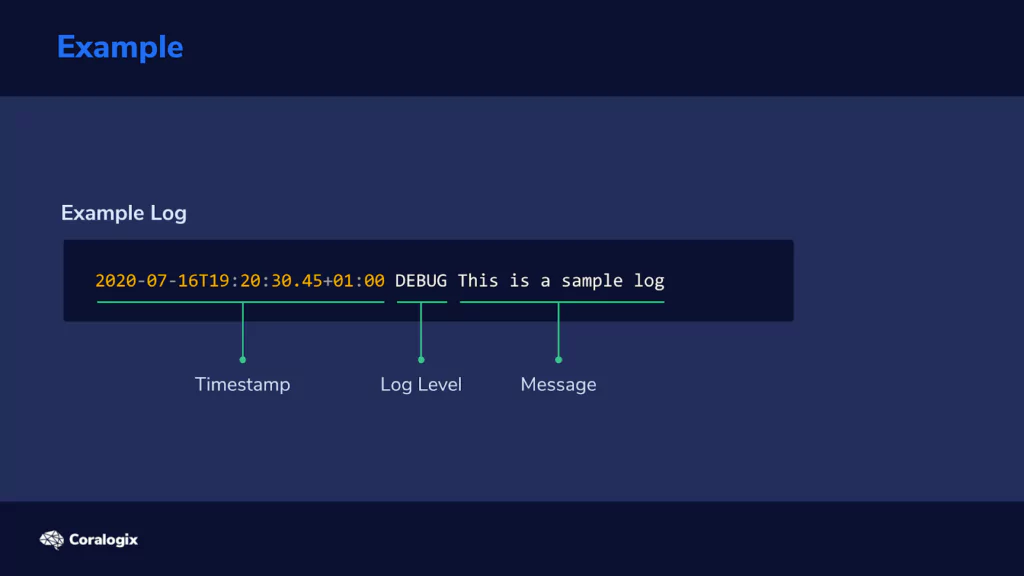
Let’s analyze how we would use Grok. Consider the following line in a log file:

We can see three logical components here: a timestamp, the level of logging, and the error or status message.

The timestamp is in the so-called ISO format, which is useful since we have a Grok pattern that is already available.

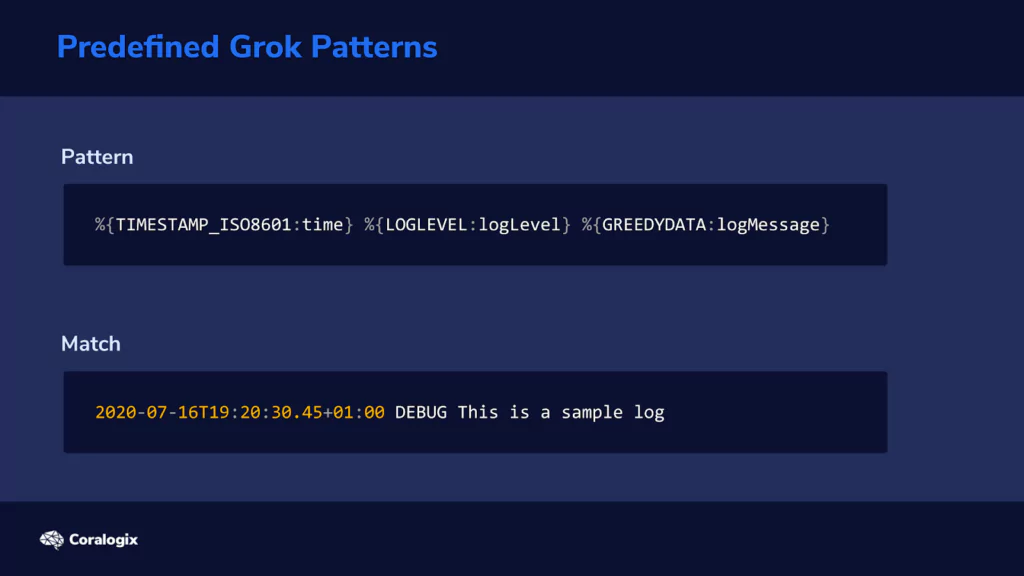
How would we define a Grok filter that would extract the three components from this piece of log text? Well, here it is:

GREEDYDATA might sound mysterious, but all it does is match all other characters in the string analyzed, so it extracts the rest of the text.

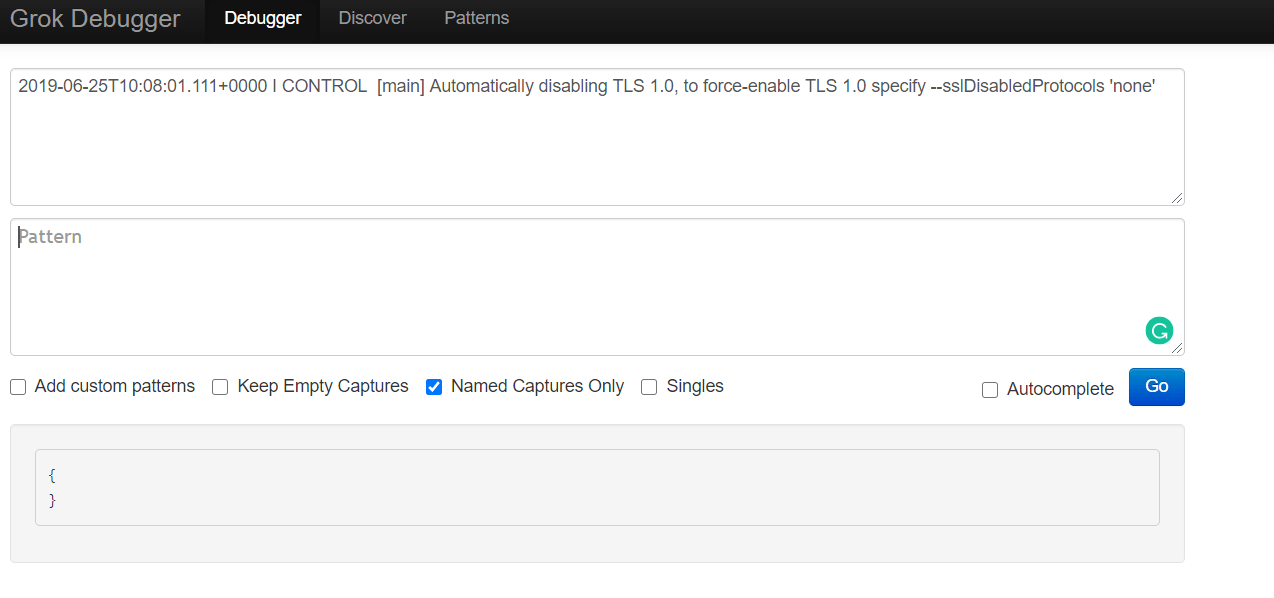
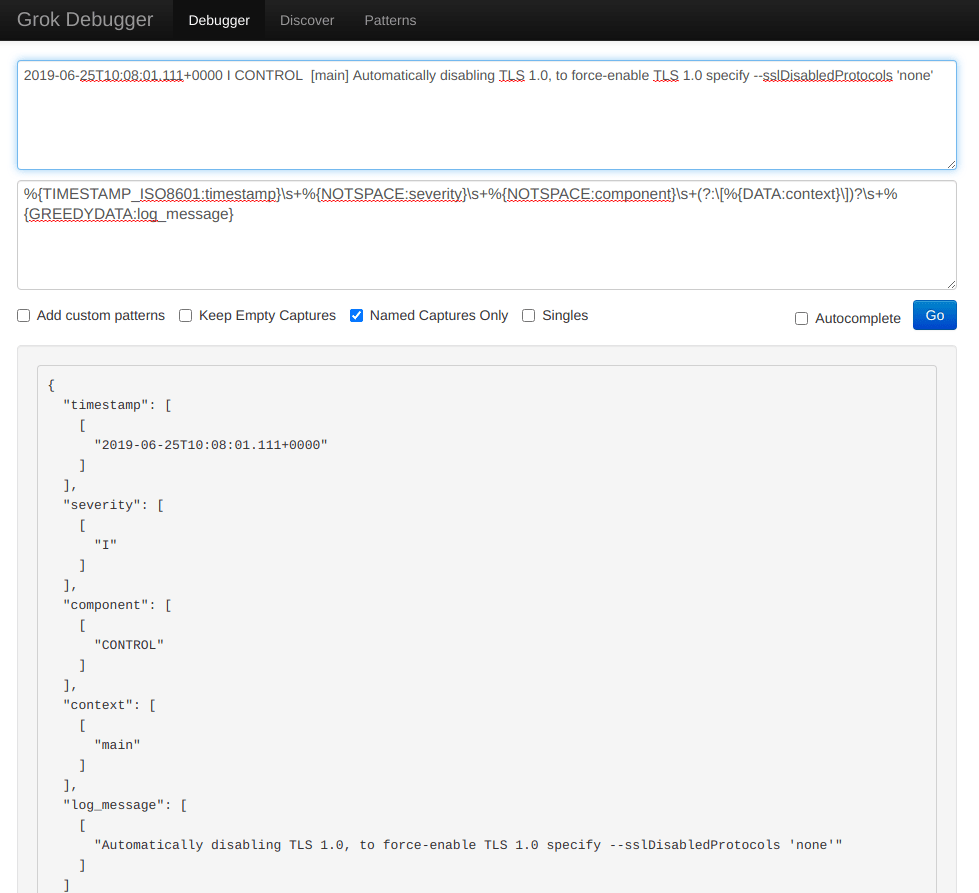
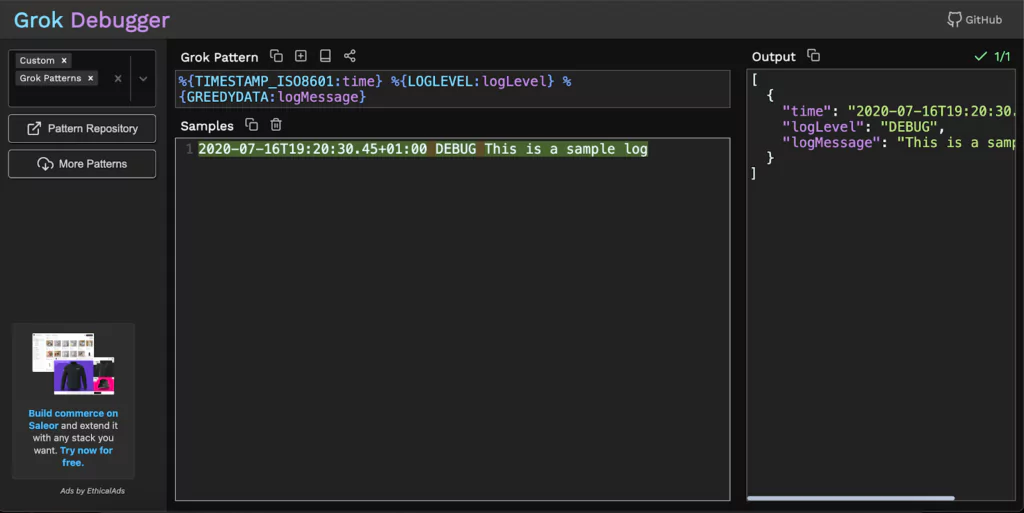
Naturally, we would also like to test these Grok filters and see if they work as intended, on our specific data. For this purpose, we can use the Grok Debugger tool.


With the Grok Debugger, we can copy and paste the Grok filter in the first “Grok Pattern” field and the example log line in the second “Samples” field. 

The output would look like this:

Now that we’ve established some Grok fundamentals, let’s explore the concepts using various examples.

Hands-On Exercises

Parsing a Log File with Grok

Let’s apply this newly acquired knowledge and see how to use the Logstash Grok filter plugin on a sample log file.

First, let’s create a directory where we will store our sample data:

$ mkdir -p /home/student/03-grok-examples

Next, let’s create the file we will parse:

$ nano /home/student/03-grok-examples/sample.log

Now let’s copy and paste the following text into the nano editor:

2020-10-11T09:49:35Z INFO variable server value is tomcat
2020-03-14T22:50:34Z ERROR cannot find the requested resource
2020-01-02T14:58:40Z INFO initializing the bootup
2020-06-04T06:56:04Z DEBUG initializing checksum
2020-05-07T03:07:11Z INFO variable server value is tomcat

Finally, let’s press CTRL+X, then type Y and then press ENTER to save the file.

We can now create the Logstash configuration file:

$ sudo nano /etc/logstash/conf.d/grok-example.conf

And enter the following content:

input {
  file {
   path => "/home/student/03-grok-examples/sample.log"
   start_position => "beginning"
   sincedb_path => "/dev/null"
  }
}
  filter {
   grok {
    match => { "message" => ['%{TIMESTAMP_ISO8601:time} %{LOGLEVEL:logLevel} %{GREEDYDATA:logMessage}'] }
  }
}
output {
  elasticsearch {
   hosts => "https://localhost:9200"
   index => "demo-grok"
}

stdout {}

}

Once again, we press CTRL+X, followed by Y and then ENTER to save the file.

We can see the configuration under the filter section is quite straightforward. We instruct Logstash to use the grok filter plugin and add match instructions where we used the same patterns and identifiers we explored earlier.

"message" => ['%{TIMESTAMP_ISO8601:time} %{LOGLEVEL:logLevel} %{GREEDYDATA:logMessage}']

Let’s run Logstash with our new configuration and see what happens.

$ sudo /usr/share/logstash/bin/logstash -f /etc/logstash/conf.d/grok-example.conf

After a few seconds, the output shows that the entries have been parsed and imported. At that point, we can press CTRL+C to exit from Logstash.

Let’s explore the contents added to the index:

$ curl -XGET "https://localhost:9200/demo-grok/_search?pretty=true" -H 'Content-Type: application/json' -d'{
  "_source": [
   "logLevel",
   "time",
   "logMessage"
  ]
}'

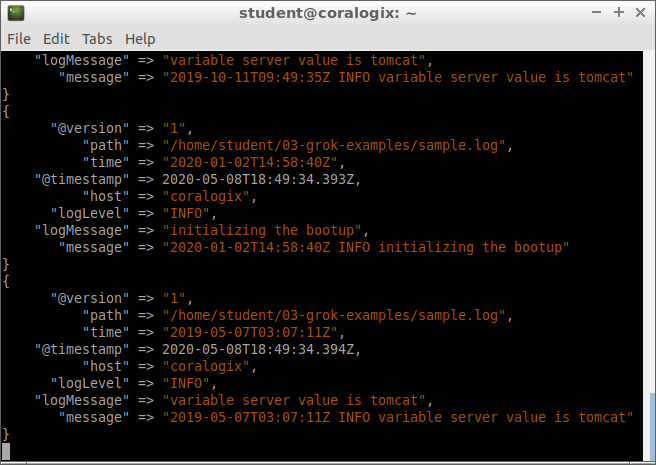
We’ll see our log entries neatly organized in the proper fields. Here’s an example of a document from the index:
 {
 "_index" : "demo-grok",
 "_type" : "_doc",
 "_id" : "FDyf9XEBIGK-cCtPEo5n",
 "_score" : 1.0,
 "_source" : {
 "logLevel" : "INFO",
 "logMessage" : "variable server value is tomcat",
 "time" : "2020-05-07T03:07:11Z"
 }
}

In our scenario, things are optimal since each log line has precisely three components, in the same order and each matches every Grok pattern. But what if some text didn’t match any pattern we defined?

How Grok Deals with Lines that Don’t Match Patterns

Let’s edit our sample log:

$ nano /home/student/03-grok-examples/sample.log

and add the following line at the end:

55.12.32.134 GET /user/id/properties


Our sample log should now have six lines and look like this:

2020-10-11T09:49:35Z INFO variable server value is tomcat
2020-03-14T22:50:34Z ERROR cannot found the requested resource
2020-01-02T14:58:40Z INFO initializing the bootup
2020-06-04T06:56:04Z DEBUG initializing checksum
2020-05-07T03:07:11Z INFO variable server value is tomcat
55.12.32.134 GET /user/id/properties

Once again, we press CTRL+X, then Y and ENTER to save the file.

We don’t want to write over previous data we imported into our index, so let’s delete that first:

$ curl -XDELETE "https://localhost:9200/demo-grok"

Now let’s rerun Logstash:

$ sudo /usr/share/logstash/bin/logstash -f /etc/logstash/conf.d/grok-example.conf

After the job is done, we press CTRL+C to exit. Let’s see what our index looks like this time:

$ curl -XGET "https://localhost:9200/demo-grok/_search?pretty=true" -H 'Content-Type: application/json' -d'{ }'

Besides the entries we saw the first time, we will now see a sixth entry that looks like this:

{
"_index" : "demo-grok",
"_type" : "_doc",
"_id" : "Gjyr9XEBIGK-cCtPRI4L",
"_score" : 1.0,
"_source" : {
"tags" : [
"_grokparsefailure"
],
"@timestamp" : "2020-05-08T19:02:53.768Z",
"path" : "/home/student/03-grok-examples/sample.log",
"message" : "55.12.32.134 GET /user/id/properties",
"@version" : "1",
"host" : "coralogix"
}

We can see that the document lacks the fields “time,” “logLevel,” and “logMessage.” The “message” field shows the line from our sample log that generated this document. We can see that this line doesn’t have any fields matching our Grok filter patterns. A tag called _grokparsefailure is added to signal that the parser had trouble with this line from the file.

We now saw what happens when Grok patterns can’t match anything on a line. Let’s explore the next scenario.

Multiple Grok Filters to Parse Complex Files

In our previous Logstash configuration, Grok tried to match our three patterns against each line in the sample log. But what if we want each line scanned for a second pair of patterns in case the first pair doesn’t match anything?

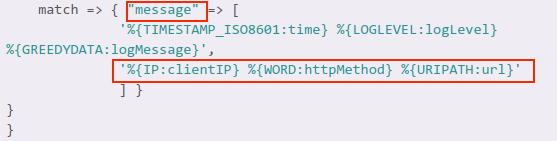
For example, in our case, if the line doesn’t have a timestamp, log level and log message, then Grok should try to search for another set of patterns. In this scenario, it will look for an IP address, an HTTP method and a URL.

Let’s create another configuration file for this:

$ sudo nano /etc/logstash/conf.d/grok-example-02.conf

In the nano editor, we copy and paste this content:

input {
  file {
   path => "/home/student/03-grok-examples/sample.log"
   start_position => "beginning"
   sincedb_path => "/dev/null"
  }
}
filter {
  grok {
   match => { "message" => [
   '%{TIMESTAMP_ISO8601:time} %{LOGLEVEL:logLevel} %{GREEDYDATA:logMessage}',
   '%{IP:clientIP} %{WORD:httpMethod} %{URIPATH:url}'
   ] }
 }
}
output {
  elasticsearch {
   hosts => "https://localhost:9200"
   index => "demo-grok-multiple"
 }

stdout {}

}

Once again, we press CTRL+X, followed by Y and then ENTER to save the file.

We notice the change in the config file is the new line added to the match option:

'%{IP:clientIP} %{WORD:httpMethod} %{URIPATH:url}'

We also see that these two sets of patterns are separated by a comma. So it’s pretty straightforward to add multiple pairs of patterns to a Grok filter.

But why would we do this? Well, this way, we can process complex logs where multiple programs log to the same file, as one example. Say Nginx and MySQL logged to the same file. One set of patterns can deal with log lines generated by Nginx, the other set can deal with lines generated by MySQL.


Let’s run Logstash with these new options:

$ sudo /usr/share/logstash/bin/logstash -f /etc/logstash/conf.d/grok-example-02.conf

As usual, we wait for the program to finish and then press CTRL+C to exit.

Let’s see what has been added to the index:

$ curl -XGET "https://localhost:9200/demo-grok-multiple/_search?pretty" -H 'Content-Type: application/json' -d'{
  "_source": {
   "excludes": [
    "@timestamp",
   "host",
  "path"
  ]
 }
}

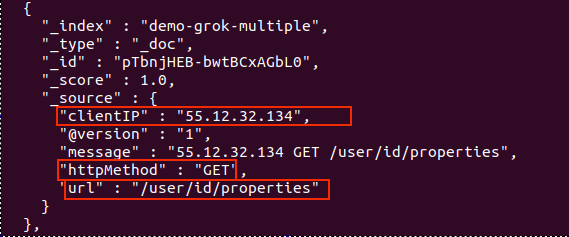
No more _grokparsefailure tags. Also, a new document corresponds to the new line we added to our sample log:

Nice! We got our log data neatly organized in Elasticsearch! We now have the freedom to parse almost any kind of text file, even if its information doesn’t follow a fixed pattern.

Guide: Parsing Multiline Logs with Coralogix

In the context of monitoring logging, multiline logs happen when a single log is written as multiple lines in the log file. This can either be caused by not using a standard logger to write with (e.g. print to console) or there’s a n (Newline) in the log to make it more readable (e.g. Java stack traces are error logs formatted as a list of stack frames)

When logs are sent to 3rd party full-stack observability platforms like Coralogix using standard shipping methods (e.g. Fluentd, Filebeat), which read log files line-by-line, every new line creates a new log entry, making these logs unreadable for the user. But, have no fear, there are many shipping methods that support pre-formatting multiline logs so that you are able to restructure, format, and combine the lines into single log messages.

Multiline Log Example

Here’s how a multiline log looks, using a Java stack trace log for this example:

09-24 16:09:07.042: ERROR System.out(4844): java.lang.NullPointerException
     at com.temp.ttscancel.MainActivity.onCreate(MainActivity.java:43)
     at android.app.Activity.performCreate(Activity.java:5248)
     at android.app.Instrumentation.callActivityOnCreate(Instrumentation.java:1110)
     at android.app.ActivityThread.performLaunchActivity(ActivityThread.java:2162)
     at android.app.ActivityThread.handleLaunchActivity(ActivityThread.java:2257)
     at android.app.ActivityThread.access$800(ActivityThread.java:139)
     at android.app.ActivityThread$H.handleMessage(ActivityThread.java:1210)

When sending this log using a log shipper, each line will be considered as an independent log message since log files are read line by line (assuming new entry when encountering n) unless a multiline pattern was set in your configuration file.

Configurations with Multiline

Multiline is a configuration option, which should be configured by the user. As mentioned before, most shipping methods support adding multiline pattern options. We will review a few of the most common file shipper configurations and see how to configure multiline to work with them.

Logstash

Being part of the Elastic ELK stack, Logstash is a data processing pipeline that dynamically ingests, transforms, and ships your data regardless of format or complexity. Here is an example of how to implement multiline with Logstash.

Within the file input plugin use:

codec => multiline {
     pattern => "^DT:s*d{2,4}-d{2,4}-d{2,4} d{2,4}:d{2,4}:d{2,4}.d{3,4}"
     negate => true
     what => "previous"
}

The negate can be true or false (defaults to false). If true, a message not matching the pattern will constitute a match of the multiline filter and the what will be applied.

The what can be previous or Next. If the pattern matched, does the event belong to the next or previous event?

For more information on multiline using Logstash visit here.

Filebeat

Also developed by Elastic, Filebeat is a lightweight shipper for forwarding and centralizing logs and files. You can either forward data to your local Logstash and from there to Coralogix, or. you ship directly to our Logstash endpoint.

Within the filebeat.inputs under type–>log use:

 multiline:
   pattern: '^[0-9]{1,3}.[0-9]{1,3}.[0-9]{1,3}.[0-9]{1,3}'
   negate: true
   match: after

The negate can be true or false (defaults to false). If true, a message not matching the pattern will constitute a match of the multiline filter and the what will be applied.

The match can be after or before. If the pattern matched, does the event belong to the next or previous event? (The after setting is equivalent to previous in Logstash, and before is equivalent to next)

For more info on working with multiline in Filebeat, visit here.

FluentD

Fluentd is a data collector which lets you unify the data collection and consumption for better use and understanding of data.

Within the FluentD source directive, use:

<parse>
  @type multiline
  format_firstline /^DT:s*d{2,4}-d{2,4}-d{2,4} d{2,4}:d{2,4}:d{2,4}.d{3,4}/
  format1 /(?<message>.*)/
</parse>

The format_firstline specifies the regexp pattern for the start line of multiple lines. Input plugin can skip the logs until format_firstline is matched.

The formatN, N’s range is 1..20, is the list of Regexp formats for the multiline log. For readability, you can separate Regexp patterns into multiple regexpN parameters. These patterns are joined and constructs regexp pattern with multiline mode.

Note that in my example, I used the format1 line to match all multiline log text into the message field. Then, I used Coralogix parsing rules to parse my logs into a JSON format. For more information on Coralogix parsing rules visit here.

For more info on multiline in Fluentd visit here.

Fluent-bit

Fluent Bit is a multi-platform Log Processor and Forwarder which allows you to collect data/logs from different sources, unify and send them to multiple destinations.

The Main config, use:

[SERVICE]
    Log_Level debug
    Parsers_File /path/to/parsers.conf
[INPUT]
    Name tail
    Path /var/log/fluent-bit/*.log
    Multiline On
    Parser_Firstline multiline_pattern

parsers.conf file:

[PARSER]
    Name multiline_pattern
    Format regex
    Regex ^[(?<timestamp>[0-9]{2,4}-[0-9]{1,2}-[0-9]{1,2} [0-9]{1,2}:[0-9]{1,2}:[0-9]{1,2})] (?<message>.*)

Note: In Fluent Bit, the multiline pattern is set in a designated file (parsers.conf) which may include other REGEX filters. At that point, it’s read by the main configuration in place of the multiline option as shown above. Secondly, in a Fluent Bit multiline pattern REGEX you have to use a named group REGEX in order for the multiline to work.

For more info on multiline in Fluent Bit visit here.

More examples of common multiline patterns

  • 2019-05-21 23:59:19.5523
    
    ^d{2,4}-d{2,4}-d{2,4} d{2,4}:d{2,4}:d{2,4}.d{1,6}
  • 16/Dec/2019:17:40:14.555
    
    ^d{1,2}/w{3}/d{2,4}:d{2,4}:d{2,4}:d{2,4}.d{1,6}
  • 18:43:44.199
    
    ^d{2,4}:d{2,4}:d{2,4}.d{1,6}
  • 2018-03-22T12:35:47.538083Z
    
    ^d{2,4}-d{2,4}-d{2,4}Td{2,4}:d{2,4}:d{2,4}.d{1,6}Z
  • [2017-03-10 14:30:12,655+0000]
    
    ^[d{2,4}-d{2,4}-d{2,4} d{2,4}:d{2,4}:d{2,4},d{1,6}+d{4}]
  • [2017-03-10 14:30:12.655]
    
    ^[d{4}-d{2}-d{2}s+d{2}:d{2}:d{2}.d{3}]
  • 2017-03-29 10:00:00,123
    
    ^%{TIMESTAMP_ISO8601} (In Logstash you can also use Grok patterns)
  • 2017-03-29 Or Mar 22, 2020
    
    ^(d{2,4}-d{2}-d{2,4}|[A-Za-z]{3} d{1,2}, d{4})

How to check for a multiline issue in Coralogix

It is recommended to look for multiline problems once integration was implemented so you can be sure your log collection works correctly. You can take a few steps in Coralogix to check whether you are dealing with a possible multiline issue:

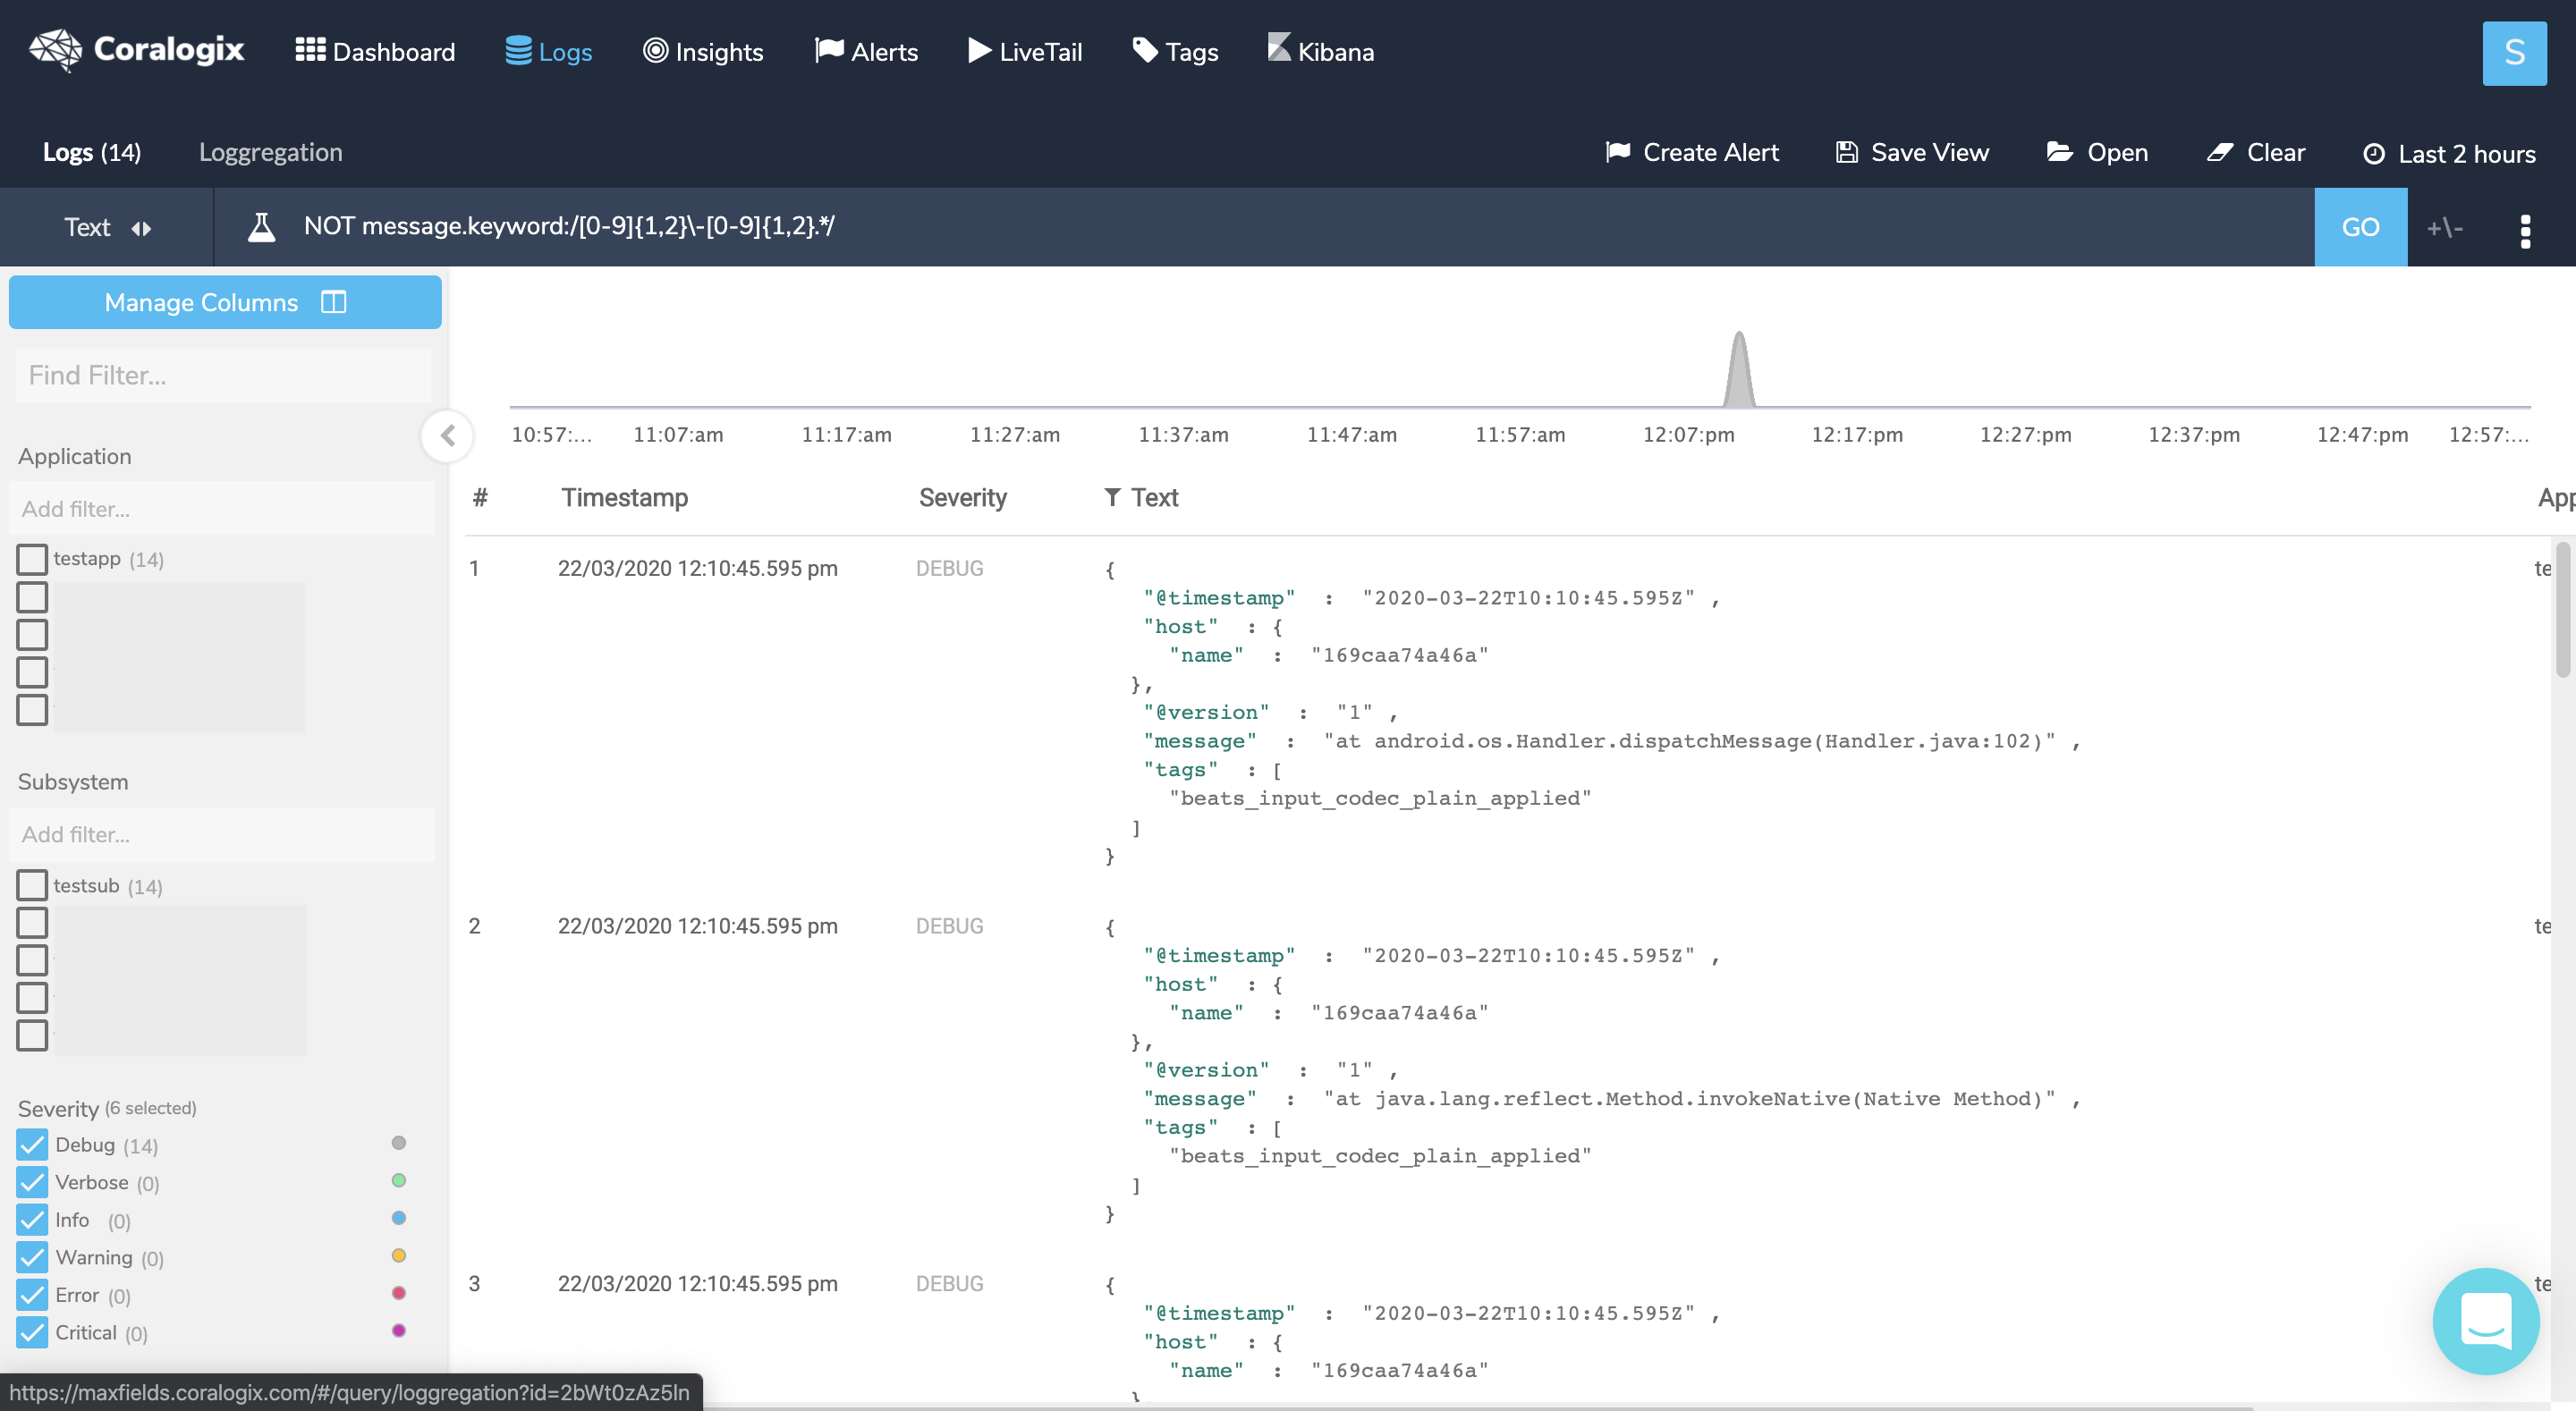
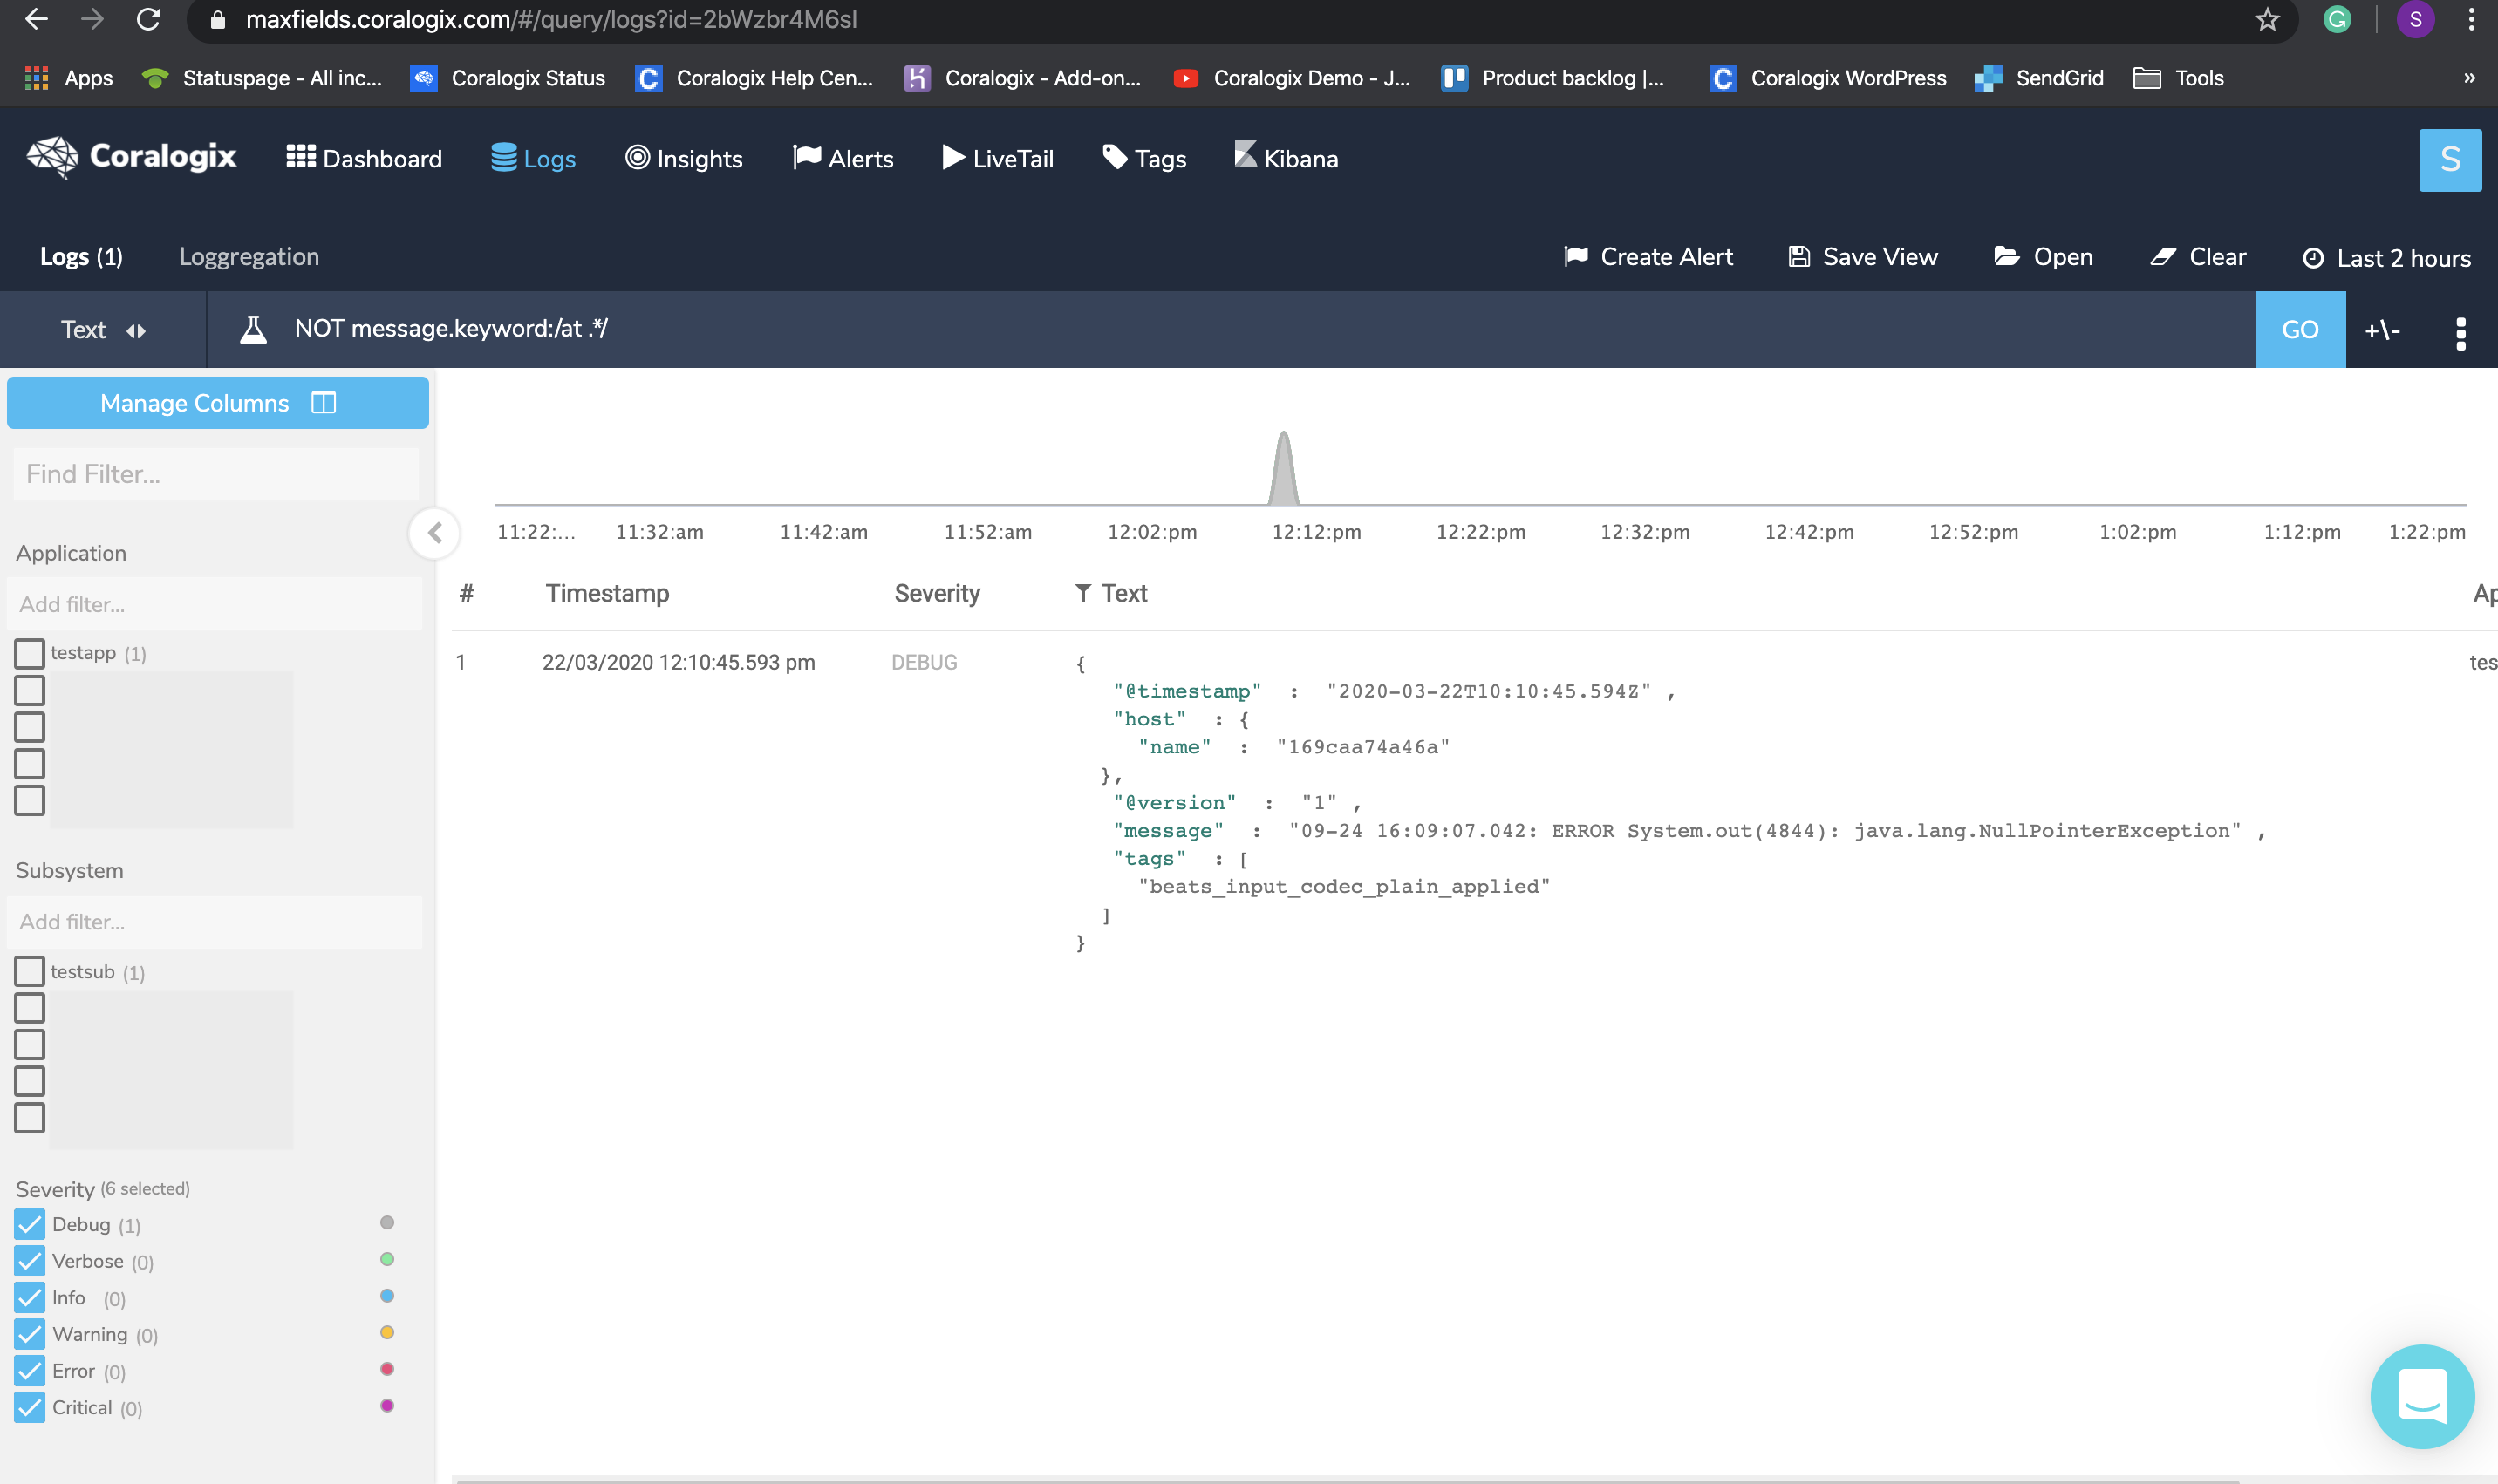
  1. Given the above example of Java stack trace logs, when you know what is the beginning of a line you can create a NOT query on those logs to see if you have any logs that don’t start as expected, which might point to a multiline issue.
    Query : NOT message.keyword:/[0-9]{1,2}-[0-9]{1,2}.*/
    coralogix multiline post log beginning

    To verify that these logs are indeed part of another log entry click on one of them, then hover the +/- sign near the ‘GO’ button and choose a time interval (the min 5 seconds should suffice) and check whether you can find a log before the chosen log that represents its beginning. In our example, I would find the log that starts with the timestamp just right before the marked log. To solve this issue, set a new multiline pattern in your configuration and restart your service.

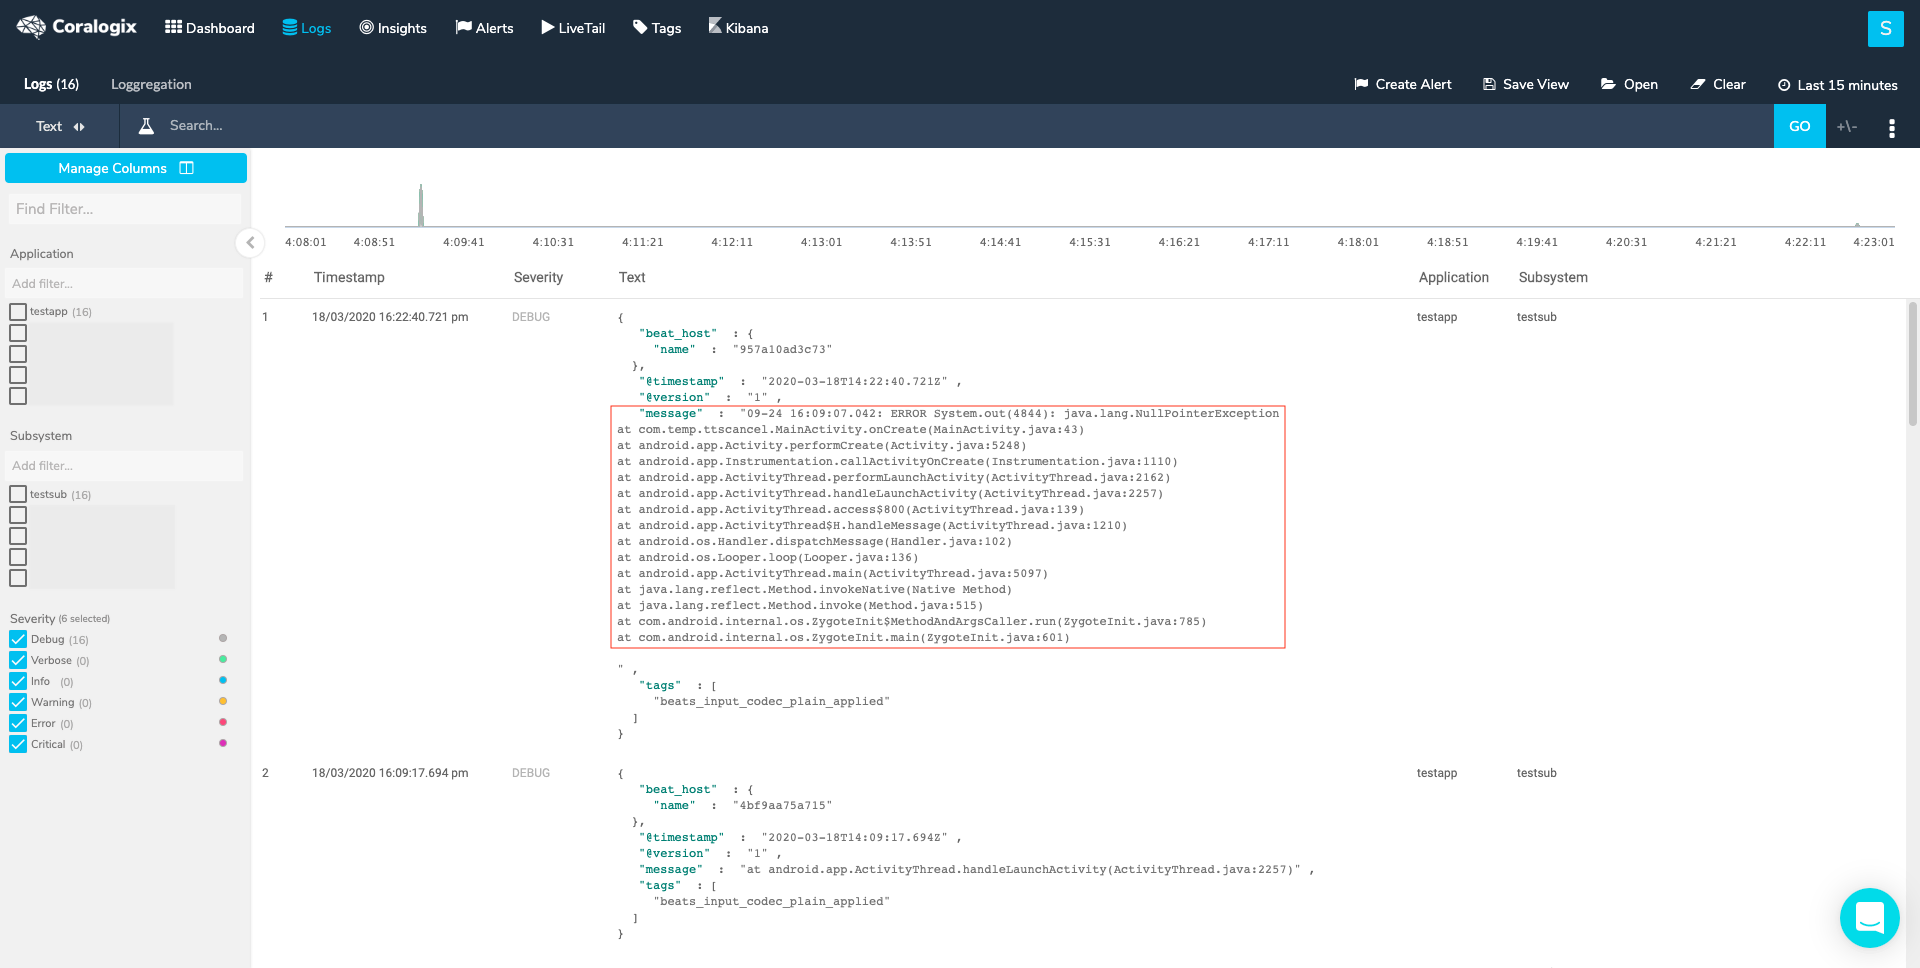
  2. When you are not sure what is the beginning of a line but are encountering logs that don’t seem to represent a full log, you can create a NOT query on those logs to see what are their possible beginnings.
    Query : NOT message.keyword:/at .*/
    coralogix multiline post log middle

    Click on the result, hover the +/- sign and check if you got any logs before or after the chosen log that might be a part of it. To solve this, set a new multiline pattern in your configuration and restart your service.

  3. Use Loggregation to identify log templates that belong to multiline logs. Briefly, Loggregation is a Coralogix proprietary algorithm that condenses millions of log entries into a narrow set of patterns, allowing you to easily identify a case where the message field, within a template, doesn’t contain the full log message. After setting the right multiline in our configuration we should expect the full log entry to look like this:coralogix multiline guide with multiline

Need help? check our website and in-app chat for quick advice from our product specialists.

Instantly Parse The Top 12 Log Types with Coralogix

Throughout the past few months, I had the opportunity to work with and serve hundreds of Coralogix’s customers, the challenges in performing efficient Log Analytics are numerous, from log monitoring, collecting, searching, visualizing, and alerting. What I have come to learn is that at the heart of each and every one of these challenges laid the challenge of data parsing. JSON structured logs are easier to read, easier to search, alert, and visualize. They can be queried using the ES API’s, exported to Excel sheets, and even be displayed in Grafana.  So why is it that a lot of logs are still plain text by default and not structured?

As our focus here in Coralogix was always about our customers and their needs, we developed a parsing engine that allows a single UI to parse, extract, mask, and even exclude log entries in-app, or via API. To get you started with log parsing,  we created pre-defined parsing rules for the 12 most common logs on the web.

In this post, we collected the following log templates and created their own Named group REGEX in order to parse them into JSON structure logs in Coralogix: Apache logs, IIS, logs, MongoDB logs, ELB logs, ALB logs, CloudFront logs, Mysql logs, access logs, Nginx logs, Http headers, user agent field, java stack trace.

Note that every regex is submitted as a recommendation, of course logs can have different configurations and permutations, you can easily adjust the parsing rules below to your needs, more on named group regex here.

1. User Agent (Use an “Extract” rule in Coralogix):

https://regex101.com/r/pw0YeT/3

Sample Log

Mozilla/5.0 (iPad; U; CPU OS 3_2_1 like Mac OS X; en-us) AppleWebKit/531.21.10 (KHTML, like Gecko) Mobile/7B405

Regular Expression

(?P<mozillaVersion>Mozilla/[0-9.]+) ((?P<sysInfo>[^)]+))(?: (?P<platform>[^ ]+))?(?: ((?P<platformInfo>[^)]+)))?(?: (?P<extentions>[^n]+))?

Results

{ 
  "extentions" : "Mobile/7B405" ,
  "platformInfo" : "KHTML, like Gecko" ,
  "sysInfo" : "iPad; U; CPU OS 3_2_1 like Mac OS X; en-us" ,
  "mozillaVersion" : "Mozilla/5.0" ,
  "platform" : "AppleWebKit/531.21.10"
}

2. Cloud-Front (Use a “Parse” rule in Coralogix):

https://regex101.com/r/q2DmKi/4

Sample Log

2014-05-23 01:13:11 FRA2 182 192.0.2.10 GET d111111abcdef8.cloudfront.net /view/my/file.html 200 www.displaymyfiles.com Mozilla/4.0%20(compatible;%20MSIE%205.0b1;%20Mac_PowerPC) - zip=98101 RefreshHit MRVMF7KydIvxMWfJIglgwHQwZsbG2IhRJ07sn9AkKUFSHS9EXAMPLE== d111111abcdef8.cloudfront.net http - 0.001 - - - RefreshHit HTTP/1.1 Processed 1

Regular Expression

(?P<date_time>[0-9]{4}-[0-9]{2}-[0-9]{2}s*[0-9]{2}:[0-9]{2}:[0-9]{2}) (?P<x_edge_location>[^ ]+) (?P<sc_bytes>[0-9]+) (?P<c_ip>[0-9]{1,3}.[0-9]{1,3}.[0-9]{1,3}.[0-9]{1,3}) (?P<cs_method>[^ ]+) (?P<cs_host>[^ ]+) (?P<cs_uri_stem>[^ ]+) (?P<sc_status>[0-9]+) (?P<cs_referer>[^ ]+) (?P<cs_user_agent>[^ ]+) (?P<cs_uri_query>[^ ]+) (?P<cs_cookie>[^ ]+) (?P<x_edge_result_type>[^ ]+) (?P<x_edge_request_id>[^ ]+) (?P<x_host_header>[^ ]+) (?P<cs_protocol>[^ ]+) (?P<cs_bytes>[^ ]+) (?P<time_taken>[^ ]+) (?P<x_forwarded_for>[^ ]+) (?P<ssl_protocol>[^ ]+) (?P<ssl_cipher>[^ ]+) (?P<x_edge_response_result_type>[^ ]+) (?P<cs_protocol_version>[^ ]+) (?P<fle_status>[^ ]+) (?P<fle_encrypted_fields>[^n]+)

Results

{ 
  "x_edge_location" : "FRA2" , 
  "cs_method" : "GET" , 
  "x_edge_result_type" : "RefreshHit" , 
  "ssl_cipher" : "-" ,
  "cs_uri_stem" : "/view/my/file.html" , 
  "cs_uri_query" : "-" ,
  "x_edge_request_id" : "MRVMF7KydIvxMWfJIglgwHQwZsbG2IhRJ07sn9AkKUFSHS9EXAMPLE==" , 
  "sc_status" : "200" , 
  "date_time" : "2014-05-23 01:13:11" ,
  "sc_bytes" : "182" , 
  "cs_protocol_version" : "HTTP/1.1" ,
  "cs_protocol" : "http" , 
  "cs_cookie" : "zip=98101" , 
  "ssl_protocol" : "-" ,
  "fle_status" : "Processed" ,
  "cs_user_agent" : "Mozilla/4.0%20(compatible;%20MSIE%205.0b1;%20Mac_PowerPC)" ,
  "cs_host" : "d111111abcdef8.cloudfront.net" ,
  "cs_bytes" : "-" ,
  "x_edge_response_result_type" : "RefreshHit" ,
  "fle_encrypted_fields" : "1" ,
  "c_ip" : "192.0.2.10" ,
  "time_taken" : "0.001" ,
  "x_forwarded_for" : "-" ,
  "x_host_header" : "d111111abcdef8.cloudfront.net" ,
  "cs_referer" : "www.displaymyfiles.com"
 }


3. ELB (Elastic Load Balancer) – (Use a “Parse” rule in Coralogix):

https://regex101.com/r/T52klJ/1

Sample Log

2015-05-13T23:39:43.945958Z my-loadbalancer 192.168.131.39:2817 10.0.0.1:80 0.000086 0.001048 0.001337 200 200 0 57 "GET https://www.example.com:443/ HTTP/1.1" "curl/7.38.0" DHE-RSA-AES128-SHA TLSv1.2

Regular Expression

(?P<timestamp>[0-9]{4}-[0-9]{2}-[0-9]{2}T[0-9]{2}:[0-9]{2}:[0-9]{2}.[0-9A-Z]+) (?P<elbName>[0-9a-zA-Z-]+) (?P<clientPort>[0-9.:]+) (?P<backendPort>[0-9.:]+) (?P<request_processing_time>[.0-9-]+) (?P<response_processing_time>[.0-9]+) (?P<elb_status_code>[.0-9-]+) (?P<backend_status_code>[0-9-]+) (?P<received_bytes>[0-9-]+) (?P<sent_bytes>[0-9-]+) (?P<request>[0-9-]+) "(?P<user_agent>[^"]+)" "(?P<ssl_cipher>[^"]+)" (?P<ssl_protocol>[- A-Z0-9a-z.]+)

Results

{ 
  "received_bytes" : "200" , 
  "request" : "57" , 
  "elb_status_code" : "0.001337" , 
  "ssl_cipher" : "curl/7.38.0" , 
  "elbName" : "my-loadbalancer" ,
  "request_processing_time" : "0.000086" , 
  "sent_bytes" : "0" , 
  "response_processing_time" : "0.001048" , 
  "backendPort" : "10.0.0.1:80" , 
  "backend_status_code" : "200" , 
  "clientPort" : "192.168.131.39:2817" , 
  "ssl_protocol" : "DHE-RSA-AES128-SHA TLSv1.2" , 
  "user_agent" : "GET https://www.example.com:443/ HTTP/1.1" , 
  "timestamp" : "2015-05-13T23:39:43.945958Z"
}

4. MongoDB (Use a “Parse” rule in Coralogix):

https://regex101.com/r/pBM9DO/1

Sample Log

2014-11-03T18:28:32.450-0500 I NETWORK [initandlisten] waiting for connections on port 27017

Regular Expression

(?P<timestamp>[0-9]{4}-[0-9]{2}-[0-9]{2}T[0-9]{2}:[0-9]{2}:[0-9]{2}.[0-9]{3}-[0-9]{4}) (?P<severity>[A-Z]) [A-Z]+ *[[a-zA-Z0-9]+] (?P<message>[^n]+)

Results

{ 
  "severity" : "I" , 
  "message" : "waiting for connections on port 27017" ,
  "timestamp" : "2014-11-03T18:28:32.450-0500" 
}

5. NSCA access logs (Use a “Parse” rule in Coralogix):

https://regex101.com/r/Iuos8u/1/

Sample Log

172.21.13.45 - MicrosoftJohnDoe [07/Apr/2004:17:39:04 -0800] "GET /scripts/iisadmin/ism.dll?http/serv HTTP/1.0" 200 3401

Regular Expression

(?P<clientIP>[0-9]{1,3}.[0-9]{1,3}.[0-9]{1,3}.[0-9]{1,3})s*(?P<userIdentidier>[^ ]+) (?P<userID>[^ ]+) [(?P<timestamp>[^]]+)] "(?P<clientRequest>[^"]+)" (?P<statusCode>[0-9-]+) (?P<numBytes>[0-9-]+)

Results

{ 
   "numBytes" : "3401" ,
   "userIdentidier" : "-" ,
   "clientIP" : "172.21.13.45" ,
   "userID" : "MicrosoftJohnDoe" ,
   "statusCode" : "200" , 
   "timestamp" : "07/Apr/2004:17:39:04 -0800" , 
   "clientRequest" : "GET /scripts/iisadmin/ism.dll?http/serv HTTP/1.0"
}

6. Java Stacktrace (Use an “Extract” rule in Coralogix):

https://regex101.com/r/ZAAuBW/2

Sample Log

Exception in thread "main" java.lang.NullPointerException 
at com.example.myproject.Book.getTitle(Book.java:16) 
at com.example.myproject.Author.getBookTitles(Author.java:25)
at com.example.myproject.Bootstrap.main(Bootstrap.java:14)

Regular Expression

Exception(?: in thread) "(?P<threadName>[^"]+)" (?P<changethenamelater>.*)s+(?P<stackeholder>(.|n)*)

Results

{ 
  "changethenamelater" : "java.lang.NullPointerException " ,
  "stackeholder" : "at com.example.myproject.Book.getTitle(Book.java:16) 
                    at com.example.myproject.Author.getBookTitles(Author.java:25) 
                    at com.example.myproject.Bootstrap.main(Bootstrap.java:14)" ,
  "threadName" : "main" 
}

7. Basic HTTP Headers (Use a “Extract” rule in Coralogix):

https://regex101.com/r/JRYot3/1

Sample Log

GET /tutorials/other/top-20-mysql-best-practices/ HTTP/1.1

Regular Expression

(?P<method>[A-Z]+) (?P<path>[^ ]+) (?P<protocol>[A-Z0-9./]+)

Results

{ 
  "path" : "/tutorials/other/top-20-mysql-best-practices/" , 
  "protocol" : "HTTP/1.1" , 
  "method" : "GET"
}

8. Nginx (Use a “Parse” rule in Coralogix):

https://regex101.com/r/yHA8Yh/1

Sample Loghttps://regex101.com/r/yHA8Yh/1

127.0.0.1 - dbmanager [20/Nov/2017:18:52:17 +0000] "GET / HTTP/1.1" 401 188 "-" "Mozilla/5.0 (X11; Ubuntu; Linux x86_64; rv:47.0) Gecko/20100101 Firefox/47.0"

Regular Expression

(?P<remoteAdd>[0-9.]+) - (?P<remoteUser>[a-zA-z]+) [(?P<timestamp>[^]]+)] "(?P<request>[^"]+)" (?P<status>[0-9]+) (?P<bodyBytesSent>[0-9]+) "(?P<httpReferer>[^"]+)" "(?P<httpUserAgent>[^"]+)"

Results

{ 
  "remoteUser" : "dbmanager" , 
  "request" : "GET / HTTP/1.1" ,
  "bodyBytesSent" : "188" , 
  "remoteAdd" : "127.0.0.1" , 
  "httpUserAgent" : "Mozilla/5.0 (X11; Ubuntu; Linux x86_64; rv:47.0) Gecko/20100101
   Firefox/47.0" ,  
  "httpReferer" : "-" , 
  "timestamp" : "20/Nov/2017:18:52:17 +0000" ,
  "status" : "401"
}

9. MySQL (Use a “Parse” rule in Coralogix):

https://regex101.com/r/NjtRLZ/4

Sample Log

2018-03-31T15:38:44.521650Z 2356 Query SELECT c FROM sbtest1 WHERE id=164802

Regular Expression

(?P<timestamp>[0-9]{4}-[0-9]{2}-[0-9]{2}T[0-9]{2}:[0-9]{2}:[0-9]{2}.[0-9]{6}Z) ? ? ? ? ? ?(?P<connID>[0-9]+) (?P<name>[a-zA-Z]+) (?P<sqltext>[^n]+)

Results

{
“sqltext” : “SELECT c FROM sbtest1 WHERE id=164802” ,
“name” : “Query” ,
“connID” : “2356” ,
“timestamp” : “2018-03-31T15:38:44.521650Z”
}

10. ALB (Use a “Parse” rule in Coralogix):

https://regex101.com/r/NjtRLZ/4

Sample Log

2018-03-31T15:38:44.521650Z 2356 Query SELECT c FROM sbtest1 WHERE id=164802 http 2018-11-30T22:23:00.186641Z app/my-loadbalancer/50dc6c495c0c9188 192.168.131.39:2817 - 0.000 0.001 0.000 502 - 34 366 "GET https://www.example.com:80/ HTTP/1.1" "curl/7.46.0" - - arn:aws:elasticloadbalancing:us-east-2:123456789012:targetgroup/my-targets/73e2d6bc24d8a067 "Root=1-58337364-23a8c76965a2ef7629b185e3" "-" "-" 0 2018-11-30T22:22:48.364000Z "forward" "-" "LambdaInvalidResponse"

Regular Expression

(?P<type>[a-z0-9]{2,5}) (?P<timestamp>[0-9]{4}-[0-9]{2}-[0-9]{2}T[0-9]{2}:[0-9]{2}:[0-9]{2}.[0-9]{6}Z) (?P<elb>[^n]+) ? ?(?P<clientPort>[0-9.:-]+) (?P<targetPort>[0-9.:-]+) (?P<requestProcessTime>[0-9.:]+) (?P<targetProcessTime>[0-9.:-]+) (?P<responseProcessingTime>[0-9.:-]+) (?P<elbStatusCode>[0-9-]+) (?P<targetStatus>[0-9-]+) (?P<recievedBytes>[0-9-]+) (?P<sentBytes>[0-9-]+) ? ?"(?P<request>[^"]+)" "(?P<userAgent>[^"]+)" (?P<sslCipher>[^ ]+) (?P<sslProtocol>[^n]+) ? ?(?P<targetGroupArn>[^n]+) ? ?"(?P<traceID>[^"]+)" "(?P<domainName>[^"]+)" "(?P<chosenCertArn>[^"]+)" ? ?(?P<matchedRulePriority>[^ ]+) (?P<requestCreationTime>[0-9]{4}-[0-9]{2}-[0-9]{2}T[0-9]{2}:[0-9]{2}:[0-9]{2}.[0-9]{6}Z) "(?P<actionsExecuted>[^"]+)" "(?P<redirectURL>[^"]+)" "(?P<errorReason>[^"]+)"

Results

{

“traceID” : “Root=1-58337364-23a8c76965a2ef7629b185e3” ,
“request” : “GET https://www.example.com:80/ HTTP/1.1” ,
“requestCreationTime” : “2018-11-30T22:22:48.364000Z” ,
“redirectURL” : “-” , “targetGroupArn” : ” ” ,
“type” : “http” , “targetPort” : “-” ,
“responseProcessingTime” : “0.000” ,
“targetProcessTime” : “0.001” ,
“chosenCertArn” : “-” ,
“errorReason” : “LambdaInvalidResponse” ,
“matchedRulePriority” : “0” ,
“actionsExecuted” : “forward” ,
“clientPort” : “7” ,
“elb” : “app/my-loadbalancer/50dc6c495c0c9188 192.168.131.39:281” ,
“targetStatus” : “-” ,
“recievedBytes” : “34” ,
“timestamp” : “2018-11-30T22:23:00.186641Z” ,
“sslCipher” : “-” ,
“userAgent” : “curl/7.46.0” ,
“requestProcessTime” : “0.000” ,
“domainName” : “-” ,
“elbStatusCode” : “502” ,
“sslProtocol” : “- arn:aws:elasticloadbalancing:us-east-2:123456789012:targetgroup/my-targets/73e2d6bc24d8a067” ,          “sentBytes” : “366”
}

11. IIS (Use a “Parse” rule in Coralogix):

https://regex101.com/r/ytJdyE/2

Sample Log

192.168.114.201, -, 03/20/05, 7:55:20, W3SVC2, SERVER, 172.21.13.45, 4502, 163, 3223, 200, 0, GET, /DeptLogo.gif, -,

Regular Expression

(?P<clientIP>[0-9]{1,3}.[0-9]{1,3}.[0-9]{1,3}.[0-9]{1,3}), (?P<userName>[^,]+), (?P<timestamp>[[0-9]{2}/[0-9]{2}/[0-9]{2}, [0-9]{1,2}:[0-9]{1,2}:[0-9]{1,2}), (?P<serviceInstance>[^,]+), (?P<serverName>[^,]+), (?P<serverIP>[0-9]{1,3}.[0-9]{1,3}.[0-9]{1,3}.[0-9]{1,3}), (?P<timeTaken>[^,]+), (?P<clientBytesSent>[^,]+), (?P<serverBytesSent>[^,]+), (?P<serviceStatusCode>[^,]+), (?P<windowsStatusCode>[^,]+), (?P<requestType>[^,]+), (?P<targetOfOperation>[^,]+), (?P<parameters>[^,]+),

Results

{
“requestType” : “GET” ,
“windowsStatusCode” : “0” ,
“serverName” : “SERVER” ,
“userName” : “-” ,
“timeTaken” : “4502” ,
“serverBytesSent” : “3223” ,
“clientIP” : “192.168.114.201” ,
“serverIP” : “172.21.13.45” ,
“serviceInstance” : “W3SVC2” ,
“parameters” : “-” ,
“targetOfOperation” : “/DeptLogo.gif” ,
“serviceStatusCode” : “200” ,
“clientBytesSent” : “163” ,
“timestamp” : “03/20/05, 7:55:20”
}

12. Apache (Use a “Parse” rule in Coralogix):

https://regex101.com/r/2pwM6J/1

Sample Log

127.0.0.1 – frank [10/Oct/2000:13:55:36 -0700] “GET /apache_pb.gif HTTP/1.0” 200 2326

Regular Expression

(?P<clientIP>[0-9]{1,3}.[0-9]{1,3}.[0-9]{1,3}.[0-9]{1,3}) (?P<identd>[^ ]+) (?P<userid>[^ ]+) [(?P<timesptamp>[^]]+)] "(?P<request>[^"]+)" (?P<statusCode>[^ ]+) (?P<objectSize>[^ ]+)

Results

{
“request” : “GET /apache_pb.gif HTTP/1.0” ,
“timesptamp” : “10/Oct/2000:13:55:36 -0700” ,
“objectSize” : “2326” ,
“clientIP” : “127.0.0.1” ,
“identd” : “-” ,
“userid” : “frank” ,
“statusCode” : “200”
}