Sumo Logic vs Splunk vs ELK: Which is Best?

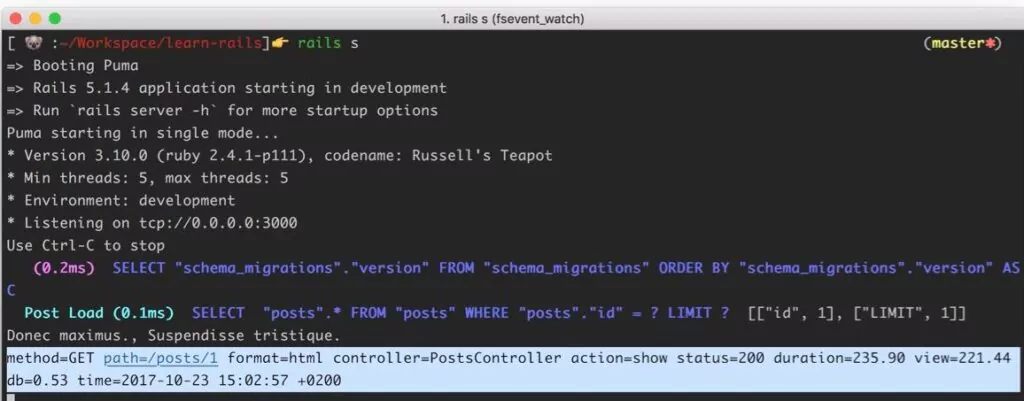
From production monitoring to security concerns, it’s critical for businesses to analyze and review their log data. This is particularly true for large and enterprise companies, where the sheer amount of data makes log analysis the most efficient way to track key indicators. CTOs, in particular, are dealing with the challenges of this massive amount of data flowing through their organization, including how to harness it, gather insights from it, and secure it.

When it comes to the best platforms for log analysis and security information and event management (SIEM) solutions, 3 trivial Elk Stack alternatives come up: Splunk, Sumo Logic, and ELK.

Choosing which of these big guns to go with is no easy task. We’ll look at these top three platforms, including their advantages and disadvantages, and see who comes out the winner.
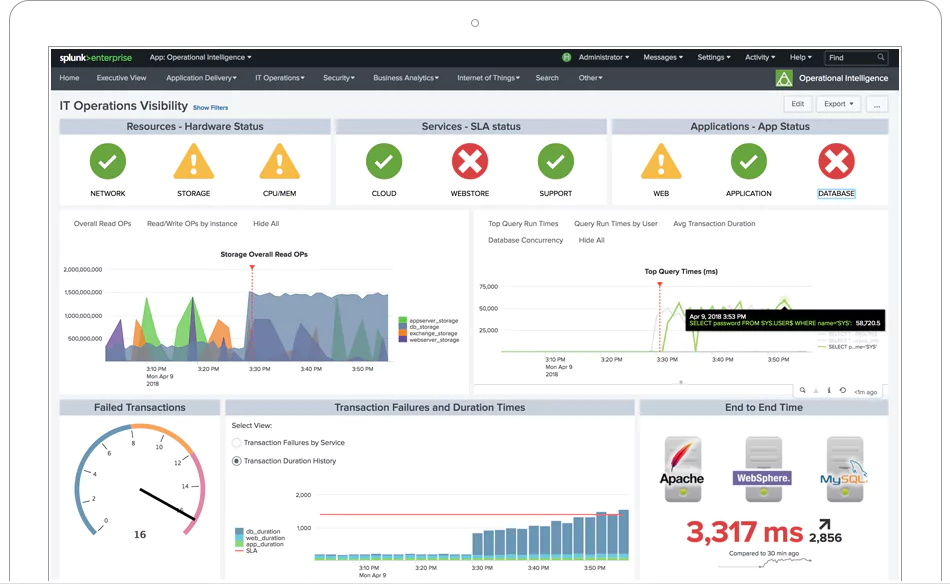
What is Splunk?

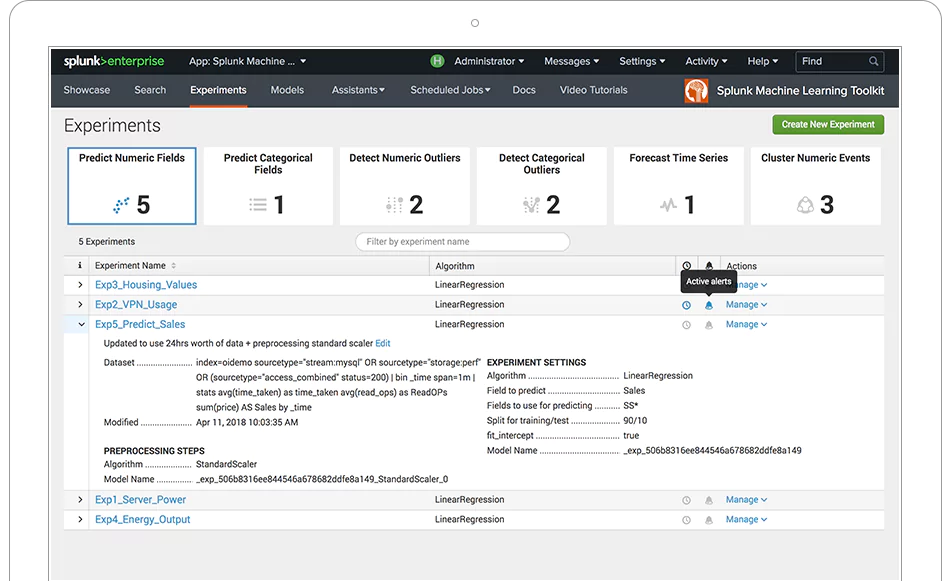
Splunk Enterprise is a platform to aggregate and analyze data. With Splunk, you can automate the collection, indexing, monitoring, and alerting functions when it comes to your data to control and leverage the information flowing into your business.

Scheduled searches let you create real-time dashboards and visualizations (offering both XML and drag-and-drop style customization options for visualization), while scheduled reports enable you to run and share reports at various intervals. In terms of support and community, Splunk hosts Splunkbase, which has thousands of apps and add-ons.


Splunk

The platform has the functionality to be used by experts as well less technically-inclined users. It scales well – with the ability to scale up to unlimited amounts of data per day – and has built-in failover and disaster recovery capabilities.

In addition to the self-hosted Splunk Enterprise, there is also the Splunk Cloud option, where Splunk is deployed and managed as a service.

Splunk dashbaord


The pros of Splunk

Splunk is good at what it does, which is primarily fast consolidation of logs to be able to search data and find insights.

The cons of Splunk

The biggest concern with Splunk is the complexity of setting it up and maintaining it. It has a relatively steep learning curve and can take time to get going properly and manage on an ongoing basis. The other major issue to be aware of is pricing, which can be quite high.

Understanding Splunk’s pricing 

Splunk Enterprise starts at $173 per ingested GB, is quoted per month. It is billed annually, and includes standard (not premium, though this is available) support.
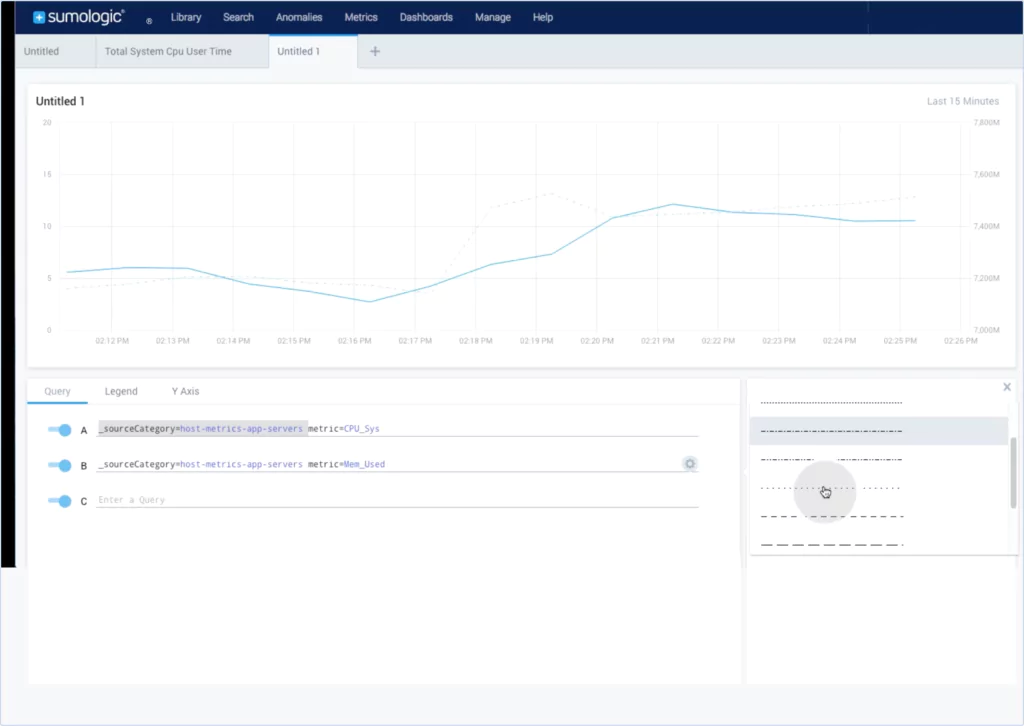
What is Sumo Logic?

Sumo Logic is a cloud-native, machine data analytics service for log management and time series metrics. With the service, you can build, run and secure your AWS, Azure, Google Cloud Platform, or hybrid applications. 

How does Sumo Logic compare with Splunk?

The biggest difference when compared with Splunk is that Sumo Logic is built for the cloud; even though Splunk now offers its Splunk cloud option, Sumo Logic’s architecture is built around cloud usage. 

This means integrations are smoother, particularly when it comes to platforms such as AWS; scalability is built-in, there is no need for constant updates, and getting started is quicker and easier than with Splunk.

SumoLogic visualization


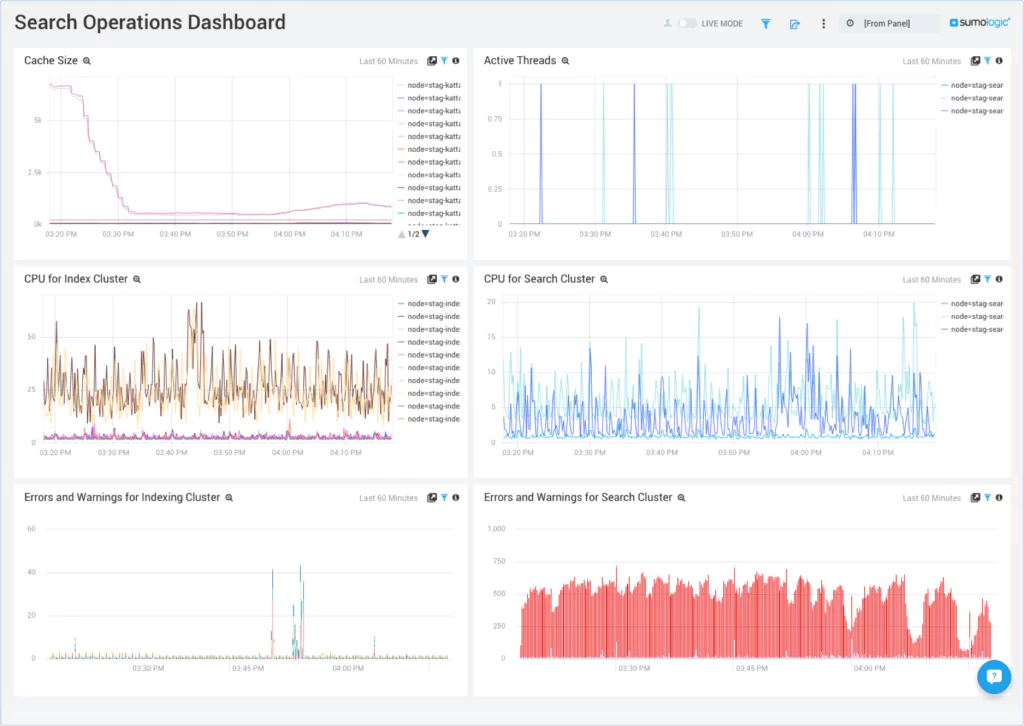
The pros of Sumo Logic 

Sumo Logic is easy to use and has all the advantages of being a SaaS solution, such as scalability, getting up and running quickly, and so on. Some people like the UI, while others prefer the other offerings’ look and feel.

The cons of Sumo Logic

Sumo Logic lacks some of the extended features of Splunk, particularly when it comes to the Splunk Enterprise offering. There have been complaints about Sumo Logic’s speeds when searching older data, its customer service, and its pricing being on the expensive side. Sumo Logic also lacks some of the community support of Splunk and particularly ELK.


Sumologic dashboard


Understanding Sumo Logic pricing

The Sumo Logic Enterprise platform starts at $150 per GB per month, with an annual commitment required. If you want the full support package, it’s an optional add-on to this package.

What is ELK?

ELK is the world’s most popular log management platform. The ELK Stack is made up of three different solutions, all of them open-source: Elasticsearch, Logstash, and Kibana.

Elasticsearch is a search engine based on Lucene that provides a distributed, multitenant-capable full-text search engine with an HTTP web interface and schema-free JSON documents. Logstash collects, parses, and stores logs, and Kibana is a data visualization tool. Also included as part of the stack is Beats, a platform for lightweight shippers that sends data from edge machines to Logstash and Elasticsearch. With the addition of Beats, ELK Stack became known as the Elastic Stack.


Kibana visualizations


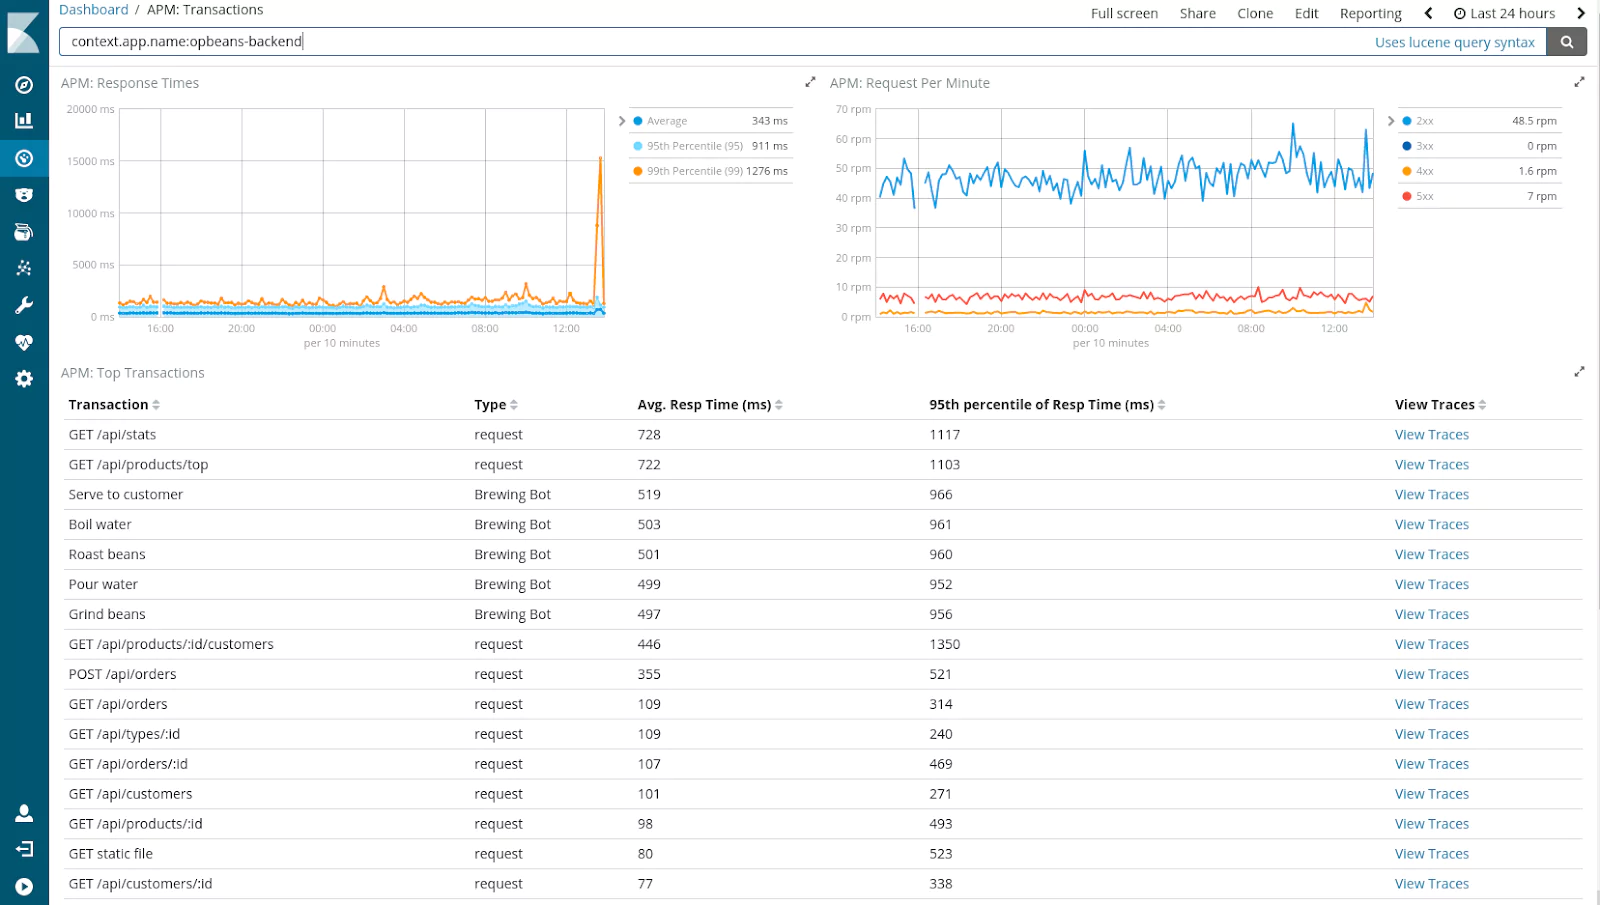
With ELK, you can reliably and securely ingest data from any source, in any format and search, analyze, and visualize it in real-time. Being open source, it’s been rigorously tested by the large ELK community and is trusted by companies such as Sprint, Microsoft, eBay, and Facebook.

The pros of ELK 

ELK consolidates three mature components to form one powerful solution. Being an open source tool, there are numerous benefits that come with the adoption of ELK. In general, there has been a tremendous movement towards open source, particularly for enterprises. 

Open source solutions come with a lot of control, where you aren’t tied to a rigid way of doing things, and open source tools, especially ones like ELK/Elastic Stack, bring with them a vibrant community of contributors, testers, and fellow users who can contribute to your success.

The cons of ELK

If you are setting up yourself, it can be challenging to set up and maintain. Most users go with a solution that handles the setup for them.

Understanding ELK’s pricing

ELK is free (if you are using the open source version without X-pack).

Which platform is the best?

Given our significant combined experience with all of these platforms, deciding which one to pick had to be carefully weighed up. The functionality and feature set of Splunk, the simplicity and cloud-native advantages of Sumo Logic, and the open source design and robust nature of ELK.

A winner had to be chosen, and based on all of our research and experience, it had to be ELK – thanks to its vibrant community, the fact that it’s constantly improving and evolving faster than its competitors, has better JSON format support, is easier to use and get started with, and of course, comes in at a much lower price.

This is despite its drawbacks – the standard versions of it lack alerting, anomaly detection, and integrations into the development lifecycle – overall, however, it stands above the others as an all-round tool.

Being on top of your logs is critical, whether it’s for production monitoring and debugging, security purposes, resource usage, or any other of the multitude of key business functions log analysis supports.

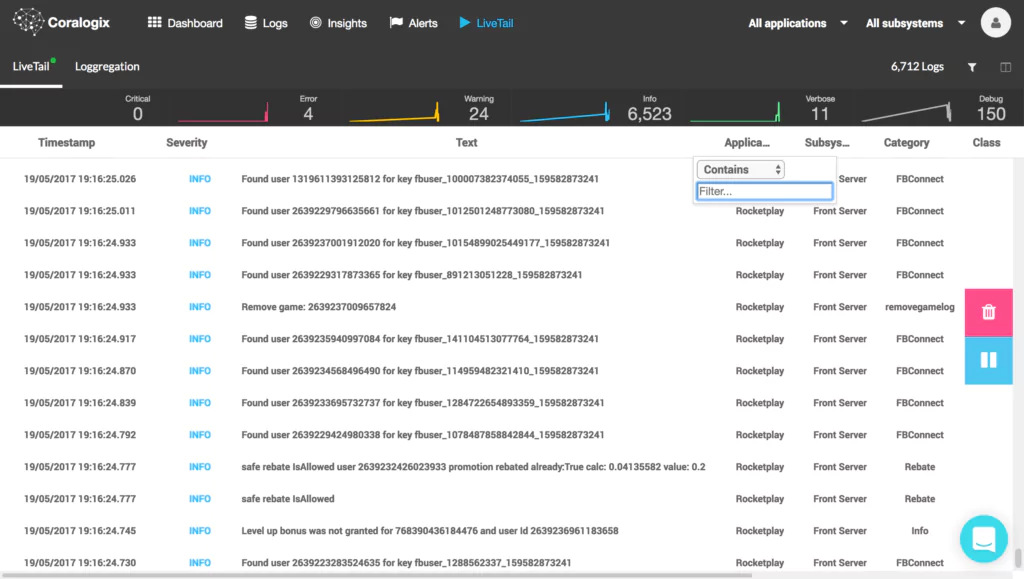
With Coralogix’s platform, you can know when your flows break, automatically cluster your log data back into its original patterns so you can view hours of data in seconds, see all of your organization’s key indicators at a glance, and a whole lot more. 

Interested in finding out more about how your organization can benefit? Check out Coralogix to see how we can help.

(This article was updated in August 2023)

Ruby logging best practices and tips

Ruby is an opinionated language with inbuilt Ruby logging monitoring options that will serve the needs of small and basic applications. Whilst there are fewer alternatives to these than say, the JavaScript world, there are a handful, and in this post, I will highlight those that are active (based on age and commit activity) and help you figure out the options for logging your Ruby (and Rails applications).

Before proceeding, take note that this article was written using Rails v4.x; later versions of Rails may not be supported.

Best logging practices – general

Before deciding what tool works best for you, following broad logging best practices will also apply to Ruby logging and will help make anything you do log more useful when trying to track down a problem. Read “The Most Important Things to Log in Your Application Software” and the introduction of “JAVA logging – how to do it right” for more details, but in summary, these rules are:

  • Enable logging: This sounds obvious, but double check you have enabled logging (in whatever tool you use) before deploying your application and don’t solely rely on your infrastructure logging.
  • Categorize your logs: As an application grows in usage, the quantity of logs it generates will grow and the ability to filter logs to particular categories or error levels such as authorization, access, or critical can help you drill down into a barrage of information.
  • Logs are for everyone: Your logs are useful sources of information for a variety of stakeholders including support and QA engineers, and new programmers on your team. Keep them readable, understandable and with a clear purpose.

Inbuilt options

Ruby ships with two inbuilt methods for logging application flow, puts, most suited to command line applications, and logger, for larger, more complex applications.

puts takes one parameter, the object(s) you want to output to stdout, with each item outputting to a new line:

puts(@post.name, @post.title)

logger provides a lot of options for an inbuilt class, and Rails enables it by default.

logger.info #{@post.name}, #{@post.title}

The logger class provides all the log information you typically see when running Rails. You can set levels with each message, and log messages above a certain level.

require ‘logger’
logger = Logger.new(STDOUT)
logger.level = Logger::WARN

logger.debug(“No output”)
logger.info(“No output”)
logger.warn(“Output”)
logger.fatal(“Output”)

Logger doesn’t escape or sanitize output, so remember to handle that yourself. For details on how to do this, and create other forms of custom loggers and message formatters, read the official docs

Taming logger with Lograge

Whilst many Rails developers find it’s default logging options essential during development, in production, it can be noisy, overwhelming, and at worst, unhelpful. Lograge attempts to reduce this noise to more salient and useful information, and into a format that is less human-readable, but is more useful to external logging systems if you use its JSON formatted output option.

There are many ways you can initialize and configure the Gem, I stuck to the simplest, by creating a file in config/initializers/lograge.rb with the following content:

Rails.application.configure do
  config.lograge.enabled = true
end

Which changes the output to this.

ruby logging best practices

Lograge output

Unsurprisingly there are a lot of configuration options to tweak the logging output to suit you based on values available in the logging event. For example to add a timestamp:

Rails.application.configure do
  config.lograge.enabled = true

  config.lograge.custom_options = lambda do |event|
    { time: event }
  end
end

You can also add custom payloads into the logging information for accessing application controller methods such as request and current_user.

config.lograge.custom_payload do |controller|
  {
    # key_name: controller.request.*,
    # key_name: controller.current_user.*
    # etc…
  }
end

If adding all this information already feels counter to the point of lograge, then it also gives the ability to remove information based on certain criteria. For example:

config.lograge.ignore_actions = [‘PostsController#index’, ‘VisitorsController#new’]
  config.lograge.ignore_custom = lambda do |event|
    # return true if you want to ignore based on the event
  end

Logging with logging

Drawing inspiration from Java’s log4j library, logging offers similar functionality to the inbuilt logger, but adds hierarchical logging, custom level names, multiple output destinations and more.

require ‘logging’

logger = Logging.logger(STDOUT)
logger.level = :warn

logger.debug “No output”
logger.warn “output”
logger.fatal “output”

Or to create custom loggers that output to different locations and assigned to different classes.

require ‘logging’

Logging.logger[‘ImportantClass’].level = :warn
Logging.logger[‘NotSoImportantClass’].level = :debug

Logging.logger[‘ImportantClass’].add_appenders
    Logging.appenders.stdout,
    Logging.appenders.file(‘example.log’)

class ImportantClass
  logger.debug “I will log to a file”
end

class  NotSoImportantClass
  logger.debug “I will log to stdout”
end

Next Generation Logging with Semantic Logger

One of the more recent projects on this list, semantic_logger aims to support high availability applications and offers a comprehensive list of logging destinations out of the box. If you are using Rails, then instead use the rails_semantic_logger gem that overrides the Rails logger with itself. There are a lot of configuration options, where you can sort log levels, tags, log format, and much more. For example:

config.log_level = :info

# Send to Elasticsearch
SemanticLogger.add_appender(
  appender: :elasticsearch,
  url:      ‘https://localhost:9200’
)

config.log_tags = {
  #  key_name: :value,
  #  key_name:       -> request { request.object[‘value’] }
 }

Logging to external services

With all the above options you will still need to parse, process and understand your logs somehow, and numerous open source and commercial services can help you do this (open your favorite search engine and you’ll find lots), I’ll highlight those that support Ruby well.

If you’re a fluentd user, then there’s a Ruby gem that offers different ways to send your log data. If you’re a Kibana user, then Elastic offers a gem that integrates with the whole ELK stack.

Papertrail has a gem that extends the default logger to send logs to their remote endpoint. They haven’t updated it in a while, but it still their official solution, so should work, and if it doesn’t they offer an alternative method.

Loggly uses lograge and some custom configuration to send logs data to their service.

And for any Airbrake users, the company also offers a gem for direct integration into their service.

There are also a handful of gems that send the default ruby logs to syslog, which then enables you to send your logging data to a large amount of external open source and commercial logging services.

And of course, Coralogix’ own package allows you to create different loggers, assign a log level to them and other useful metadata. In addition to all standard logging features, such as flexible log querying, email alerts, centralized live tail, and a fully hosted Kibana, Coralogix provides machine learning powered anomaly detection in the context of software builds.

Another benefit is that Coralogix is the only solution which offers straightforward pricing, all packages include all features.

First, create an initializer in initializers/coralogix.rb with your account details, set a default class and extend the default Rails logger:

require ‘coralogix_logger’
PRIVATE_KEY = “<PRIVATE_KEY>”
APP_NAME = “Ruby Rails Tester”
SUB_SYSTEM = “Ruby Rails Tester Sub System”

*Private key is received upon registration, **Application name separates environments, ***Subsystem name separates components.

Coralogix::CoralogixLogger.configure(PRIVATE_KEY, APP_NAME, SUB_SYSTEM)
Rails.application.config.coralogix_logger =
Coralogix::CoralogixLogger.get_logger(“feed-service”)
Rails.logger.extend(ActiveSupport::Logger.broadcast(Rails.application.config.coralogix_logger))

And then in each class, we recommend you get an instance of the logger in each class and set the logger name to the class name, which Coralogix will use as the category. The log() method offers options to tailor the logging precision, but the severity and message are mandatory:

logger = Coralogix::CoralogixLogger.get_logger(“Posts Controller”)
logger.log(Coralogix::Severity::VERBOSE, “Post created #{post.inspect})

You can also use severity methods if you prefer, where only the message is mandatory, but other options are available:

logger.verbose(“Post created #{post.inspect})

And there you have it:

Coralogix logs stream

Know your Code

Whilst Ruby and Rails lack the ‘cool factor’ they had in the past, depending on where you look it still claims the 5th most used language (it peaked at 4th place in 2013 anyway), 12th place in the IEEE spectrum and 4th place on GitHub. It’s still a relevant, and widely used language, especially on certain platforms, such as web backends and Heroku. This means your code should be as optimized as possible. And of course, your Ruby logging/Rails logging should be as organized as possible. I hope this post will help you track down the source of potential problems in the future.

Top 4 Logging Problems You Have Probably Faced and how to fix them

Machine data is growing at a fast pace, which presents significant problems. By definition, it is not readily available to be analyzed, but we are here to help you out and fix that problem. First, let’s see what the 4 main issues are:

Logging Problem #1 – You just can’t analyze!

Logs to almost everyone are a pile of Crap Big Data that nobody wants to touch, and everyone hopes will magically analyze themselves. But it just doesn’t work that way. Extracting key metrics or trends in your system is like finding a needle in a haystack if you don’t have the right log monitoring tools.

In the past tools have tried to help Mr. IT get a grip on the behemoth of Data, but he only usually got a simple or very complex search and retrieved query, which is great, if you know what you are looking for. You often don’t even know something is wrong. What about troubleshooting? Let’s take this one step further – what about troubleshooting before the problem arises? The answer, soon…

Logging Problem #2 – Key Events, Where are you???

As mentioned above, knowing what to look for is the issue, if not the biggest problem in log management. You can be the king of all query languages but if you don’t know what you are looking for you might as well throw darts at a wallpaper of printed out logs. Even if you do have alerts it wouldn’t matter because they were created by someone that found a bug once a million years ago, but what about the one that is happening right now? (Relax, there aren’t any bugs in your system right now… or are there?)
Again, the answer will soon be revealed.

Logging Problem #3 – Correlating your Data

Correlation is a Log management nightmare. Splunk, Elastic, and other log management companies shove everything into one big pile, and you are expected to know how to navigate between an immense amount of data. Rainbows and unicorns, yeah right… There is a solution that finds correlations for you, even if you didn’t even know one existed. Read a little more, and you’ll get there (Yes we know we are repeating ourselves).

Logging Problem #4 – Data Normalization at Collection stage

A lot of log data is unstructured or maybe if you are lucky, is somewhat structured. The challenge of creating a system, or using one, which normalizes and analyzes in a way that anybody can read is not only impossible but seems like it can’t exist.

Well, I hate to bust your bubble, but the solution doesn’t only exist, but you are actually reading this blog post on a company blog that takes care of all these issues and more.

If you are looking for a Log management solution that aggregates, analyzes and uses AI to find and solve data related problems, you’ve come to the right place.

The problems below won’t be an issue for you anymore:

  • Being notified in real time on suspicious log flows
  • Analyzing and querying huge amounts of data in seconds
  • Automatic clustering of logs back into their patterns
  • Correlation of logs from various sources

To learn more about making your life or your IT’s life much easier saving time and money, join us!

Java Logging Guide: How To Do It Right

Log monitoring is something you want to plan and standardize before you start writing your code, especially if it involves different teams or separate locations.

During the last couple of years, we witnessed the strong connection between quality and standardized logging and the ability to track and resolve production problems.

In this post, we will focus on a few lessons we’ve learned about Java logging and how to do it right.

What is Java logging? 

Java logging, commonly known as logging, serves a crucial role in undetstanding system performance and identifying the root causes of failures. It aids the analysis of program executions by keeping a record of events, which makes it invaluable for tasks such as auditing and debugging.

However, it’s important to note that logging does not occur automatically. Developers must proactively implement logging rules to ensure they can effectively manage the logging process.

9 tips for effective Java logging Setting up your logging correctly is crucial for the future and can help you get the most from your logging. Here are some tips and Java logging best practices to get you started:

9 tips for effective Java logging

Setting up your logging correctly is crucial for the future and can help you get the most from your logging. Here are some tips and Java logging best practices to get you started:

1) Set your log severity right

Many times, too often actually,  we see a complete log file written with the same log severity. This makes your logs harder to understand and hides the important logs you want to notice.

To make it easier for you to decide what severity to set for each log, here are some simple log severity guidelines:

  • Debug/Verbose: Logs that are mainly used by the developers and contain data such as response times, health checks, queues status etc. An example for a debug log would be “Number of messages in the user creation queue = 3482”
  • Info: Business processes and transactions, these logs should be readable for QA, Support and even advanced users to understand the system’s behavior. An example of an info log will contain data on a product purchase on your e-commerce platform, a user creation on your social media or a successful batch process on your data analytics solution.
  • Warning: These logs mean something unusual happened or something isn’t right, but it does not necessarily mean that anything failed or the user will notice a problem. An example of a warning would be “Received illegal character for username – “Jame$” , ignoring char”  
  • Error: A problem that must be investigated; use the Error severity to log Disconnections, failed tasks or failures that reflect to your users. If you see an error in your log that does not require immediate investigation, you should probably lower its severity.
  • Critical/Fatal: Something terrible happened, stop everything and handle it,. This could beCrashes, Serious latency or performance issues, security problems. All these must be logged with the log severity Critical.

2) Remember you will not be the only one reading these logs

When writing your application logs, remember that besides you, other people will read these logs. Whether it’s programmers, QA or support consuming the logs you wrote, they better be clear and informative. 

On the other hand, logs that are long and detailed can be hard to parse automatically (grep, awk, etc.), so either you find a way to write a clear log that can also be parsed easily, or you can simply print two logs, one for humans and one for computers:

E.g – Print these two logs together, the first log for humans and the second for computers:

  • “transaction was completed successfully” + transactionID “total time for transaction =” + TimeElapsed
  • “success” + transactionID  “time” + TimeElapsed

3) Track your communication with other systems

Integration issues can be the hardest to debug; our suggestion is that you log every event that comes in/out of your system to an external system, whether it is HTTP headers, authentications, keep alive, etc.

In complex and high scale systems this can be a performance overhead, but in case you experience performance issues, you can always switch off the logging for that particular log level (usually Debug or Trace) and use it when something goes wrong with your production.

4) Add metadata to your logs

Often, programmers write great log text and severity but forget to add the log metadata such as Category, Class, method or threadID. 

Adding metadata to your logs can significantly enhance your capability of pinpointing production problems as you can search and identify problematic categories, classes or methods or follow a thread to understand the root cause of an error you see. The more metadata you add, the better your log is.

5) Use a logging API

Logging APIs make it much easier to add log destinations and integrate with logging tools seamlessly and without any code modifications. In addition, they make your logs more clear by standardizing them and enriching them with metadata fields such as thread ID.

The two most common logging API’s for Java are Log4J and Logback (slf4j).

Note that one of the greatest benefits of Log4J and Logback is that they allow you to send logs from any Java-based Apache project easily! (Kafka, Hazelcast, etc.)

A Logback log will be written in the following structure:

log.warning(“Retried {} times before succeeding to create user: ‘{}’”, retries, username);

The same log in Log4J would be:

log.warning(“retried” + retries + “times before succeeding to create user” + username);

6) Make sure you know what you are logging

When writing logs, especially when calling functions and variables within that log, make sure you understand what will be the outcome of that print. Bad logs can be:

  • inconsistent – values that arrive NULL or with different data types
  • Too long – Printing a list of URLs that is impossible to read or printing HEX values, for instance
  • Null – printing logs that rely on a variable that may or may not have content, for instance: log.error(monitor.get_ERR_reason)

7) Don’t write huge logs

It’s great to write detailed and descriptive logs, but many times we see single log entries with an enormous amount of characters (20K+) as the logs are used to store data that is completely unrelated to logs and should be managed separately. This can cause serious performance issues when writing logs to your disk and create bandwidth issues when using hosted logging solutions.  

Remember what the is the main purpose of your logs and stick to it. You want clear logs that tell the story of your software for you to understand its behavior and be able to debug it.

8) Log exceptions correctly

We all probably agree that reporting exceptions is a crucial part of the logging process. On that basis, some tend to both report the exception and then wrap it with their own custom exception and throw it again. This will probably cause the stack trace to be printed twice, a fact that will most likely cause confusion. We suggest never to report and re-throw, decide what works for you best and stick to it. 

We generally recommend throwing the exception with your own custom exception and catching them all in a centralized handler which will log them and handle any other activities that are needed.

Here are some examples of Java exception logging:

BAD:

try {

   Integer x = null;

   ++x;

} catch (Exception e) {

log.error(“IO exception”, e);

throw new MyCustomException(e);

}

BETTER:

try {

   Integer x = null;

   ++x;

} catch (Exception e) {

log.error(“IO exception”, e);

}

BEST:

try {

   Integer x = null;

   ++x;

} catch (Exception e) {

throw new MyCustomException(e);

}

As a rule of thumb, let the logging framework you are using help you log exceptions and don’t do it yourself. Remember, the first argument is always the text message; write something about the nature of the problem. 

Don’t include the exception message, as it will be printed automatically after the log statement preceding the stack trace. But to do so, you must pass the exception itself as the second argument; other logging standards will most likely cause the message to be printed wrongly.

BAD:

log.error(e);

log.error(e, e);  

log.error(“” + e);

log.error(e.toString());  

log.error(e.getMessage());

log.error(null, e);

log.error(“”, e);

log.error(“{}”, e);

log.error(“{}”, e.getMessage());

log.error(“Error reading configuration file: ” + e);

log.error(“Error reading configuration file: ” + e.getMessage());

GOOD:

log.error(“Error reading configuration file”, e);

9) Use an ID to track your events

This method will allow you to easily filter or search for a specific event that you want to track. The idea is that whoever is responsible for creating an event (e.g. client, worker etc) generates a unique ID that is passed through all functions and service calls that are used to process that event. Then once an exception or error occurs, it is simple to take the event ID from that error and query for its history throughout the different functions, services and components.

Closing thoughts

In the Java logging community, there are many logging methods that exist, which presents developers with a plethora of options to choose based on their specific needs and requirements. 

The selection of an appropriate logging approach can massively impact the effectiveness and efficiency of the logging process. The choice ultimately depends on the complexity of the project, the desired level of customisation, and the need for compatiability with existing systems. 

By following our tips above, you can create a well-executed logging strategy that can factilitate system monitoring and debugging, whilst enhancing the maintainability and staibility of Java applications.

(This blog post was updated August 2023)

How to Leverage Your Log Analytics

Here at Coralogix, we’ve mentioned before how log analytics has increasingly been gaining attention and is creating a way to cut back on software maintenance costs. In this post, we want to expand on the ways that Log Analytics can benefit the developers.

Let’s look at three facts about the growing trends of general Big Data Analytics for 2015:

1) Analytics and Business Intelligence Standardization is declining
Companies using Big Data Analytics tools are straying away from the known management tools, from a standardization of 35% in 2014 to 28% in 2015

2) Cloud-based data warehousing is on the rise
Cloud-based data warehousing services showed the biggest increase jumping to 34% in 2015 from 24% in 2014

3) Real-time technology is seeing real gains
With the development of complex event processing (CEP), mainly in the realms of financial services, security, telco, and intelligence agencies

Taking these factors into consideration, it is evident that log analytics is going places this year, and developers can benefit greatly from it. Not only will these tools and services help enrich the platform for logging, but they also can benefit in identifying bugs quicker. Saying that, we’ve come up with eight ways the developers can have greater insights and advantages from using log analytics.

1) Log Trigger Events: Log critical actions, such as user activity. This data can later be related to user cohorts for marketing, product management, and growth activity purposes. But also for the developers to optimize user flow.

2) Run Duration for Bigger Processes: For larger processes, intensive or lengthy application processes, log start and stop times. It can be correlated to pegged servers outages or load issue if they arise. This data can help to identify areas where the product is slow to respond or issues of application processes affecting infrastructure.

3) Log Deprecated Functionality: When a deprecated functionality is called, log it so the team can be alerted. This will help QA and Development know when other team members are using outdated classes by accidents.

4) Log Flag Changes: Some developers like to use flags in their code to indicate different states. Create a function for changing flags so that it is logged and clear when flags are off or on. This allows the response or alerting of when a particular flag that should have been renamed on in production.

5) Log Component Usage: Applications are a treasure pile of 3rd party component libraries. These libraries pose a risk when they are not monitored. For all the components used, it’s nice to log their usage – components name and version. There is a downside as this can be very chatty if not designed well. And it has to be by some real component tracking process outside of the collection, and from the insights.

The last three benefit the developers and their teams:

1) Standardize your log severity: an organization needs to have a standard for log severity. So that when a log is “Critical”/“Error” it is clear to the developer that there is a problem and on the other hand if you decide to log everything above information level you’d want information not to contain Debug level logs.

2) Aggregate your log data: each log resembles an action on your system, but the same log that is created by the same line of code can be generated millions of times a day with different variables (e.g., ‘User ID xxxxxxx logged in’). To see the logs that matter to you and not get lost in millions of identical logs, you need to have an easy option to aggregate logs by their log templates.

3) Decide on an alert policy: What events should be alerted, who should be notified, what alerts require an Email/SMS notifications. All these will make your life much more easy and clear with a focal point to each issue that is brought up.

Coralogix brings a new actionable approach to the Log Analytics & Management. By analyzing every log that is generated by the software, Coralogix learns the system’s flow, automatically detects broken Log patterns, and provides their root cause in a single click. Coralogix finds the patterns of broken vs. correct behavior and returns a few log entries, which is a lot more manageable than the millions of log entries that Log Analytics users have to deal with today.