What to Consider When Monitoring Hybrid Cloud Architecture

Hybrid cloud architectures provide the flexibility to utilize both public and cloud environments in the same infrastructure. This enables scalability and power that is easy and cost-effective to leverage. However, an ecosystem containing components with dependencies layered across multiple clouds has its own unique challenges.

Adopting a hybrid log monitoring strategy doesn’t mean you need to start from scratch, but it does require a shift in focus and some additional considerations. You don’t need to reinvent the wheel as much as realign it.

In this article, we’ll take a look at what to consider when building a CDN monitoring stack or solution for a hybrid cloud environment.

Hybrid Problems Need Hybrid Solutions

Modern architectures are complex and fluid with rapid deployments and continuous integration of new components. This makes system management an arduous task, especially if your engineers and admins can’t rely on an efficient monitoring stack. Moving to a hybrid cloud architecture without overhauling your monitoring tools will only complicate this further, making the process disjointed and stressful.

Fortunately, there are many tools available for creating a monitoring stack that provides visibility in a hybrid cloud environment. With the right solutions implemented, you can unlock the astounding potential of infrastructures based in multiple cloud environments.

Mirroring Cloud Traffic On-Premise

When implementing your hybrid monitoring stack, covering blind spots is a top priority. This is true for any visibility-focused engineering, but blind spots are especially problematic in distributed systems. It’s difficult to trace and isolate root causes of performance issues with data flowing across multiple environments. Doubly so if some of those environments are dark to your central monitoring stack.

One way to overcome this is to mirror all traffic to/between external clouds to your on-premise environment. Using a vTAP (short for virtual tap), capture and copy data flowing between cloud components and feed the ‘mirrored’ data into your on-premise monitoring stack.

Traffic mirroring with implemented vTAP software solutions ensures that all system and network traffic is visible, regardless of origin or destination. The ‘big 3’ public cloud providers (AWS, Azure, Google Cloud) offer features that enable mirroring at a packet level, and there are many 3rd party and open source vTAP solutions readily available on the market.

Packet-Level Monitoring for Visibility at the Point of Data Transmission

As mentioned, the features and tools offered by the top cloud providers allow traffic mirroring down to the packet level. This is very deliberate on their part. Monitoring traffic and data at a packet level is vital for any effective visibility solution in a hybrid environment.

In a hybrid environment, data travels back and forth between public and on-premise regions of your architecture regularly. This can make tracing, logging, and (most importantly) finding the origin points of errors a challenge. Monitoring your architecture at a packet level makes tracing the journey of your data a lot easier.

For example, monitoring at the packet level picks up on failed cyclic redundancy checks and checksums on data traveling between public and on-premise components. Compromised data is filtered upon arrival. What’s more, automated alerts when packet loss spikes allow your engineers to isolate and fix the offending component before the problem potentially spirals into a system-wide outage.

Verifying data integrity and authenticity in real-time quickly identifies faulty components or vulnerabilities by implementing data visibility at the point of transmission. There are much higher levels of data transmission in hybrid environments. As such, any effective monitoring solution must ensure that data isn’t invisible while in transit.

Overcoming the Topology Gulf

Monitoring data in motion is key, and full visibility of where that data is traveling from and to is just as important. A topology of your hybrid architecture is far more critical than it is in a wholly on-premise infrastructure (where it is already indispensable). Without an established map of components in the ecosystem, your monitoring stack will struggle to add value.

Creating and maintaining an up-to-date topology of a hybrid-architecture is a unique challenge. Many legacy monitoring tools lack scope beyond on-premise infrastructure, and most cloud-native tools offer visibility only within their hosted service. Full end-to-end discovery must overcome the gap between on-premise and public monitoring capabilities.

On the surface, it requires a lot of code change and manual reconfigurations to integrate the two. Fortunately, there are ways to mitigate this, and they can be implemented from the early conceptual stages of your hybrid-cloud transformation.

Hybrid Monitoring by Design

Implementing a hybrid monitoring solution post-design phase is an arduous process. It’s difficult to achieve end-to-end visibility if the components of your architecture are deployed and in use.

One of the advantages of having components in the public cloud is the flexibility afforded by access to an ever-growing library of components and services. However, utilizing this flexibility means your infrastructure is almost constantly changing, making both discovery and mapping troublesome. Tackling this in the design stage ensures that leveraging the flexibility of your hybrid architecture doesn’t disrupt the efficacy of your monitoring stack.

By addressing real-time topology and discovery in the design stage, your hybrid-architecture and all associated operational tooling will be built to scale in a complimentary manner. Designing your hybrid-architecture with automated end-to-end component/environment discovery as part of a centralized monitoring solution, as an example, keeps all components in your infrastructure visible regardless of how large and complex your hybrid environment grows.

Avoiding Strategy Silos

Addressing monitoring at the design stage ensures that your stack can scale with your infrastructure with minimal manual reconfiguration. It also helps avoid another common obstacle when monitoring hybrid-cloud environments, that of siloed monitoring strategies.

Having a clearly established, centralized monitoring strategy keeps you from approaching monitoring on an environment-by-environment basis. Why should you avoid an environment-by-environment approach? Because it quickly leads to siloed monitoring stacks, and separate strategies for your on-premise and publicly hosted systems.

While the processes differ and tools vary, the underpinning methodology behind how you approach monitoring both your on-premise and public components should be the same. You and your team should have a clearly defined monitoring strategy to which anything implemented adheres to and contributes towards. Using different strategies for different environments quickly leads to fragmented processes, poor component integration, and ineffective architecture-wide monitoring.

Native Tools in a Hybrid Architecture

AWS, Azure, and Google all offer native monitoring solutions — AWS Cloudwatch, Google Stackdriver, and Azure Monitor. Each of these tools enables access to operational data, observability, and monitoring in their respective environments. Full end-to-end visibility would be impossible without them. While they are a necessary part of any hybrid-monitoring stack, they can also lead to vendor reliance and the aforementioned siloed strategies we are trying to avoid.

In a hybrid cloud environment, these tools should be part of your centralized monitoring stack, but they should not define it. Native tools are great at metrics collection in their hosted environments. What they lack in a hybrid context, however, is the ability to provide insight across the entire infrastructure.

Relying solely on native tools won’t provide comprehensive, end-to-end visibility. They can only provide an insight into the public portions of your hybrid-architecture. What you should aim for is interoperability with these components. Effective hybrid monitoring taps into these components to use them as valuable data sources in conjunction with the centralized stack.

Defining ‘Normal’

What ‘normal’ looks like in your hybrid environment will be unique to your architecture. It can only be established when analyzing the infrastructure as a whole. While the visibility of your public cloud components is vital, it is only by analyzing your architecture as a whole that you can define what shape ‘normal’ takes.

Without understanding and defining ‘normal’ operational parameters it is incredibly difficult to detect anomalies or trace problems to their root cause. Creating a centralized monitoring stack that sits across both your on-premise and public cloud environments enables you to embed this definition into your systems.

Once your system is aware of what ‘normal’ looks like as operational data, processes can be put in place to solidify the efficiency of your stack across the architecture. This can be achieved in many ways, from automating anomaly detection to setting up automated alerts.

You Can’t Monitor What You Can’t See

These are just a few of the considerations you should take when it comes to monitoring a hybrid-cloud architecture. The exact challenges you face will be unique to your architecture.

If there’s one principle to remember at all times, it’s this: you can’t monitor what you can’t see.

When things start to become overcomplicated, return to this principle. No matter how complex your system is, this will always be true. Visibility is the goal when creating a monitoring stack for hybrid cloud architecture, the same as it is with any other.

5 Technical Metrics You Need for Observability in Marketing

Metrics measuring user engagement on your website are crucial for observability in marketing. Metrics will help marketing departments understand which of your web pages do not provide value for your business. Once known, developers can look at the web page’s technical metrics and determine if updates are required.

Typically user engagement statistics, like the average time required to load your page, are stored separately from technical site logs. User engagement is often affected by a web page’s technical behavior; it is crucial to compare technical and key marketing metrics for observability.

Referring to both marketing and technical data in the same environment can give companies even more insight into why users show specific behavior trends when engaging with the website. 

Tools Exist to Record Marketing Data.

There are many tools available that record analytic data and give observability in marketing statistics required to troubleshoot website content and behavior. Tools like Tableau can provide observability in marketing directives by tracking user’s behavior. Different analytic tools can track marketing metrics differently, but more important than the tools you’ll use is your understanding of how to measure marketing success in observability. 

Let’s take a look at 5 top technical metrics for observability in marketing.

1. Bounce Rate

What is Bounce Rate?

Bounce rate is a metric that compares the number of users who hit your webpage with the number of users who take absolutely no action once they get there. The user has only reached the landing page and not engaged with it at all before leaving. A bounce rate between 26-40% is ideal, but 26-70% is typical of webpages.

What Does Having a High Bounce Rate Mean?

A high bounce rate means most of your website visitors leave before engaging with your content. The users have not found what they wanted from your landing page, or your page has not convinced them that the content is worth looking into more deeply.

What Can Cause a High Bounce Rate?

Many different things can cause a high bounce rate. The user may have gone to the wrong page, they may not have understood the page’s content and decided to go elsewhere, or your content might not have met their needs. Designers can solve each of these issues by editing your content, helping visitors gain value from your content. 

A slow loading time on your website can also cause a high bounce rate. Users who only visit the landing page may turn away if the page does not load efficiently, or if not all assets load soon after arrival.

Developers can record load times in technical logs, providing information to see if their poor-performing pages correlate with slowing load times. A blank page or page with a server-side error such as resources not being found could also cause users to leave your landing page without interacting with it.

Alternatively, developers may have deployed a new feature to your webpage, causing a scheduled page outage. This outage would raise your bounce rate for some time. It would be useful to align bounce rate with outages on a time graph to correlate these events.

What Does Having a Low Bounce Rate Mean?

A low bounce rate is generally a positive thing. However, typically when the bounce rates are too low, data from the website is not being collected properly. Well-designed and implemented web pages still usually have a bounce rate above 25%.

Low bounce rates generally mean that there is an issue measuring bounce rate. Check the setup of your analytics software to ensure it measures your metrics properly. Most analytic software will provide tips for troubleshooting your metrics to ensure they are tracking accurate data.

2. Page Depth

What is Page Depth?

Page depth, or pages per session, is a measurement of the number of pages in your website visited by a user during a session. Designers and developers use average page depth to understand how interested visitors are in your content.

Ideal page depth values will differ depending on your website and how many internal links you have. Search engines will see deep pages as less critical and do not show them in searches, so effective website designs tend to have a total page depth of less than 5

What Does Having a Low Average Page Depth Mean?

When you look at your page depth, you want to look at depth values for each group of pages and not necessarily for your entire website. Looking at sections will let you know which of your pages needs attention and which are performing.

A low page depth (compared to the number of available pages) per group means that users are not inspired to act on your pages, and you need to revise them to meet your goals.

What Can Cause a Low Average Page Depth?

Designers will need to identify what is blocking users from taking the next link you provide to a page. It could be that they lose interest in your content, so it needs to be revised to be more engaging. However, the issue could also be a server-side error like the webpage not being found or having too big of a data request. Look at page depth in conjunction with server-side errors in a graph to see if errors frequently occur on pages with low depth before editing content.  

3. Average Session Duration

What is the Average Session Duration?

Average session duration tells designers how long users spend interacting with your website. The measurement is typically between when the user first engages with your site until that session ends.

If the user returns later, that is considered a new session, and the session counts as a returning visitor. Exactly when that session begins and ends depends on your analysis-collecting software. Acceptable average session durations are typically considered anything over 3 minutes.

What Does Having a Low Average Session Duration Mean?

Today almost everything is accessible online. Websites and apps compete for users’ attention more than any other commodity. The time users spend on your page is valuable no matter what your product.

If this time is low, you need to look at your website’s goal and how you can convey value to your users immediately.  Likewise, users have little patience for error-filled websites, and you will lower your average session duration if you have prolonged or repeated technical issues. 

What Can Cause a Low Average Session Duration?

If your average session duration is low, compare it to technical metrics to determine if there is something wrong with your website rather than your content. Server errors causing web content not to load would easily cause users to leave your page since they don’t have a chance to see what value you are trying to provide. 

Another common way to increase average session duration is to add videos to web pages. Videos tend to have longer load times due to their size. Tracking this load time alongside your average session duration is also valuable to know if your video has the desired effect or causes users to bounce more readily from your website.

4. Returning Visitors

How Are Returning Visitors Measured?

The measurement of returning users is dependent on which analytics software you use. For example, Google Analytics creates a client identifier and places it in a cookie on the user’s device. When the user returns, Google Analytics recognizes the client identifier and logs the user as a returning visitor.

Returning visitors are crucial to track because they are more than 70% more likely to provide successful conversions for your company than first-time visitors. 

How Can You Improve Visitor Return Rates?

There are a few ways to improve visitor return to your website. You could send out emails, use social media, or create a push notification list. Push notifications will send users a message on their desktop or mobile device. When they click on the notification, the notification will automatically direct users to the pre-set webpage.

Suppose you are using a service for push notifications, like AWS Simple Notification Service (SNS). In that case, you will want to keep track of technical logs showing any errors in push notifications or your logic surrounding them.

If you set up notifications expecting a rise in visitor return rates, a simple item to check first would be if your service sent the message as expected. It is also useful to see if your return rates spike immediately following this communication with your users so you can see if they are effective at getting users to return to your site. Again, combining your return rate metrics with SNS logging would be useful here.  

5. Conversion Rate

What is the Site Conversion Rate?

Conversions are the ultimate goal of a webpage, what your website seeks to acquire from a user. A conversion is when a user takes some action that you require of them. Conversions could be having a user sign up for a service, make a purchase, download a whitepaper, schedule a demonstration, or some other activity.

Conversion rates compare the users who have completed the solicited action against all users who visited your page.

What Causes a Low Conversion Rate?

The cause of a low conversion rate somewhat depends on what the conversion activity is. For conversions involving a purchase, extra costs such as shipping are the biggest reason for abandoning a cart. But, no matter the action, there are common technical issues that can cause a low conversion rate. 

Users tend to leave pages that load slowly. Your site could lose 25% of its users if the load time is more than four seconds. Many customers expect that pages should take two seconds or less to load.  Correlating your conversion rate to page load time should tell you if this is the cause of the low conversion rate.

Web pages that crash or freeze also reduce conversion rates. Crashes can be caused by unhandled status codes being returned from any APIs used on your webpage, or by trying to load data that is not expected into your page. Freezes are often caused by your webpage being caught in an infinite loop or memory leak somewhere in the code behind your webpage.

These connectivity issues can especially be an issue with mobile devices where network connections can cause problems loading your page. Crashes can make users have a poor perception of not only your website but your brand, making them less likely to return and produce a conversion at a later time.

Logging these website errors alongside conversion rates in time can show correlations between conversion rate changes and issues with your webpage.

Summary

Observability in marketing metrics is crucial for understanding your website’s working pages and which pages need work. Seeing metrics alongside technical metrics will show marketing departments which pages designers should rewrite and which developers should improve technically. 

The Coralogix Observability Platform enables users to see anomalous technical issues in real-time which should indicate to any developers that they could be affecting the user experience of website visitors. Coralogix supports input from any data source and type including .NET, NodeJS, and Java which are commonly used in web development.

If combined with data marketing metric tools like Tableau, developers and designers can see the real impact that specific technical issues like page load time have had on their user experience.

Bounce rate, conversion rate, return visitors, average session duration, and page depth are all affected by page load time. Website errors and crashes also significantly reduce conversion rates. Showing page load time and error analyses in the same logging console as marketing metrics can help marketing departments pinpoint potential causes of less-than-ideal rates and work efficiently to fix their website and improve their business.

Why Your Mean Time to Repair (MTTR) Is Higher Than It Should Be

Mean time to repair (MTTR) is an essential metric that represents the average time it takes to repair and restore a component or system to functionality. It is a primary measurement of the maintainability of an organization’s systems, equipment, applications and infrastructure, as well as its efficiency in fixing that equipment when an IT incident occurs.

Key challenges with MTTR arise from just trying to figure out that there is actually a problem. Incorrect diagnosis or inadequate repairs can also lengthen MTTR. A low MTTR indicates that a component or service of a distributed system can be repaired quickly and, consequently, that any IT issues associated with it will probably have a less significant impact on the business. 

Challenges With Mean Time To Repair (MTTR)

The following section will describe some of the challenges faced with managing MTTR. In essence trying to show that a high MTTR for an application, device or system failure, can result in a significant service interruption and thus a significant business impact.

Here are 6 common issues that contribute to a high (i.e. poor) MTTR:

1. Lack of Understanding Around Your Incidents

To start reducing MTTR, you need to better understand your incidents and failures. Modern enterprise software can help you automatically unite your siloed data to produce a reliable MTTR metric and valuable insights about contributing factors.

By measuring MTTR, you accept that sometimes things will go wrong. It is just a part of development. Once you’ve accepted that the development process is about continuously improving, analyzing and collecting feedback, you will realize that MTTR will lead to better things. Such as faster feedback mechanisms, better logging and processes for making recovery as simple as deployment.

Having a robust incident management action plan, will allow an organization and development teams to have a clear escalation policy that explains what to do if something breaks. The plan will define who to call, how to document what is happening, and how to set things in motion to solve the problem.

It will cover a chain of events that begins with the discovery of an application or infrastructure performance issue, and that ends with learning as much as possible about how to prevent issues from happening again. Thus covering every aspect of a solid strategy for reducing MTTR. 

2. Low-Level Monitoring

A good monitoring solution will provide you with a continuous stream of real-time data about your system’s performance. It is usually presented in a single, easy-to-digest dashboard interface. The solution will alert you to any issues as they arise and should provide credible metrics.

Having proper visibility into your applications and infrastructure can make or break any incident response process.

Consider an example of a troubleshooting process without monitoring data. A server hosting a critical application goes down, and the only ‘data’ available to diagnose the problem is the lack of a power source on the front of the server. An incident response team is forced to diagnose and solve the problem with a heavy amount of guesswork. This leads to a long and costly repair process and a high MTTR.

If you have a monitoring solution with real-time monitoring data flows from the application, server, and related infrastructure it changes the situation drastically. It gives an incident response team an accurate read on server load, memory and storage usage, response times, and other metrics. The team can formulate a theory about what is causing a problem and how to fix it using hard facts rather than guesswork.

Response teams can use this monitoring data to assess the impact of a solution as it is being applied, and to move quickly from diagnosing to resolving an incident. This is a powerful one-two combination, making monitoring perhaps the single most important way to promote an efficient and effective incident resolution process and reduce MTTR.

3. Not Having an Action Plan

When it comes to maintaining a low MTTR, there’s no substitute to a thorough action plan. For most organizations, this will require a conventional ITSM (Information Technology Service Management) approach with clearly delineated roles and responses.

Whatever the plan, make sure it clearly outlines whom to notify when an incident occurs, how to document the incident, and what steps to take as your team starts working to solve it. This will have a major impact on lowering the MTTR.

An action plan needs to follow an incident management policy or strategy. Depending on the dynamics of your organization this can include any of the following approaches.

Ad-hoc Approach

Smaller agile companies typically use this approach. When an incident occurs, the team figures out who knows that technology or system best and assigns a resource to fix it.

Fixed Approach

This is the traditional ITSM approach often used by larger, more structured organizations. Information Technology (IT) is generally in charge of incident management in this kind of environment.

Change management concerns are paramount, and response teams must follow very strict procedures and protocols. In this case, structure is not a burden. It is classed as a benefit.

Fluid Approach

Responses are shaped to the specific nature of individual incidents, and they involve significant cross-functional collaboration and training to solve problems more efficiently. The response processes will continuously evolve over time. A fluid incident response approach allows organizations to channel the right resources and to call upon team members with the right skills, to address situations in which it is often hard to know at first exactly what is happening.

Integrating a cloud-based log management service into an incident management strategy will enable any team to resolve incidents with more immediacy. During an incident, response teams will be able solve a problem under time pressure, and not have to function differently from their day-to-day working activities.  

4. Not Having an Automated Incident Management System

An automated incident management system can send multi-channel alerts via phone calls, text messages and emails, to all designated responders at once. This will significantly save time that would otherwise be wasted attempting to locate and manually contact each person individually.

Using an automated incident management system for monitoring, you have visibility into your infrastructure that can help you diagnose problems more quickly and more accurately.

For example, having real-time data on the volume of a server’s incoming queries and how quickly the server is responding to them will better prepare you to troubleshoot an issue when that server fails. Data also allows you to see how specific actions to repair system components are impacting system performance, allowing you to apply an appropriate solution more quickly.

A new set of technologies has emerged in the past few years that enables incident response teams to harness Artificial Intelligence (AI) and Machine Learning (ML) capabilities, so they can prevent more incidents and respond to them faster. 

These capabilities analyze data generated by software systems in order to predict possible problems, determine the root causes, and drive automation to fix them. It complements your monitoring practices by providing an intelligent feed of incident information alongside your telemetry data. When you use that information to analyze and take action on that data, you will be better prepared for troubleshooting and incident resolution.

5. Not Creating Runbooks

As you develop incident response procedures and establish monitoring and alerting practices, be sure to document them and if possible ‘automate’ them using an incident management runbook automation tool.

Automating the process allows you to execute runbooks and automated tasks for faster, more repeatable and consistent problem resolution. When configured and enabled, you can associate runbooks with a process that tells incident response team members exactly what to do when a specific problem occurs. 

Use runbooks to collect the response team’s knowledge about a given incident-response scenario in one place. In addition to helping you reduce MTTR, runbooks are useful for training new team members, and they are especially helpful when important members of the team leave the organization.

The idea is to use a runbook as a starting point. It will save time and energy when dealing with known issues, and allowing the team to focus on the most challenging and unique aspects of a problem.

6. Not Designating Response Teams and Roles

Clearly defined roles and responsibilities are crucial for effectively managing incident response and lowering MTTR. This includes the definition of roles for Incident Management, First and Second line support.

When constructing an incident response team be sure it has a designated leader who oversees incident response and ensures strong communication with stakeholders within and outside the team, and that all team members are clear on responsibilities.

The incident team lead is responsible for directing both the engineering and communication responses. The latter involves engagement with customers, both to gather information and to pass along updates about the incident and our response to it. The incident team lead must make sure that the right people are aware of the issue.

Each incident may also require a technical lead who reports to the incident team lead. The technical lead typically dictates the specific technical response to a given incident. They should be an expert on the system(s) involved in an incident, allowing them to make informed decisions and to assess possible solutions so they can speed resolution and optimize the team’s MTTR performance.

Another important role that an incident may require is a communications lead. The communications lead should come from a customer service team. This person understands the likely impact on customers and shares these insights with the incident team lead. At the same time, as information flows in the opposite direction, the communications lead decides the best way to keep customers informed of the efforts to resolve the incident.

7. Not Training Team Members For Different Roles

Having focused knowledge specialists on your incident response team is invaluable. However, if you rely solely on these specialists for relatively menial issues, you risk overtaxing them, which can diminish the performance of their regular responsibilities and eventually burn them out. It also handcuffs your response team if that specialist simply is not around when an incident occurs.

It makes sense to invest in cross-training for team members, so they can assume multiple incident response roles and functions. Other members of the team should build enough expertise to address most issues, allowing your specialists to focus on the most difficult and urgent incidents. Comprehensive runbooks can be a great resource for gathering and transferring specialized technical knowledge within your team.

Cross training and knowledge transfer also helps you to avoid one of the most dangerous incident response risks. That being a situation in which one person is the only source of knowledge for a particular system or technology. If that person goes on vacation or abruptly leaves the organization, critical systems can turn into black boxes that nobody on the team has the skills or the knowledge to fix.

You ultimately lower your MTTR by making sure all team members have a deep understanding of your system and are trained across multiple functions and incident-response roles. Your team will be positioned to respond more effectively no matter who is on call when a problem emerges.

Summary

While MTTR is not a magic number, it is a strong indicator of an organization’s ability to quickly respond to and repair potentially costly problems. Given the direct impact of system downtime on productivity, profitability and customer confidence, an organization’s understanding of MTTR and its functions is essential for any technology centric company.

You can mitigate the challenges identified, and ensure a low MTTR by making sure all team members have a deep understanding of your systems and are trained across multiple functions and incident-response roles. It will make your team to be positioned to respond more effectively no matter who is on call when a problem emerges.

Key Differences Between Observability and Monitoring – And Why You Need Both

Monitoring is asking your system questions about its current state. Usually these are performance related, and there are many open source enterprise monitoring tools available. Many of those available are also specialized. There are tools specifically catering to application monitoring, cloud monitoring, container monitoring, network infrastructure… the list is endless, regardless of the languages and tools in your stack.

Observability is taking the data from your monitoring stack and using it to ask new questions of your system. Examples include finding and highlighting key problem areas or identifying parts of your system that can be optimized. A system performance management stack built with observability as a focus enables you to then apply the answers to those questions in the form of a refined monitoring stack.

Observability and Monitoring are viewed by many as interchangeable terms. This is not the case. While they are interlinked, they are not interchangeable. There are actually very clear and defined differences between them.

Why You Need Both Observability and Monitoring

You can see why Observability and Monitoring are so often grouped together. When done properly, your Observability and Monitoring stacks will operate in a fluid cycle. Your Monitoring stack provides you with detailed system data, your Observability stack turns these analytics into insights, those insights are in turn applied to your Monitoring stack to enable it to produce better data.

What you gain from this process is straightforward – visibility.

System visibility in any kind of modern software development is absolutely vital. With development life-cycles becoming evermore defined by CI/CD, containerization, and complex architectures like microservices, contemporary engineers are tasked with keeping watch over an unprecedented amount of sources for potential error.

The best Observability tools in the world can provide little to no useful analysis if they’re not being fed by data from a solid Monitoring stack. Conversely, a Monitoring stack does little but clog up your data storage with endless streams of metrics if there’s no Observability tooling present to collect and refine the data.

It is only by combining the two that system visibility reaches a level which can provide a quick picture of where your system is and where it could be. You need this dual perspective, too, as in today’s forever advancing technical landscape no system is the same for long.

More Progress, More Problems

Without strong Observability and Monitoring, you could be only 1-2 configurations or updates away from a system-wide outage. This only becomes more true as your system expands and new processes are implemented. Growth brings progress, and in turn, progress brings further growth.

From a business perspective this is what you want. If your task is to keep the tech your business relies on running smoothly, however, growth and progress mean more systems and services to oversee. They also mean change. Not only will there be more to observe and monitor, but it will be continually different. The stack your enterprise relies on in the beginning will be radically different five years into operation.

Understanding where monitoring and observability differ is essential if you don’t want exponential growth and change to cause huge problems in the future of your development life-cycle or BAU operations.

Only through an established and healthy monitoring practice can your observability tools provide the insights needed to preempt how impending changes and implementations will affect the overall system. Conversely, only with solid observability tooling can you ensure the metrics you’re tracking are relevant to the current state of the system infrastructure.

A Lesson From History

Consider the advent of commercially available cloud computing and virtual networks. Moving over to Azure or AWS brought many obvious benefits. However, for some, it also brought a lot of hurdles and headaches.

Why?

Their Observability and Monitoring stacks were flawed. Some weren’t monitoring those parts of their system which would be put under strain from the sudden spike in internet usage, or were still relying on Monitoring stacks built at a time when most activity happened on external servers. Others refashioned their monitoring stacks accordingly but, due to lack of Observability tools, had little-to-no visibility over parts of their system that extended into the cloud.

Continuous Monitoring/Continuous Observability

DevOps methodology has spread rapidly over the last decade. As such, the implementation of CI/CD pipelines has become synonymous with growth and scaling. There are many advantages of Continuous Implementation/Continuous Development, but at their core, CI/CD pipelines are favored because they enable a rapid release approach to development.

Rapid release is great from a business perspective. It allows the creation of more products, faster, which can be updated and re-released with little-to-no disruption to performance. On the technical side, this means constant changes. If a CI/CD pipeline process isn’t correctly monitored and observed then it can’t be controlled. All of these changes need to be tracked, and their implications on the wider system need to be fully understood.

Rapid Release – Don’t Run With Your Eyes Shut

There are plenty of continuous monitoring/observability solutions on the market. Investing in specific tooling for this purpose in a CI/CD environment is highly recommended. In complex modern development, Observability and Monitoring mean more than simply tracking APM metrics.

Metrics such as how many builds are run, and how frequently, must be tracked. Vulnerability becomes a higher priority as more components equal more weak points. The pace at which vulnerability-creating faults are detected must keep up with the rapid deployment of new components and code. Preemptive alerting and real-time traceability become essential, as your development life-cycle inevitably becomes tied to the health of your CI/CD pipeline.

These are just a few examples of Observability and Monitoring challenges that a high-frequency CI/CD environment can create. The ones which are relevant to you will entirely depend on your specific project. These can only be revealed if both your Observability and Monitoring stacks are strong. Only then will you have the visibility to freely interrogate your system at a speed that keeps up with quick-fire changes that rapid-release models like CI/CD bring.

Back to Basics

Complex system architectures like cloud-based microservices are now common practice, and rapid release automated CI/CD pipelines are near industry standards. With that, it’s easy to overcomplicate your life cycle. Your Observability and Monitoring stack should be the foundation of simplicity that ensures this complexity doesn’t plunge your system into chaos.

As much as there is much to consider, it doesn’t have to be complicated. Stick to the fundamental principles. Whatever shape your infrastructure takes, as long as you are able to maintain visibility and interrogate your system at any stage in development or operation you’ll be able to reduce outages and predict the challenges any changes bring.

The specifics of how this is implemented may be complex. The goal, the reason you’re implementing them, is not. You’re ensuring you don’t fall behind change and complexity by creating means to take a step back and gain perspective.

Observability and Monitoring – Which Do You Need To Work On?

As you can see, Observability and Monitoring both need to be considered individually. While they work in tandem, each has a specific function. If the function of one is substandard, the other will suffer.

To summarize, monitoring is the process of harvesting quantitative data from your system. This data will take the form of many different metrics (query, error, processing, events, traces etc). Monitoring is asking questions of your system. If you know what it is you want to know, but your data isn’t providing the answer from your system, your Monitoring stack that needs work.

Observability is the process of transforming collected data into analysis and insight. It is the process of using existing data to discover and inform what changes may be needed and which metrics should be tracked in the future. If you are unsure what it is you should be asking when interrogating your system, Observability should be your focus.

Remember, as with all technology, there is never a ‘job done’ moment when it comes to Observability and Monitoring. It is a continuous process, and your stacks, tools, platforms, and systems relating to both should be constantly evolving and changing. This piece lists but a few of the factors software companies of all sizes should be considering during the development life-cycle.

How DevOps Monitoring Impacts Your Organization

DevOps logging monitoring didn’t simply become part of the collective engineering consciousness. It was built, brick by brick, by practices that have continued to grow and flourish with each new technological innovation.

Have you ever been forced to sit back in your chair, your phone buzzing incessantly, SSH windows and half-written commands dashing across your screen, and admit that you’re completely stumped? Nothing is behaving as it should and your investigations have been utterly fruitless. For a long time, this was an intrinsic part of the software experience. Deciphering the subtle clues left behind in corrupted log files and overloaded servers became a black art that turned many away from the profession.

DevOps observability is still somewhat changing, and many will have different ways to score how observable a system is. Within DevOps monitoring, There are three capabilities that continue to make themselves key in every organization. Monitoring, logging monitoring, and alerting.

By optimizing for these capabilities, we unlock a complex network of software engineering success that can change everything from our attitude, to our risk exposure, or to our deployment process.

DevOps Monitoring – What is it?

Along the walls of any modern engineering office, televisions and monitors flick between graphs of a million different variations. DevOps Monitoring is something of an overloaded term, but here we will use it to describe the human-readable rendering of system measurements.

In a prior world, it would have been enough to show a single graph, perhaps accompanied by a few key metrics. These measurements would give the engineers and support staff the necessary overview of system health. Complexity was baked into the same application back then, so the DevOps monitoring burden was less heavy. Then, microservices became the new hotness.

We could scale individual components of our system, making flexible, intelligent performance. Builds and deployments were less risky because our change impacted only a fraction of our system. Alas, simply seeing what is going on became an exponentially more difficult challenge. Faced with this new problem, our measurements needed to become far more sophisticated.

If you have five services, there are now five network hops that need to be monitored. Are they sufficiently encrypted? Are they running slowly? Perhaps one of the services responds with an error for 0.05 seconds while another service that it depends on restarts. Maybe a certificate is running out. Some high-level measurements aren’t going to adequately lead your investigating engineers to the truth when so much more is going on.

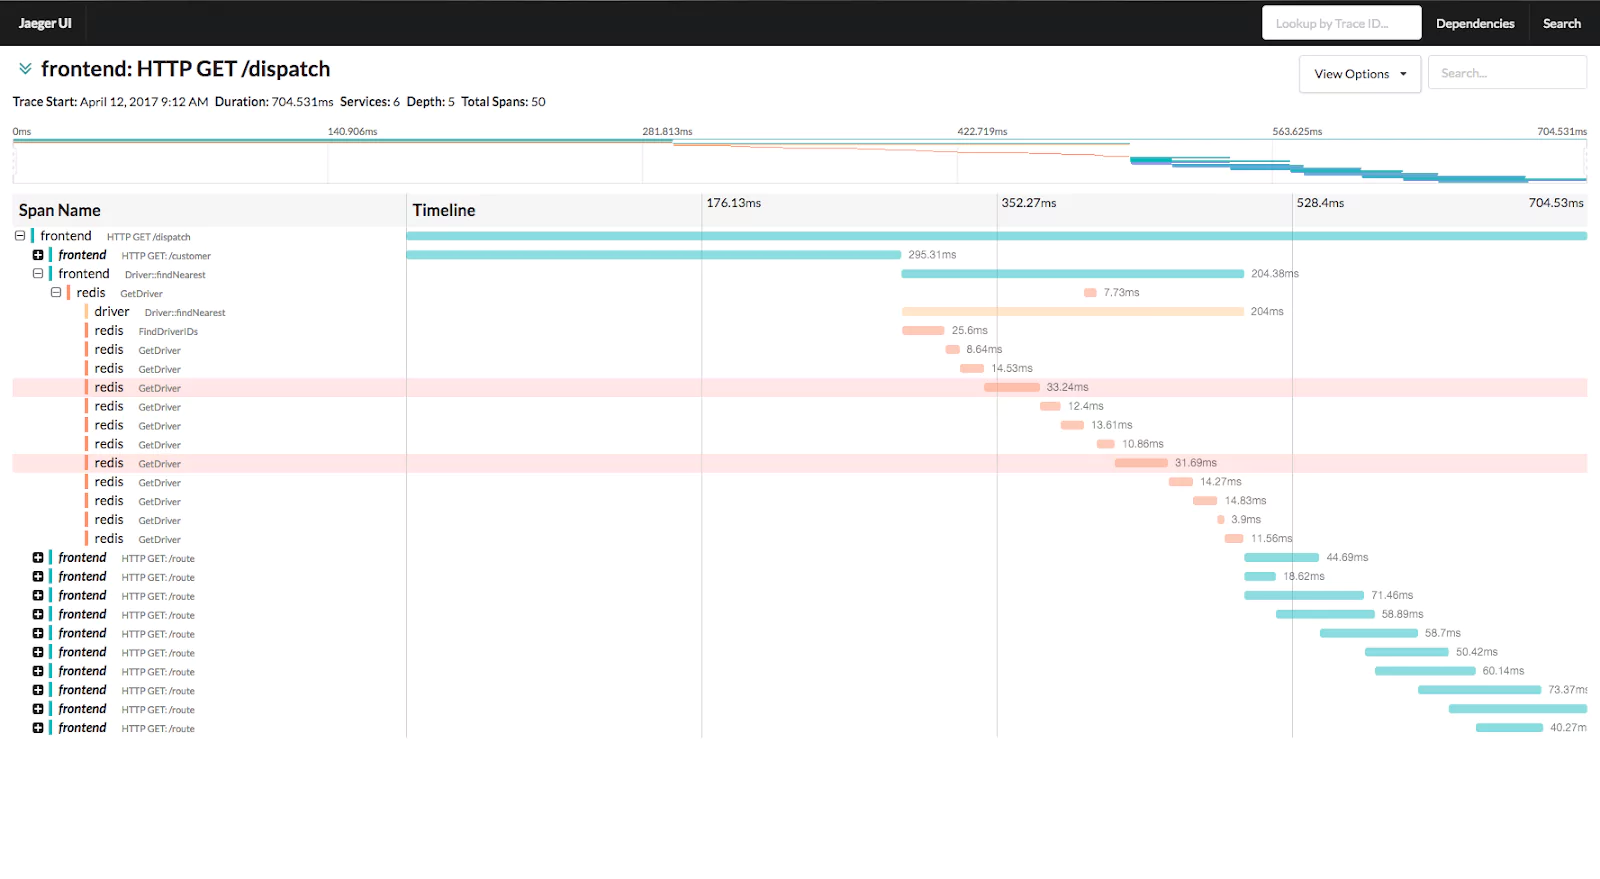
Likewise, if a single request passes through 10 different services on its journey, how do we track it? We call this property traceability and it is an essential component of your monitoring stack.

pasted image 0 8

Tools such as Jaeger (pictured above) provide a view into this. It requires some work from engineers to make sure that some specific values are being passed between requests, but the pay off is huge. Tracking a single request and seeing which components are slowing you down gives you an immediate tool to investigate your issues.

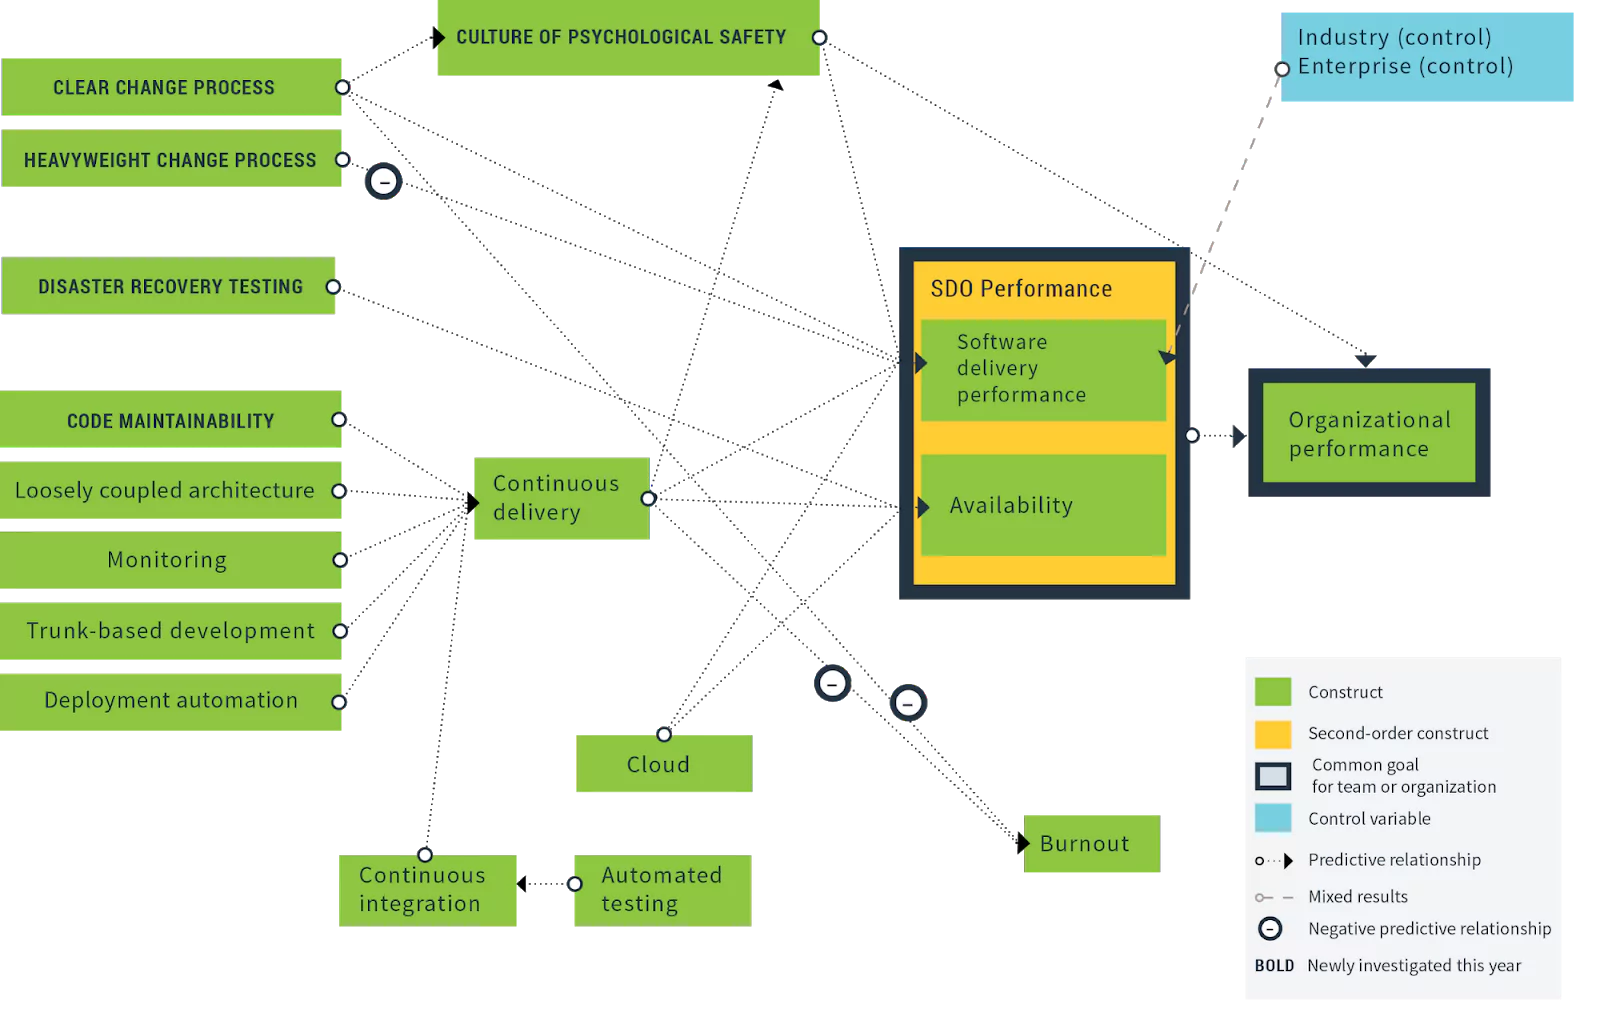
The DORA State of DevOps 2019 report even visualized the statistical relationship between monitoring (capturing concepts we cover here) and both productivity and software delivery performance. It is clear from this diagram that good DevOps monitoring actually trends with improved organizational performance.

pasted image 0 16

Alas, monitoring is based on one single assumption. That when the graphs change, someone is there to see them. This isn’t always the case and as your system scales, it becomes uneconomical for your engineers to sit and stare at dashboards all day. The solution is simple. Information needs to leap out and grab our attention.

Alerting

A great DevOps alerting solution isn’t just about sounding the alarms when something goes wrong. Alerts come in many different flavours and not all of them need to be picked up by a human being. Think of alerting as more of an immune system for your architecture. Monitoring will show the symptoms, but the alerts will begin the processes that fight off the pathogen. HTTP status codes, round trip latencies, unexpected responses from external APIs, sudden user spikes, malformed data, queue depths… They can all be measured according to risk, alerted and dealt with.

Google splits alerts up into three different categories – ticket, alert and page. They increase in severity, but the naming is quite specific. A ticket level alert might simply add a Github issue to a repository, or create a ticket on a Trello board somewhere. Taking that a step further, it might trigger bots that will automatically resolve and close the issue, reducing the overall human toil and freeing up your engineers to focus on value creation.

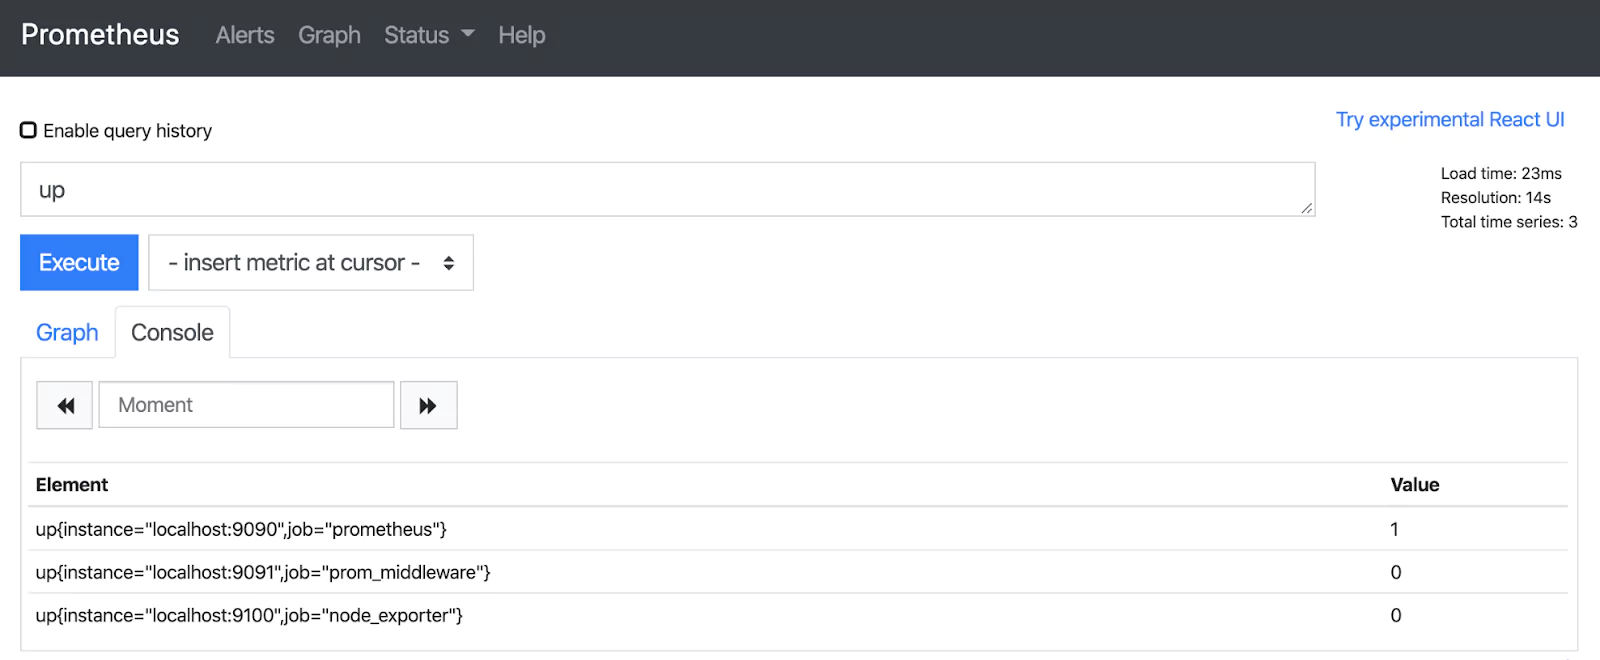
In the open source world, Alertmanager offers a straight forward integration with Prometheus for alerting. It hooks into many existing alerting solutions, such as Pagerduty. As part of a package, organisations like Coralogix offer robust and sophisticated alerting, alongside log collection, monitoring and machine learning analytics, so you can remain part of one ecosystem.

pasted image 0 17

Good alerts will speed up your “mean time to recovery”, one of the four key metrics that trend with organizational performance. The quicker you know where the problem is, the sooner you can get to work. When you couple this with a sophisticated set of monitoring tools, that enables traceability across your services, and efficient, consistent logs that give you fine-grained information about your system’s behavior, you can quickly pin down the root cause and deploy a fix. When your fix is deployed, you can even watch those alerts resolve themselves. The ultimate stamp of a successful patch.

Logging

When we hear the word “logging”, we are immediately transported to its cousin, the “logfile”. A text file, housed in an obscure folder on an application server, filling up disk space. This is logging as it was for years, but software has laid down greater challenges, and logging has answered with vigor. Logs now make up the source of much of our monitoring, metrics, and health checks. They are a fundamental cornerstone of observability. A spike in HTTP 500 errors may tell you that something is wrong, but it is the logs that will tell you the exact line of broken code.

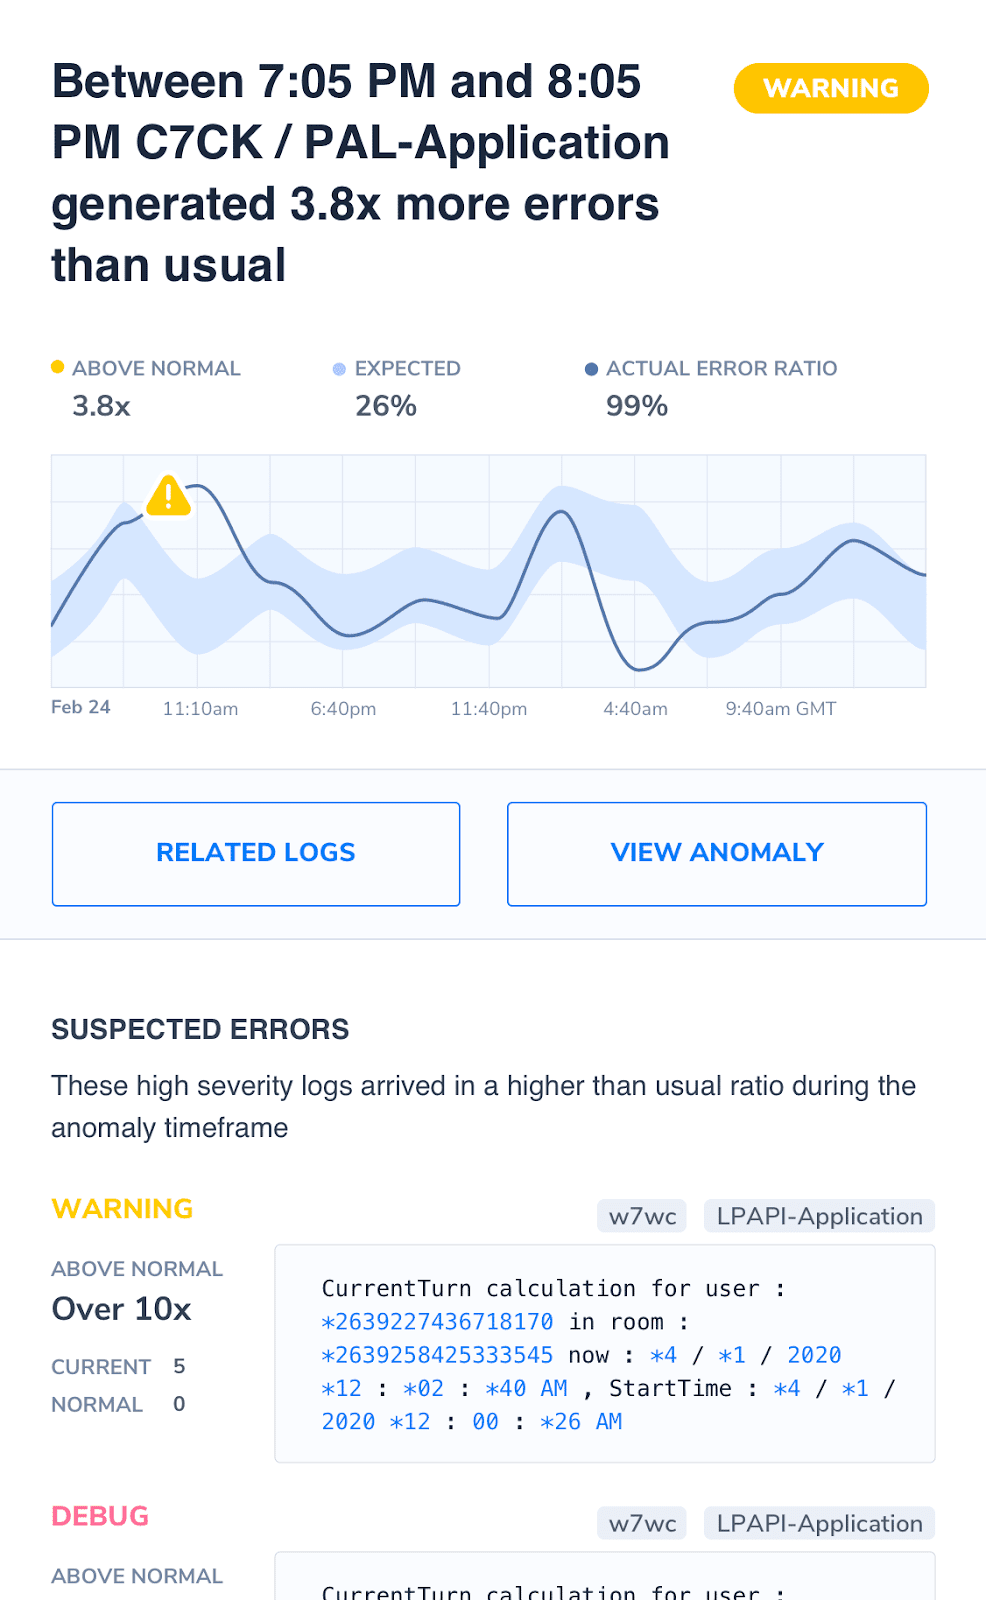
As with DevOps monitoring, modern architectures require modern solutions. The increased complexity of microservices and serverless mean that basic features, such as log collection, are now non-negotiable. Machine learning analysis of log content is now beyond its infancy. As the complexity of your system increases, so too does the operational burden. A DevOps monitoring tool like Coralogix, along with its automatic classification of logs into common templates coupled with the version benchmarks makes it possible to immediately see if some change or version release was the cause of an otherwise elusive bug.

anomaly alert notification

Conclusion

Monitoring is a simple concept to understand, but a difficult capability to master. The key is to decide the level of sophistication that your organization needs and be ready to iterate when those needs change. By understanding what your system is doing and creating layers of complexity, you’ll be able to know, at a glance, if something is wrong.

Combined with alerts, you’ve got a system that tells you when it is experiencing problems and, in some cases, will run its own procedures to solve the problem itself. This level of confidence, automation, and DevOps monitoring changes attitudes and has been shown, time and time again, to directly improve organizational performance.

Over the course of this article, we’ve covered each of the topics and how they complement the monitoring of your system. Now, primed with the knowledge and possibilities that each of these solutions offers, you can begin to look inward and assess how your system behaves, where the flaws are and where you can improve. It is a fascinating journey, and when done successfully, it will pay dividends.

Website Performance Monitoring – You Are Doing It Wrong

With all the data available today, it’s easy to think that tracking website performance is as simple as installing a few tools and waiting for alerts to appear. Clearly, the challenge to site performance monitoring isn’t a lack of data. The real challenge is understanding what data to look at, what data to ignore, and how to interpret the data you have. Here’s how.

There are five common mistakes that administrators make when tracking website performance. Avoiding these mistakes does not require purchasing any new tools. In order to efficiently avoid these mistakes, you simply need to learn how to work more intelligently with the data visualization tools you already have.

Mistake #1 – Not Considering the End-User Experience

When it comes to things like response times, it’s easy to rely on “objective” speed tests and response logs to determine performance, but that can be a mistake. The speed that is often more important is the perceived speed performance, or how fast an end-user thinks the site is.

Back in 1993, usability expert, Jakob Nielsen pointed out that end users think a 100 millisecond response time is instantaneous and that a one-second response time is acceptable. These are the kinds of measurements you must make, to accommodate end-users, and not rely solely on “backend” data.

Mistake # 2 – Letting Common Errors Obscure New Errors

Common errors, by definition, make up the bulk of the weblog data. These errors occur so often that it’s easy to ignore them. The problem occurs when among a large number of common errors hides a new, unique error that gets missed because of all of the “noise” around it.

It is important that your website performance monitoring tool has the ability to quickly identify these “needles in a haystack.” Short of that, it is essential that the long trail of common errors be mined for new errors. This can give valuable clues to forthcoming performance problems.

Mistake # 3 – Ignoring Old Logs

It’s easy for IT folks to not want to go back and investigate older logs, say greater than one year, but that can be a mistake. Being able to go back and evaluate large quantities of older data, using simplifying techniques such as log patterns or other graphical means, can give great insight. It can also help highlight a slow-developing problem that could easily get missed by strictly focusing on the most recent results.

When establishing site performance monitoring policies, make sure they specify enough historical data to give you the results you need. Assuming you use a site management tool that can accommodate large data sets, it’s better to err on the side of too much data than not enough.

Mistake # 4 – Setting the Wrong Thresholds

Website performance tracking is only as good as the alert thresholds set. Set them too high and you miss a critical event. Set them too low and you get a bunch of false positives which eventually lead to ignoring them.

The reality is that some servers or services being monitored are more prone to instantaneous or temporary performance degradation. This is enough to trigger an alert, but not sufficient to bring it down, and could be due to traffic load or a routing issue. Whatever the reason, the only way around this is trial and error. Make sure you spend the time to optimize the threshold levels for all your systems to give you the actionable information you need.

Mistake #5 – Only Paying Attention to Critical Alerts

The sheer volume of site performance data makes it natural to want to ignore it all until a critical alert appears, but that can be a mistake. Waiting for a critical alert may result in a system outage, which could then impact your ability to meet your Service Level Agreements, and possibly even lead to liquidated damages.

Rarely do systems fail without giving some clues first. It is imperative that you mine your existing data to develop a predictive ability over time. You also need to understand which site performance metrics are worth paying attention to before it costs you any money.

There you have it. Five mistakes to avoid when monitoring website performance. Not more data, but more intelligent use of existing data.