AWS Lambda Telemetry API: Enhanced Observability with Coralogix AWS Lambda Telemetry Exporter

AWS recently introduced a new Lambda Telemetry API giving users the ability to collect logs, metrics, and traces for analysis in AWS services like Cloudwatch or a third-party observability platform like Coralogix. It allows for a simplified and holistic collection of AWS observability data by providing Lambda extensions access to additional events and information related to the Lambda platform.

Leveraging the release of the AWS Lambda Telemetry API, we have built a newly optimized Lambda extension called Coralogix AWS Lambda Telemetry Exporter to further streamline the collection of logs, metrics, and traces for monitoring, alerting, and correlation in the Coralogix platform.

This post will discuss the benefits of using the new AWS Lambda Telemetry API and cover use cases for leveraging your telemetry data to get you started.

Benefits of New AWS Telemetry API

Prior to the launch of AWS Lambda Telemetry API, Coralogix built an AWS Lambda Extension which collects logs using the AWS Lambda Logs API.

With the launch of AWS’s Lambda Telemetry API, we are now able to support simplified instrumentation for logs, platform traces, and platform metrics with enhanced observability for your Lambda execution environment lifecycle. The Telemetry API provides deeper insights into your Lambda environment with support for new platform metrics and traces.

Getting Started with Coralogix AWS Lambda Telemetry Exporter

The Coralogix AWS Lambda Telemetry Exporter is now available as an open beta. You can deploy it from the AWS Serverless Application Repository

If you have previously used the Coralogix AWS Lambda Extension the deployment process is very similar. You can use the Coralogix AWS Lambda Telemetry Exporter as a richer replacement for the Coralogix AWS Lambda Extension. You will need to adjust the configuration!

For more information about the Coralogix AWS Lambda Telemetry Exporter visit our documentation

Enhanced Observability Use Case

Unlike its predecessor, Coralogix AWS Lambda Telemetry Exporter augments logs from Lambda functions with a span ID, making it easier to analyze related logs and traces in the Coralogix platform.

Observing Lambda Latency

A major benefit of the AWS Lambda Telemetry API is that it provides additional information about the initialization of the AWS Lambda execution environment and other valuable performance indicators. We can collect that information with the Coralogix AWS Lambda Telemetry Exporter and use Coralogix tracing features to better understand latency of Lambda functions.

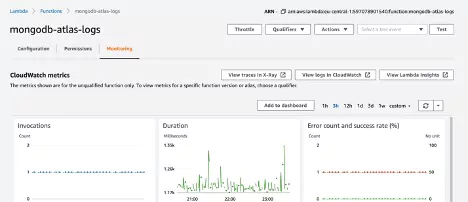
Example: Cold start of Java Lambda

Let’s review an example of a Lambda function written in Java. Typical response times of that function vary between 300ms and 1500ms. We can get a better understanding of what’s happening by looking at the traces.

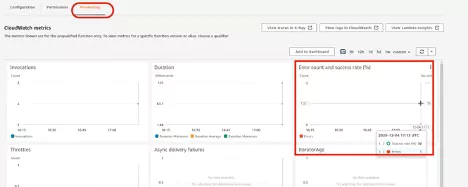
Trace of a warm start Lambda function invocation:

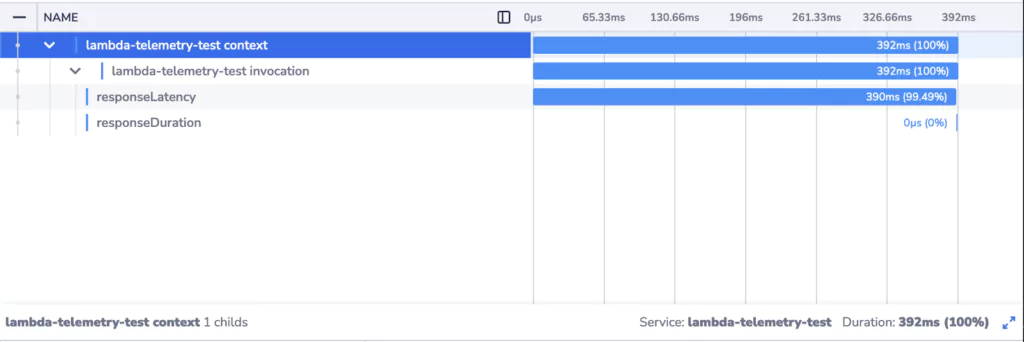
Trace of a cold start Lambda function invocation:

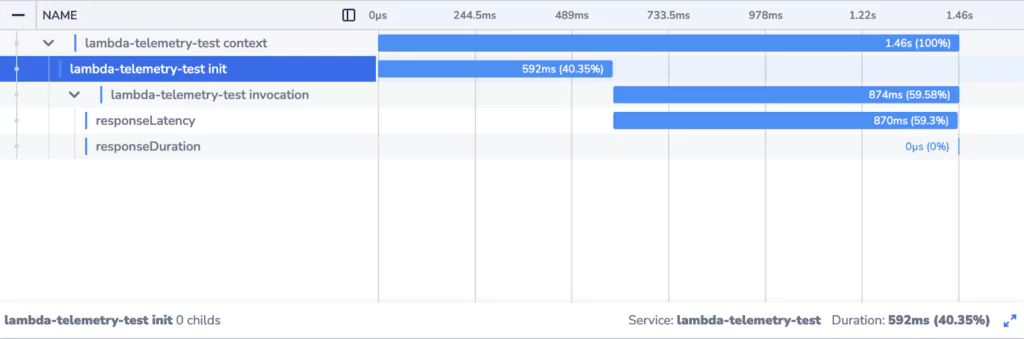
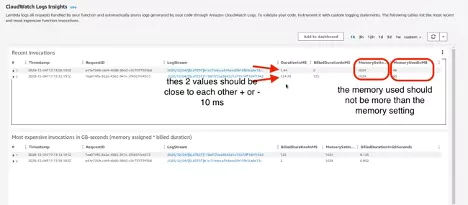
We can clearly see that when a new Lambda instance is initialized, the response times are much higher. There’s an additional element in the trace corresponding to initialization of the Lambda execution environment. The effect of waiting for the initialization to complete is compounded by the fact that the invocation is itself slower. 

Knowing that this is a fresh Lambda instance helps us understand why. The first invocation of the function involves initialization of the function code and dependencies. Platforms utilizing Just-In-Time compilation (Java/JVM being an example of such a platform) in particular will experience longer durations for the first invocation.

Visibility into the initialization process provided by Telemetry API enables you to be better prepared to deal with cold start invocations of your Lambda functions and more quickly detect and address abnormal latency and performance issues.

To get started, visit our documentation.

4 Different Ways to Ingest Data in AWS OpenSearch

AWS OpenSearch is a project based on Elastic’s Elasticsearch and Kibana projects. Amazon created OpenSearch from the last open-source version of ElasticSearch (7.10) and is part of the AWS monitoring system. The key differences between the two are topics for another discussion, but the most significant point to note before running either distribution is the difference in licenses. ElasticSearch now runs under a dual-license model, and OpenSearch remains open-source. 

Like Elasticsearch, OpenSearch can store and analyze observability data, including logs, metrics, and traces. Elasticsearch primarily uses LogStash to load data, and OpenSearch users can choose from several services to ingest data into indices. Which service is best-suited for OpenSearch ingestion depends on your use case and current setup. 

Ingestion Methods for AWS OpenSearch

Data can be written to OpenSearch using the OpenSearch client and a compute function such as AWS Lambda. To write to your cluster directly, the data must be clean and formatted according to your OpenSearch mapping definition. This requirement may not be ideal for writing observability data with formats other than JSON or CSV. 

Data must also be batched appropriately so as not to overwhelm your defined OpenSearch cluster. The cluster setup significantly impacts the cost of the OpenSearch service and should be configured as efficiently as possible. Each of the methods described below requires the cluster to be running before starting to stream data.

AWS allows users to stream data directly from other AWS services into an OpenSearch index without an intermediate step through a compute function. 

AWS Kinesis Firehose

AWS Kinesis is a streaming service that collects, processes, and analyzes data in real time. It is a scalable service and will scale itself up and down based on current requirements. AWS Kinesis Firehose uses the AWS Kinesis streaming service. That also allows users to extract and transform data within the Kinesis queue itself before outputting the data to another service. 

Firehose can also automatically write data to other AWS services like AWS S3 and AWS OpenSearch before outputting the streamed data. Firehose can also send data directly to third-party vendors working with AWS to provide observability services, like Coralogix. The Kinesis stream output data can be handled separately from the automatic writes to other services.

Firehose uses an AWS Lambda to produce any changes requested to the streamed data. Developers can set up a custom Lambda to process streamed data or use one of the blueprint functions provided by AWS. These changes are not required but are helpful for observability data which is often not formatted. Recording data with a JSON format makes analytics simpler for any third-party tools you may utilize. Some tools like Coralogix’s log analytics platform also have built-in parsers that can be used if changing data at the Kinesis level is not ideal. 

Kinesis Firehose is an automatically scalable service. If your platform requires large volumes of data to flow into OpenSearch, this is a wise choice for infrastructure. It will likely be more cost-effective than other AWS services, assuming none are already used. 

AWS CloudWatch

AWS CloudWatch is a service that collects logs from other AWS services and makes them available for display. Compute functions like AWS Lambda and AWS Fargate can send log data to CloudWatch for troubleshooting by DevOps teams. From CloudWatch, data can be sent to other services within AWS or to observability tools to help with troubleshooting. Logs are essential for observability but are most helpful when used in concert with metrics and traces. 

To send log data to OpenSearch, developers first need to set up a subscription. CloudWatch subscriptions consist of a log stream, the receiving resource, and a subscription filter. Each log stream must have its subscription filter set up. A log stream is a set of logs from a single Lambda or Fargate task. Different invocations of the same function do not need a new setup. The receiving resource is the service to which the logs will be sent; in this case, an OpenSearch cluster. Lastly, the subscription filter is a simple setup inside CloudWatch that determines which logs should be sent to the receiving service. You can add filters, so only some of the logs with particular keywords or data present are recorded in OpenSearch. 

Developers may set up a filter where many logs are written to OpenSearch with this setup. The cost of CloudWatch can be complex to calculate, but the more you write, the more it will cost, and the price can increase very quickly. Streaming data to another service will only increase the costs of running your platform. Before using this solution, determine if the cost is worth it compared to other solutions presented here. 

LogStash

Logstash is a data processing pipeline developed by Elastic. It can ingest, transform, and write data to an Elasticsearch or OpenSearch cluster. When using Elastic, the ELK stack includes Logstash automatically, but in AWS, Logstash is not automatically set up. AWS uses the open-source version of Logstash to feed data into OpenSearch. A plugin needs to be installed and deployed on an EC2 server. Developers then configure Logstash to write directly to OpenSearch. AWS provides details on the configuration that sends data to AWS OpenSearch. 

Since Logstash requires the setup of a new server on AWS, it may not be a good production solution for AWS users. Using one of the other listed options may be less expensive, especially if any other listed services are already in use. It can also reduce the amount of engineering setup required. 

AWS Lambda

AWS Lambda is a serverless compute function that allows developers to quickly build custom functionality on the cloud. Developers can use Lambda functions with the OpenSearch library to write data to an OpenSearch cluster. Writing to OpenSearch from Lambda opens the opportunity to write very customized data to the cluster from many different services.

Many AWS services can trigger Lambdas, including DynamoDB streams, SQS, and Kinesis Firehose. Triggering a Lambda to write data directly also means developers can clean and customize data before it is written to OpenSearch. Having clean data means that observability tools can work more efficiently to detect anomalies in your platform. 

An everyday use case might be the need to update a log in OpenSearch with metadata whenever a DynamoDB entry is written or updated. Developers can configure a stream to trigger a Lambda on changes to DynamoDB, and this stream could send either new data alone or new and old data. A data model with pertinent metadata is formed from this streaming information, and Lambda can write it directly to OpenSearch for future analysis. 

AWS IoT

AWS IoT is a service that allows developers to connect hardware IoT devices to the cloud. IoT core supports different messaging protocols like MQTT and HTTPS to publish data from the device and store it in various AWS cloud services. 

Once data is in AWS IoT, developers can configure rules to send the data to other services for processing and storage. The OpenSearch action will take MQTT messages from IoT and store them in an OpenSearch cluster.  

Machine Learning and Observability

When putting logs into OpenSearch, the goal is to get better insights into how your SaaS platform functions. DevOps teams can catch errors, delays in processing, or unexpected behaviors with the correct setup in observability tools. Teams can also set up alerts to notify one another when it’s time to investigate errors. 

Instantiating log analysis or machine learning in AWS OpenSearch is not a simple task, and there is no switch to turn on and gain insight into your platform. It takes significant engineering resources to use OpenSearch for observability with machine learning, and teams would need to build a custom solution. If this type of processing is critical for your platform, consider using an established system like Coralogix that can provide log analysis and alerting to inform when your system is not performing at its best. 

Summary

AWS OpenSearch is an AWS-supported, open-source alternative to Elasticsearch. Being part of the AWS environment, it can be fed data by multiple different AWS services like Kinesis Firehose and Lambda. Developers can use OpenSearch to store various data types through customized mappings, including observability data. DevOps teams can query logs using associated Kibana dashboards or AWS compute functions to help with troubleshooting and log analysis. For a fast setup of machine learning log analytics without needing specialized engineering resources, consider also utilizing the Coralogix platform to maintain your system. 

Next Generation AWS Lambda Functions Powered by AWS Graviton2 Processors

Modern computing has come a long way in the last couple of years and the introduction of new technologies is only accelerating the rate of advancements. From the immense compute power at our disposal to lightning-fast networks and ready-made services, the opportunities are limitless.

In such a fast-paced world, we can’t ignore economics. Services are dormant most of the time only to be woken up to a certain peak or two every day, and paying for server time that isn’t being used can be incredibly expensive.

When AWS observability was introduced Lambdas as their serverless compute solution, everything changed. Why maintain servers and all the wrappers around it when you can just focus on the code. In the last couple of years, we’ve seen more and more workloads being migrated to serverless computing with AWS Lambda functions.

Now there’s a new generation of Lambda that offers even more savings based on ARM CPUs. Arm-based Lambda functions can get up to 34% better price performance over x86-based Lambda functions. And with the world going towards a greener, cleaner world we really all win by getting more power for less carbon footprint. These are exciting times!

AWS Lambda: The Story So Far

But what about the Lambda itself you ask? Lambda started from a basic container or a “wrapper” of sorts for one’s code. As the service gained more traction, more features and extensions were added to it along with various runtimes

Ever since AWS began offering EC2 instances with ARM hardware, we’ve been asking the question – when will AWS bring this awesome technology, with its lower costs and next-level performance, to the world of serverless. Well, the day has come.

This new generation of Lambda is basically the same service but runs on hosting nodes utilizing Graviton2 – ARM64 architecture CPUs.

How we are using the next-gen Lambda

As an AWS Advanced Technology Partner, we at Coralogix were happy for the opportunity to test the next generation of Lambda.

As part of the beta, we created an ARM version of our Lambda extension and tested our SDKs to make sure that when you need them they will be ready for you (and they are!).

Lambda is built with a plug & play infrastructure, meaning you can connect any service you need to it – A gateway, a network, a queue, or even a database. This is a great facilitator to the agility of Lambda as a serverless solution.

Logic within your app can be divided into layers, which allows for the segmentation of processes much like decorators in code. We love layers, and we use them too.

In fact, we offer one to facilitate all of your app logging delivery. Our Coralogix extension layer will collect and funnel all of your logs into Coralogix, and we now offer it for both x86 and arm64 architectures.

Both solutions we offer for Lambda are rather simple to integrate and are well documented on our website.

  • We can offer observability as an SDK for any major platform.
  • A ready-made SAM application offered as a Layer.

What this means for Observability

We at Coralogix are all about observability. Regardless of the architecture or the hardware type of the underlying nodes, we know you need visibility into what is happening with your code at any given time.

This is especially true during a migration to a new architecture. Even when the migration is rather seamless, some pieces of code may behave unexpectedly, and we need to be able to identify any issues and resolve them in as little time as possible. With Coralogix, you can achieve full observability for your cloud-native apps in AWS without worrying about cost or coverage.

Get started with Graviton here.

Tutorial: Set Up Event Streams in CloudWatch

When building a microservices system, configuring events to trigger additional logic using an event stream is highly valuable. One common use case is receiving notifications when errors are seen in one of your APIs. Ideally, when errors occur at a specific rate or frequency, you want your system to detect that and send your DevOps team a notification.

Since AWS APIs often use stateless functions like Lambdas, you need to include a tracking mechanism to send these notifications manually. Amazon saw a need for a service that will help development teams trigger events under custom conditions. To fill this need, they developed CloudWatch Events and subsequently EventBridge.

Introduction to CloudWatch Events

CloudWatch Events and EventBridge are AWS services that deliver data to a target upon occurrence of certain system events. They work on the same backend functionality, with EventBridge having a few more implemented features. System events supported include operational changes, logging events, and scheduled events.

CloudWatch Events will trigger a subsequent event when a system event occurs, sending data to another service based on your setup. Triggered services can include calling Lambda functions, sending SNS notifications, or writing data to a Kinesis Data Stream. 

Event Triggers

AWS represents all events with JSON objects that have a similar structure. They all have the same top-level fields that help the Events service determine if an input matches your requested pattern. If an event matches your pattern, it will trigger your target functionality.

You can use commands to write directly to EventBridge from AWS services like Lambda. Some AWS services like CloudTrail and external tools can also automatically send data to EventBridge. External sources with AWS integrations can also be used as event triggers.

Event Buses

Event buses receive events from triggers. Event triggers and event rules both specify which bus to use so events can be separated logically. Event buses also have associated IAM policies that specify what can write to the bus and update or create event rules and event targets. Each event bus can support up to 100 rules. If you require more event rules, you must use another event bus. 

Event Rules

Event rules are associated with specific event buses. Each rule determines whether events meet certain criteria. When they do, EventBridge sends the event to the associated target. Each rule can send up to 5 different targets which process the event in parallel.

AWS provides templates to create rules based on data sources. Users can also set up custom rules which further filter data based on its contents. For a complete list of available filtering operations, see the AWS specification for content-based filtering.

Event Targets

Event targets are AWS endpoints triggered by events matching your configured pattern. Targets may just receive some of the event trigger data directly for processing.

For example, you can trigger an AWS Lambda function with the incoming event data, using Lambda to process the event further. Targets can also be specific commands like terminating an EC2 instance.

How to Set Up CloudWatch Events in EventBridge

Now that we have covered some parameters of CloudWatch Events, let’s walk through an example of how to set up an event trigger and target.

In this example, we will use the EventBridge interface to set up a rule. The EventBridge interface is very similar to the interface available in CloudWatch. The rule we make will trigger a Lambda when an API Gateway is hit with invalid input. DevOps teams commonly see invalid inputs when nefarious users are trying to get into your API.

1. Create a New Event Bus

This step is optional since AWS does provide a default event bus to use. In this example, we will create a new event bus to use with our rule. Since rules apply to only one event bus, it is common to group similar rules together on a bus. 

create new event bus in eventbridge

2. Name and Apply a Policy to the New Bus

To create your bus, add a name and a policy. There is an AWS template available for use by clicking the load template button, as shown below.

This template shows three common cases that could be used for permissions depending on the triggers and targets used. For more information about setting up the IAM policy, see the AWS security page for EventBridge.

The example below shows permissions for an account to write to this event bus. When ready, press the create button to finish creating your event bus.

create new event bus eventbridge

3. Navigate to the Rules Section in the Amazon EventBridge Service 

In this example, we will skip creating an event bus and use the default provided by AWS. Add a name and optionally add a description for the new rule.

create new rule eventbridge

4. Select Event Pattern 

Here there is an option between two types of rule: event pattern and schedule. Use event pattern when you want to trigger the rule whenever some specific event occurs. Use schedule when you want to trigger the rule periodically or using a cron.

5. Select Custom Pattern

Here there is an option between two types of pattern matching. AWS will route all data for the source through your event bus when you use pre-defined pattern by service

Since we want only specific events from the Lambda behind our API, we will choose custom pattern. The pattern below will look at event values sent from our Lambda function to the event bus. If the event matches our requirements, EventBridge sends the event to the target.

create custom pattern eventbridge

6. Select the Event Bus

Select the event bus for this rule. In this case, we will select our custom bus created in Step 2.

select event bus eventbridge

7. Select Targets

Select targets for your rule by selecting the target type and then the associated instance of the type. In this case, a Lambda function will be invoked when an event matching this rule is seen.

By selecting Matched events, the entire event content will be sent as the Lambda input. Note there is also the capability to set retry policies for events that cause errors in the target functions. After this step, press Create Rule to complete the EventBridge setup.

select targets eventbridge

Once the event bus and rule are created as above, writing to the EventBridge inside the API’s Lambda function will trigger your target Lambda. If using a serverless deployment, the AWS-SDK can be used to accomplish this. 

Processing in the target Lambda should track when errors occur. Developers can create metrics from the errors and track them using custom microservices or third-party tools like Coralogix’s metrics analytics platform.

You can also send raw data to Coralogix for review by directly writing to their APIs from EventBridge instead of hitting a Lambda first. EventBridge supports outputs that directly hit API Gateways, such as the one in front of Coralogix’s log analytics platform.

Wrap Up

Amazon enhanced CloudWatch Rules, creating a unique tool called EventBridge. EventBridge allows AWS users to process events from many different sources selectively. Processing data based on content is useful for processing large, disparate data sets.

Information tracked in EventBridge can also be used for gaining microservice observability. EventBridge uses triggers to send data to an event bus. Event rules are applied to each bus and specify which targets to invoke when an event matches the rule’s pattern. 

In the example above, EventBridge’s configuration will detect invalid API call events. This data is helpful, but at scale will need further processing to differentiate between a nefarious attack and simple errors.

Developers can send data to an external tool such as Coralogix to handle the analysis of the API data and to detect critical issues.

How to Troubleshoot AWS Lambda Log Collection in Coralogix

AWS Lambda is a serverless compute service that runs your code in response to events and automatically manages the underlying compute resources for you. The code that runs on the AWS Lambda service is called Lambda functions, and the events the functions respond to are called triggers.

Lambda functions are very useful for log collection (think of log arrival as a trigger), and Coralogix makes extensive use of them in its AWS integrations.

This post will provide you with few tips on how to troubleshoot a situation where you don’t see or receive logs in Coralogix that are supposed to be collected and shipped by an AWS Lambda function.

7 Common Reasons You Can’t See Your Lambda Logs in Coralogix

The first things to check are some of the most trivial, but still very common, reasons for not seeing your logs within Coralogix (we promise not to tell anyone if this happens to you).

  1. Block Rules– Check whether your data is being blocked by any block rules set in your account under the Settings Menu –> Rules or under TCO (note that these tabs are in the settings menu and are accessible only to the account administrator).
  2. Private Key and Company ID– Make sure your Lambda function is using the correct private key for your account. You can find it in the Settings Menu –> Send Your Logs tab on the top left. For some of the integrations, you might need to also provide the company ID. You can find it in the same place as the Elasticsearch API Key.
  3. Filters– Check if you have any active filters applied in the Coralogix app (e.g. On the top-right for LiveTail or on the left panel in the Logs screen view or the Application/Subsystem dropdowns on the top right of some screens)
  4. Reaching Quota – Check the Coralogix logs or dashboard screens to see if the account reached its daily quota. If your quota has been reached, you’ll see a message on the top of the screen displaying a quota usage warning (sometimes a hard browser refresh is required to see the message).
    coralogix usage
  5. Status Page– Check out the Coralogix status page here. You can also subscribe to it to get live notifications to your email in case there are any issues with our platform.
  6. Your Lambda function environment variables – Verify that you’re sending the mandatory applicationName and subsystemName metadata fields.
  7. Your Lambda function triggers – make sure you have the correct triggers configured in your Lambda by clicking on the Lambda in question and verifying the triggers. If triggering requires changes, click on ‘Add a trigger’ or on the trigger itself to make the appropriate changes.

If none of these have uncovered the problem, the next step is to start and drill into the Lambda itself using AWS’s Lambda function monitoring graphs.

Lambda Function Monitoring

In AWS, go to Services->Lambda->Functions and click on the name of the specific Lambda you are troubleshooting. Then click on Monitoring.

lambda function monitorin

We will use some of these graphs to identify issues with the Lambda.

  • Error count and success rate

When there are errors in the Lambda, you should see a red dot or red line depending on the period the errors have been happening.

lambda error count

  • Invocations and duration time

Using the graphs, compare the duration to historic values when you know the Lambda worked. A significant difference might indicate an issue. You do not want to see a duration that is very short (around 1-2 ms) that tells you that the lambda did not run properly.

You also don’t want to see a Lambda duration that ends with 00 (i.e. example 9000.00). This means that the lambda timed out. In this case, increase the timeout parameter in the lambda configuration. Maximum time out is 15 minutes.

  • Memory usage

Make sure the memory allocated to this Lambda is more than the memory used. If the memory used is more than the memory allocated that indicates that you need to up the memory for the Lambda function.

lambda memory usage

Lambda Invocation Logstream

Check the logstream for the last invocation for the lambda in Cloudwatch. Usually, AWS saves lambda logs in cloudwatch under /aws/lambda/lambda-function-name. You want to check this logstream and see if there are any errors. If there are, take a look and try to fix them.

If none of the above fixed the problem, it is time to dive deeper into the Lambda function and turn on debug mode.

Debug Mode

Each one of our integration Lambda functions is shipped with an optional debug execution mode. Enabling debug is done by removing the comment form the debug line at the bottom of the Lambda function code.

lambda debug mode

You want to check monitoring under the Lambda in question to make sure there are no errors in the log of the LAMBDA execution.

If none of these steps have uncovered the source of the problem, you can always reach out to Coralogix Support to get help with resolving the issue.